
Economy
Trucker Strike Rumors: Would an October 1 Walkout Really Hit the Global Economy?

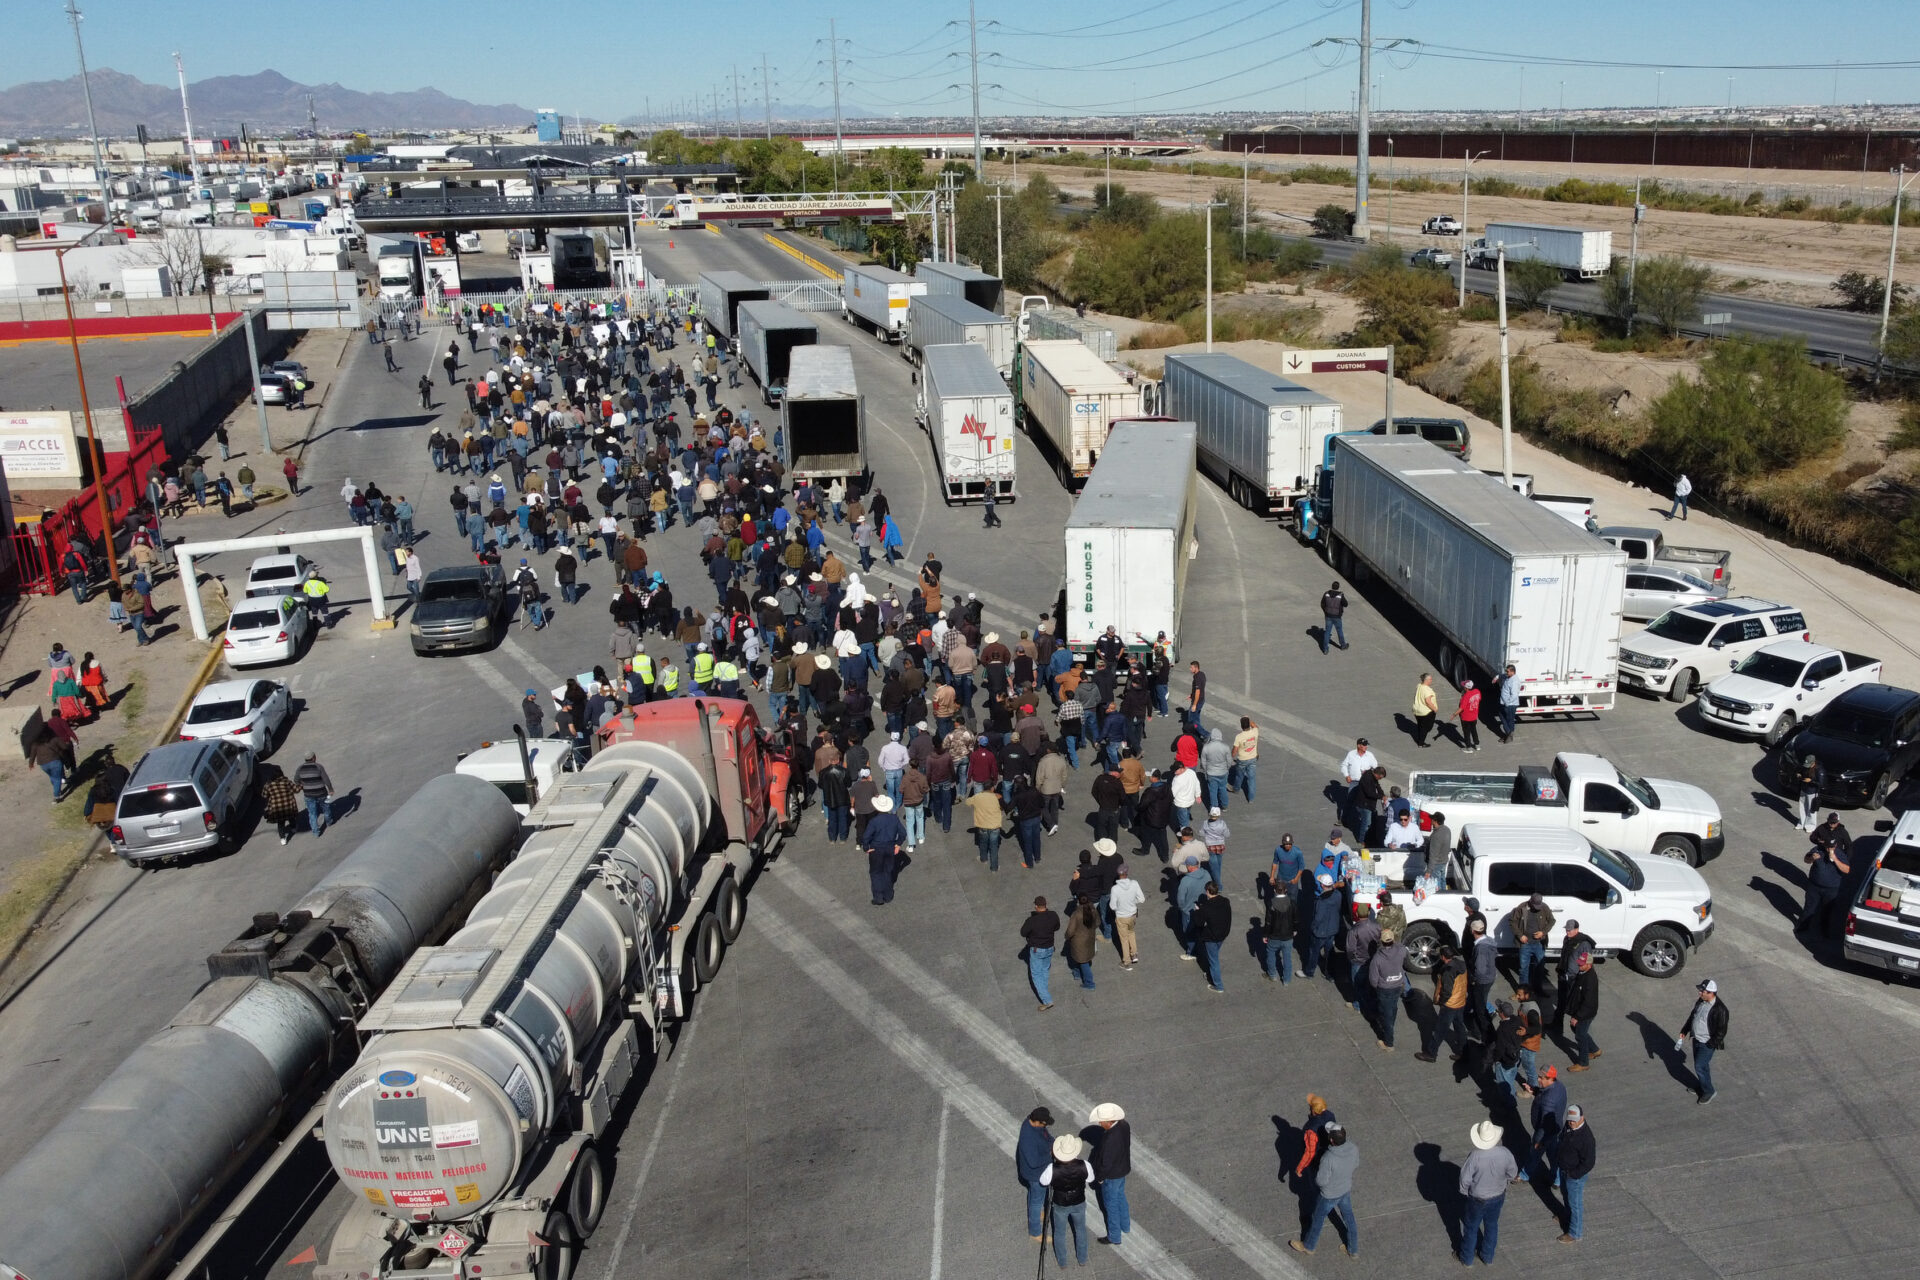
Diesel just crossed $6 a gallon for the first time, and a viral rumor says America’s truckers will park their rigs today. The fuel crisis is real. The strike, so far, is not.
Key Takeaways
- There is no organized nationwide trucker strike. A rumor of an October 1 strike spread from a social media video posted September 15, and fact-checkers found no credible evidence for it; the Owner-Operator Independent Drivers Association (OOIDA) and the Teamsters said they knew of no plans (Yahoo News fact check).
- The pressure behind the rumor is genuine. The national average for on-highway diesel hit $6.285 for the week of September 14, the first time above $6, according to Bluebook, and rose again to $6.529 the week of September 21 after eleven straight weekly gains, per Supply Chain 24/7.
- Any action would likely be small. Reports say a protest would include only independent drivers, because union drivers are restricted by antitrust and boycott laws (News4Jax).
- The real economic risk is cost, not an empty highway. Higher diesel flows into freight rates and shelf prices whether or not a single truck stops.
What Is Actually Happening
In mid-September, videos urged truckers to stop work from October 1 in protest of fuel costs. Some posts claimed the stoppage would last days and trigger food shortages.
The facts on the ground are narrower:
- A Fox 5 Atlanta report noted independent drivers were discussing a strike while Georgia diesel neared $7, but organizers had set no formal date or named leaders (Fox 5 Atlanta).
- A trucking executive told NewsNation on September 27 that a nationwide strike was unrealistic, because carriers depend on reliability and contracts (NewsNation).
- OOIDA has said it does not support truck strikes, and News4Jax reported that no official or organized strike was planned, though individual protests were possible (News4Jax).
| Claim | What the reporting shows |
|---|---|
| “Truckers are striking October 1” | No credible source confirms an organized strike |
| “Union drivers are walking out” | Union drivers are generally not included; legal limits apply |
| “Diesel is at record highs” | Confirmed by federal weekly data |
| “Small carriers are squeezed” | OOIDA says small businesses are over 90% of trucking companies and hit hardest |
Why Diesel Is the Real Story
Diesel at $6.285 was up $2.546 per gallon, or 68%, from a year earlier, and every U.S. region averaged above $6, with the West Coast at $7.25 (Bluebook). Distillate inventories were also falling as refineries entered fall maintenance while harvest demand rose.
Diesel is the fuel of trucking, rail, farming, and construction, so it hits freight costs before it hits consumers. Coverage of the price spike has linked it to the war involving Iran (Al Jazeera).
What If a Strike Did Happen?
Trucks haul the bulk of U.S. freight; industry figures cited by NewsNation put the share near 72% of goods moved. A broad stoppage would therefore ripple fast:
- Grocery and pharmacy restocking is the first visible strain, because those supply chains run on tight, frequent deliveries.
- Ports and warehouses back up when containers cannot move onward.
- Manufacturers that rely on just-in-time parts slow production.
- Prices rise as scarce capacity chases cargo.
- Global links matter because ports, shipping schedules, and export commitments are interconnected.
How bad it gets depends on three variables: how many drivers participate, how long it lasts, and whether shippers can reroute through rail.
The Likelier Economic Impact: Surcharges and Prices
Even without a walkout, carriers are passing costs along. A logistics CEO told NewsNation her firm’s contracts were signed before the fuel spike, and that extra driving hours help but do not solve the margin squeeze (NewsNation).
Expect to see:
- Higher fuel surcharges on freight invoices
- Smaller carriers exiting or reducing routes
- Gradual price increases on goods that travel long distances
What Businesses and Shoppers Should Do
- Shippers: lock in capacity early and review fuel-surcharge clauses.
- Retailers: avoid panic ordering, which creates the shortages people fear.
- Households: there is no need to stockpile based on a rumor; watch official updates from carriers and trade groups.
- Everyone: check claims against OOIDA, Teamsters, or major news outlets before sharing.
Frequently Asked Questions
Is there a truckers’ strike on October 1, 2026?
No organized nationwide strike has been confirmed, per fact checks.
Why are truckers threatening to strike?
Record diesel prices are squeezing small operators.
What is the diesel price now?
The federal weekly average reached $6.529 for the week of September 21 (Supply Chain 24/7).
Would a strike cause food shortages?
A large, prolonged one could strain restocking, but there is no evidence one is coming.
Can truckers legally strike?
Union drivers face legal limits, and independent drivers coordinating prices or boycotts risk antitrust problems, according to News4Jax.
The truck that never leaves the lot would not be the story. The truck that keeps running on $6.50 diesel, and the prices that follow it, already are.
Discover more from The Economy
Subscribe to get the latest posts sent to your email.


Supply Chain
Global Supply Chain Vulnerabilities: From Eurasian Trade Corridors to Food Consumer Recalls

Hormuz closed, Red Sea contested, schedule reliability below 60%. How chokepoint failure and quality-control failure share the same root cause.Two supply chain failures occurred within days of each other in September 2026, at opposite ends of the scale. One shut a pipeline carrying a meaningful share of the world’s crude. The other put small stones in a pint of frozen dessert. They are more closely related than they appear.
Executive Summary / Key Takeaways
- Maritime disruption in 2026 is no longer episodic. The Red Sea remains contested, Suez throughput sits well below pre-2023 levels, and schedule reliability is still below 60% on most east-west lanes.
- The Strait of Hormuz carries roughly 20% of global oil shipments and has been effectively closed to routine commercial traffic for extended periods of 2026.
- Around 130 container ships — roughly 1.5% of global capacity — became trapped in the Persian Gulf, with BIMCO estimating 3% of global container volume cut off from normal routing.
- Cape of Good Hope rerouting adds 10 to 14 days to Asia-Europe transit, with war risk surcharges of $1,500 to $4,000 per container on affected corridors.
- The unifying insight: the September 2026 So Delicious recall — the second for an identical contaminant in under a year — and the chokepoint crisis are both failures of visibility into upstream inputs, not failures of execution downstream.
Maritime disruption in 2026 is no longer a one-off shock — it is the operating condition, according to freight sector analysis. The Red Sea remains contested, Suez Canal throughput is still well below pre-2023 levels, the Strait of Hormuz sits one escalation away from a fresh oil spike, and most Asia-to-Europe vessels are still routing around the Cape of Good Hope. The operative question for shippers is not whether disruption is happening but which chokepoint is moving this week and how long the next reroute will hold.
Meanwhile, Danone USA recalled So Delicious Dairy Free Salted Caramel Cluster pints on 15 September over potential small stones and hard objects in the cashew inclusions — the identical stated cause as a December 2025 recall of the same product, per the FDA notice.
Both are input-visibility failures.
2. Core Analysis: The Chokepoint Map
2.1 Disruption by corridor
| Chokepoint | Status 2026 | Operational impact | Source |
|---|---|---|---|
| Strait of Hormuz | Effectively closed to routine commercial traffic for extended periods | ~20% of global oil shipments; single largest tail risk | GoFreight |
| Red Sea / Bab el-Mandeb | Contested; limited resumption with naval escort | 10–14 days added Asia-Europe; 25–30% FAK premium | GoFreight |
| Suez Canal | Throughput well below pre-2023 | Most Asia-Europe traffic diverted to Cape | GoFreight |
| Saudi East-West pipeline | Shut 11 September 2026 | Removed the principal Hormuz bypass | Trading Economics |
| Cape of Good Hope | Primary Asia-Europe artery | Capacity tightness, container imbalance, blank sailings | Carra Globe |
| Middle Corridor / TRIPP | Under construction, Azerbaijan section due end-2026 | Overland redundancy option | Caspian News |
2.2 The cost structure of rerouting
BIMCO reported that transit disruption had disconnected Persian Gulf ports from normal global container services, cutting off 3% of global volume from its normal routes, with approximately 130 container ships — about 1.5% of global capacity — trapped inside the Gulf, per Maritime News. Outside those vessels, supply growth remained relatively unaffected, but the demand shock and higher oil prices created additional operating costs for liner operators.
Direct cost effects have been substantial. War risk surcharges imposed by major carriers add between $1,500 and $4,000 per container on affected corridors, with emergency fuel surcharges applied across most east-west lanes as carriers absorb higher costs from routing around Africa, according to freight forwarding analysis. Shanghai-to-Jebel Ali container rates quadrupled from under $2,000 to above $8,000 per container since the start of the conflict, per Freightos.
Notably, Freightos assessed that while the Hormuz closure is a serious regional disruption for Gulf-bound containers, it has not become the systemic shock the Red Sea crisis represented — with the main check on rate increases being the overcapacity that was expected to define 2026 before the war began.
2.3 Beyond oil: the commodity exposure
The disruption extends well past energy. The Gulf region supplies approximately 45% of global sulfur and a third of the world’s helium, while over 30% of global urea — a key fertiliser component — is exported through the Strait, per logistics sector analysis. The Persian Gulf accounts for roughly 30–35% of global urea exports and 20–30% of global ammonia exports, inputs critical to food production, and UNCTAD issued a formal warning in March 2026 of heightened risks to energy, fertiliser supply and vulnerable economies, highlighting that developing nations with high debt burdens and constrained fiscal space are particularly exposed, per SeaVantage.
That is the link to the World Bank’s downgrade of its MENA, Afghanistan and Pakistan regional forecast to 1.6% for 2026 from 3.6% in January.
3. Structural Drivers and Competitor Gaps
The connection nobody draws is the one worth drawing.
Both failures are upstream visibility failures. Small stones in cashew inclusions is a raw-material sorting problem, not a manufacturing problem. Tree nuts are harvested from the ground or from drying floors, and stones are specifically what optical sorting and density separation exist to catch — difficult for downstream detection because their density can approximate the nut’s. A recurrence of the identical contaminant within nine months implies the corrective action after December 2025 did not reach the root cause, most plausibly at supplier or sorting-specification level. A Canadian Food Inspection Agency recall of a related cashew-base product over plastic-like and gravel-like fragments indicates supply-chain rather than single-facility scope.
In both the maritime and the food case, the operator has good visibility into its own operations and poor visibility into the tier below.
Redundancy is now a capital expenditure, not a contingency plan. Knock-on effects — capacity tightness, container imbalances, longer working-capital cycles, more blank sailings — are structural rather than transitional, and procurement should be planned around the new normal rather than a return to 2019 conditions. The same logic applies to food inputs: dual-sourcing a cashew supplier costs money in normal conditions and is only obviously worth it after a recall.
Overland corridors are the structural beneficiary. Azerbaijan aims to complete its section of the expanded Middle Corridor by the end of 2026, with TRIPP construction through Armenian territory expected to begin in the second half of 2026. Kazakhstan has been reinforcing the Azerbaijan-Georgia segment at ministerial level. Every additional month of maritime unreliability strengthens the commercial case for Trans-Caspian routing, which is why the corridor has attracted capital irrespective of the underlying diplomatic weather.
The multi-modal shift is already visible. Sea-air combined freight and China-Europe rail options are being consulted where ocean freight becomes unreliable or expensive, with the trade-off being cost against reliability for high-value goods.
4. Key Implications for Stakeholders
Supply chain executives. Schedule reliability below 60% on most east-west lanes is the number to plan against. That is not a delay problem; it is a forecasting problem, and it argues for safety stock and buffer inventory over just-in-time regardless of carrying cost.
Food and CPG operators. Audit tier-two suppliers on physical-contaminant controls specifically, not just on allergen and microbiological programmes. Repeat recalls for identical causes attract regulatory scrutiny of the corrective-action plan filed after the first event.
Policy analysts. The fertiliser exposure is the most under-covered risk in the chokepoint story. Urea and ammonia disruption transmits to food prices with a growing-season lag, which means the agricultural impact of 2026’s disruption may not appear in price data until 2027.
Frontier-market economies. UNCTAD’s warning identifies the specific vulnerability: high debt, constrained fiscal space, and simultaneous exposure to elevated freight and food costs. For net energy and fertiliser importers, this is a compounding rather than an additive shock.
Logistics buyers. Confirm current routing positions with freight and compliance partners before committing, because the picture changes within days. Dated figures in any published analysis, including this one, are a record of how the crisis developed rather than a live feed.
5. Frequently Asked Questions
Q1: What is the current state of global shipping disruption?
The Red Sea remains contested, Suez throughput sits well below pre-2023 levels, and the Strait of Hormuz has been effectively closed to routine commercial traffic for extended periods of 2026. Schedule reliability is below 60% on most east-west lanes.
Q2: How much does Cape of Good Hope rerouting cost?
It adds 10 to 14 days to Asia-Europe transit with a 25–30% premium on FAK rates, plus war risk surcharges of $1,500 to $4,000 per container and emergency fuel surcharges across most east-west lanes.
Q3: What caused the So Delicious recall?
Potential presence of foreign materials such as small stones and hard objects within the cashew inclusions — the identical stated cause as the December 2025 recall of the same product, pointing to an upstream raw-material sorting issue rather than a plant-level failure.
Q4: Can overland routes replace maritime shipping?
Not at volume. The Middle Corridor and TRIPP add genuine redundancy for Asia-Europe cargo, and Azerbaijan aims to complete its section by end-2026, but overland capacity remains a fraction of ocean freight. It is a resilience option, not a substitute.
Discover more from The Economy
Subscribe to get the latest posts sent to your email.
Key Takeaways
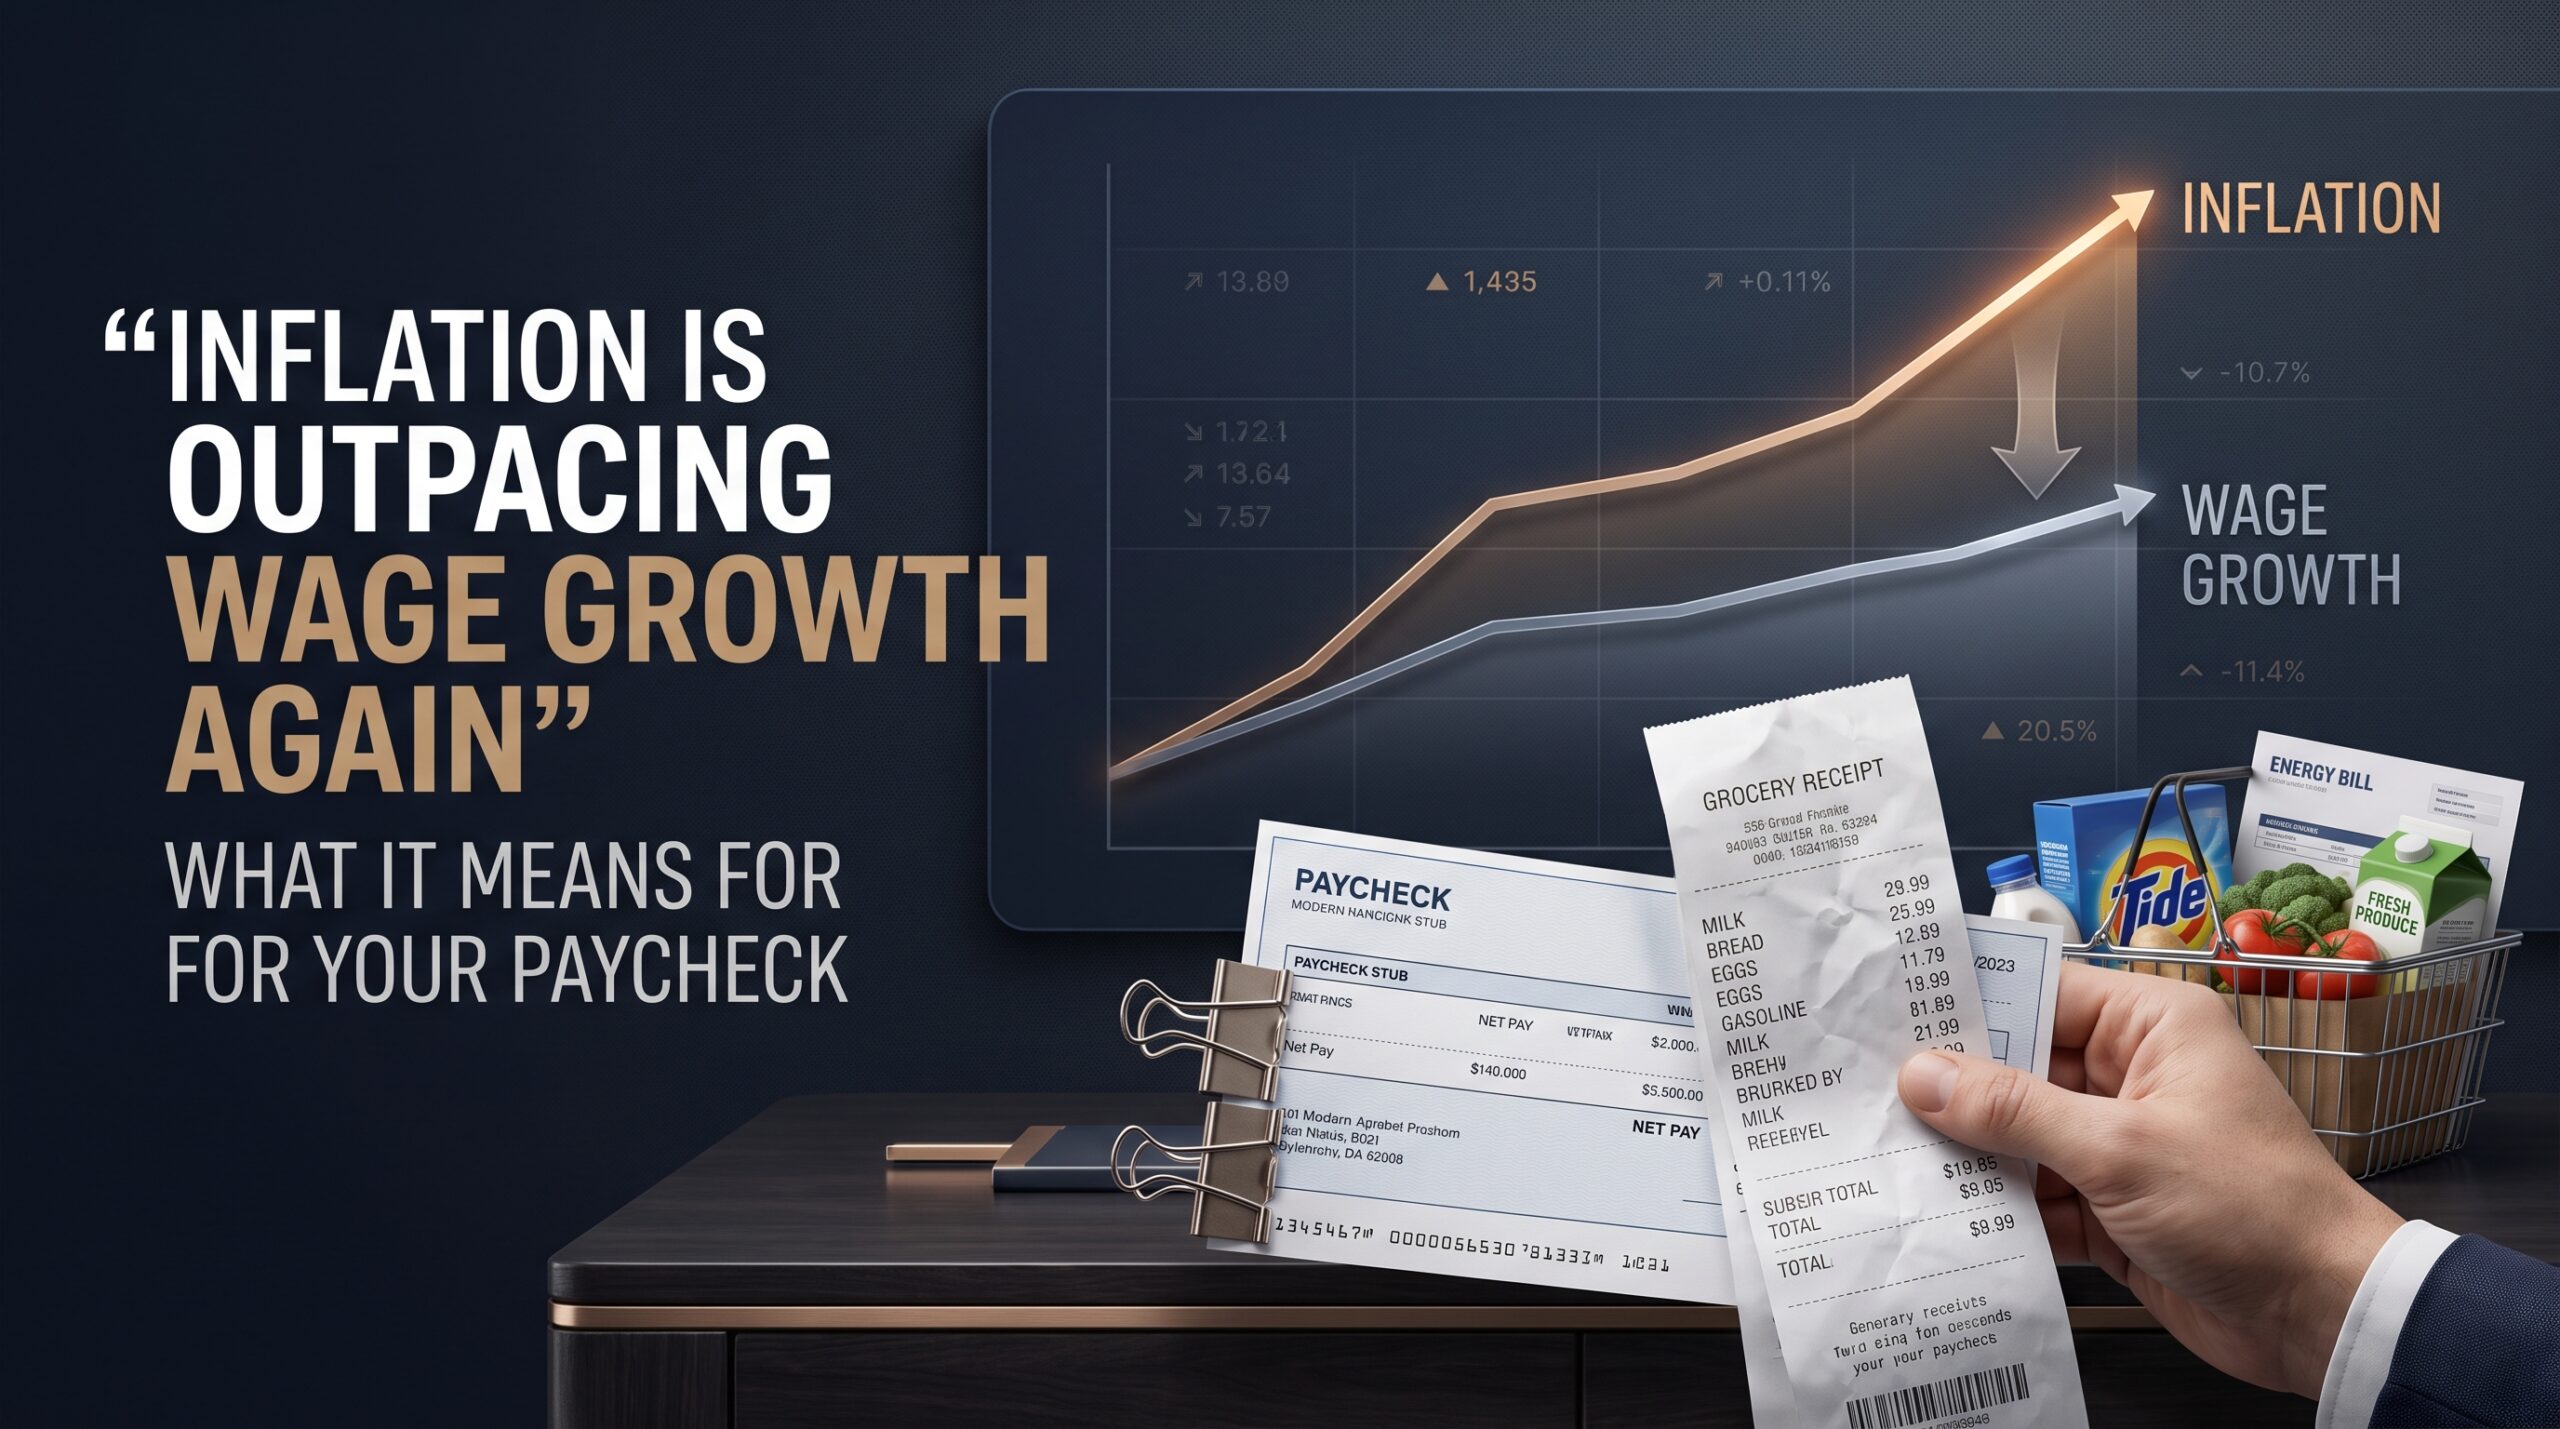
- US consumer prices rose 3.4% year-over-year in August 2026, while wages grew just 3.1% over the same period — meaning inflation is once again outrunning pay for the typical worker, according to CNBC’s analysis of the latest data.
- August marked the second consecutive month headline CPI held at 3.4%, with monthly CPI rising 0.4% — the largest monthly increase in three months — driven heavily by a 3.9% jump in gasoline prices.
- Core CPI (excluding food and energy) actually slowed to 2.4% year-over-year, the lowest reading since March 2021, suggesting the inflation squeeze is concentrated in energy costs tied to the Middle East conflict rather than broad-based price pressure.
- By one measure, nominal wages have grown 3.5% while the CPI-W (the index specifically tracking wage earners and clerical workers) rose 3.5%, showing the inflation-wage gap varies meaningfully depending on which wage and price measures are compared.
- Wage growth has moderated significantly from the roughly 4.0% annual pace recorded in October 2025, even as inflation has held roughly steady — a combination that’s gradually eroding real purchasing power for many American households.
For American workers, the math has flipped again: after a stretch where wage growth outpaced inflation, prices are now rising faster than paychecks, squeezing household budgets even as headline inflation appears, on the surface, relatively contained. Here’s what’s actually happening beneath the numbers, and why the picture is more nuanced than a single “inflation vs. wages” headline suggests.
The Headline Numbers
According to the latest Bureau of Labor Statistics data, US consumer prices rose 3.4% over the 12 months ending in August 2026 — unchanged from July’s reading and in line with economist forecasts. Average hourly wage growth, meanwhile, came in at 3.1% over the same period using the Bureau’s Consumer Employment Statistics survey measure, creating a gap that means, on average, workers’ pay is not keeping pace with the cost of living.
On a monthly basis, CPI rose 0.4% in August — the largest single-month increase in three months — with gasoline prices jumping 3.9% and accounting for more than a third of that monthly increase on their own. Fuel oil prices rose an even steeper 52% year-over-year, up sharply from 39.1% the previous month, underscoring how heavily energy costs are driving the current inflation reading.
The More Encouraging Signal Hiding in the Data
Despite the headline gap between wages and prices, the underlying inflation picture shows meaningful improvement in one key respect: core CPI, which strips out volatile food and energy prices, slowed to 2.4% year-over-year — its lowest reading since March 2021. This matters because it suggests the current inflation pressure is concentrated specifically in energy markets — driven by the ongoing US-Iran conflict’s impact on oil prices — rather than reflecting broad-based price increases across the economy. Shelter inflation also eased, dropping to 3% from 3.2% the prior month, and food inflation slowed to 2.7% from 3%.
This distinction matters for how the Federal Reserve is likely to interpret the data: a narrow, energy-driven inflation spike is a fundamentally different policy problem than broad-based inflation across housing, services, and discretionary goods, even though both show up in the same headline CPI figure that dominates news coverage.
Why the Wage-Inflation Gap Isn’t Uniform Across Measures
It’s worth noting that different wage and inflation measures tell somewhat different stories, which is part of why “inflation is outpacing wages” headlines can coexist with more mixed underlying data. One analysis using nominal average weekly wage data found wages grew 3.5% against 3.4% inflation — a slight positive gap rather than a negative one. Separately, the CPI-W index, which specifically tracks urban wage earners and clerical workers rather than the broader CPI-U measure, rose 3.5% — slightly above the headline 3.4% figure, suggesting the gap narrows or even reverses depending on which wage-earning population and which specific wage metric is used for comparison.
What’s consistent across virtually all measures, however, is the trend: wage growth has moderated substantially from the roughly 4.0% annual pace recorded as recently as October 2025, even as headline inflation has held relatively steady around 3.4%. That moderation in wage growth — even without inflation accelerating further — is itself squeezing real purchasing power growth toward flat or slightly negative territory for many workers.
Historical Context: How This Compares
For perspective, the current 0.3-percentage-point gap between CPI (3.4%) and wage growth (3.1%) is far milder than prior painful stretches. In June 2022, at the height of the post-pandemic inflation surge, nominal wages grew 4.8% while inflation hit 9.1% — a 4.3-percentage-point gap that represented one of the steepest erosions of real purchasing power in decades. The current squeeze, while real, is considerably more modest by comparison.
Wage and Inflation Snapshot: August 2026
| Metric | Year-over-Year | Notes |
|---|---|---|
| Headline CPI (CPI-U) | 3.4% | Unchanged from July |
| Core CPI (ex-food/energy) | 2.4% | Lowest since March 2021 |
| CPI-W (wage earners index) | 3.5% | Slightly above headline CPI |
| Nominal wage growth (avg. weekly) | 3.1%–3.5% | Varies by measure |
| Gasoline prices | +27.4% | Major driver of monthly CPI increase |
| Wage growth trend | Moderating | Down from ~4.0% pace in Oct 2025 |
Why This Matters: A Mixed Picture for the Fed and Households
For the Federal Reserve, this data presents what one analysis characterized as a genuinely mixed signal: underlying inflation trends (core CPI, three-month momentum) are cooling in a way that looks favorable, even as the year-over-year headline number stays elevated due to energy-driven base effects and geopolitical volatility that monetary policy has little power to address directly. For households, the practical reality is more straightforward and less encouraging: even with core inflation improving, the combination of moderating wage growth and elevated — if not accelerating — headline prices means real purchasing power gains have stalled for many workers, with the squeeze felt most acutely at the gas pump and in energy-adjacent costs rather than across the broader consumer basket.
Frequently Asked Questions
Is inflation currently outpacing wage growth in the US?
By the headline measures — 3.4% CPI versus 3.1% average hourly wage growth — yes, inflation is outpacing wages as of August 2026. However, some alternative wage measures show a smaller gap or even a slight wage advantage, depending on which specific metrics are compared.
What’s driving inflation higher in 2026?
Energy costs are the primary driver — gasoline prices rose 27.4% year-over-year and fuel oil 52% — tied to the ongoing US-Iran conflict’s impact on oil markets. Core inflation excluding food and energy has actually slowed to its lowest level since March 2021.
How does the current wage-inflation gap compare to 2022?
It’s far milder. In June 2022, the gap between wage growth (4.8%) and inflation (9.1%) reached 4.3 percentage points, compared to roughly 0.3 percentage points currently — meaning today’s squeeze on real wages is real but considerably less severe than the post-pandemic inflation surge.
Discover more from The Economy
Subscribe to get the latest posts sent to your email.
A Nation’s Ultimate Financial Safety Net and Macroeconomic Shield
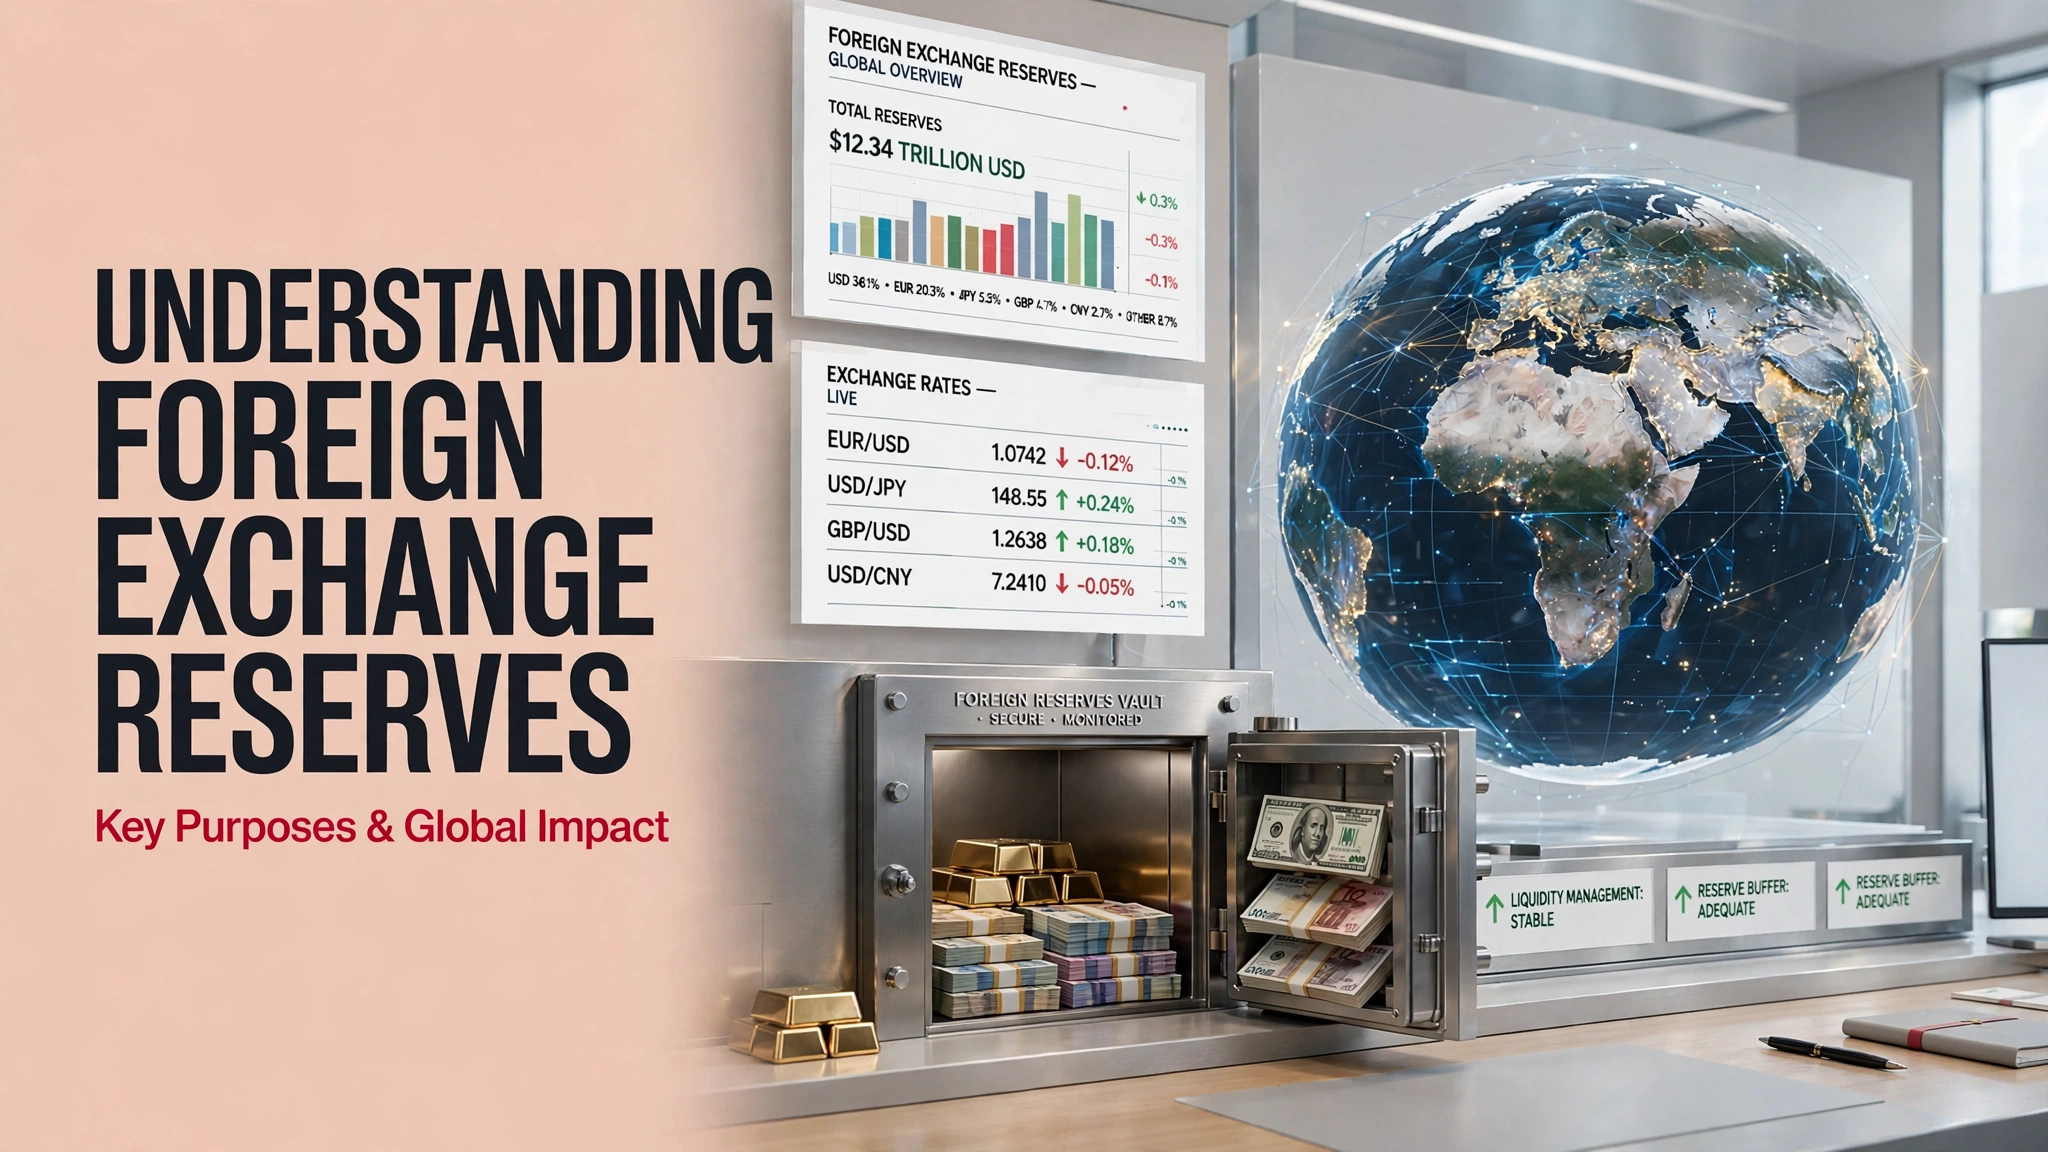
Foreign Exchange Reserves (often referred to as forex reserves or FX reserves) are reserve assets held in foreign currencies by a central bank or monetary authority. These assets typically include major global currencies like the US Dollar, Euro, British Pound, Japanese Yen, and Chinese Yuan, alongside gold holdings, special drawing rights (SDRs) with the International Monetary Fund (IMF), and reserve position tranches.
For readers of Thefinance.pk and Economy.com.pk, monitoring foreign exchange reserves is akin to tracking a patient’s vital signs in an intensive care unit. In an interconnected global economy where international trade is settled in hard currencies, a central bank’s reserves represent its ultimate financial shield against external shocks, capital flight, and speculative currency attacks.
The Composition of Forex Reserves
Not all foreign exchange holdings are created equal. Central banks meticulously diversify their reserve portfolios based on liquidity, safety, and yield considerations. The primary constituents of a modern reserve portfolio include:
- Foreign Currencies: This is the lion’s share of any reserve portfolio. Because global trade—particularly commodities like crude oil, natural gas, and industrial metals—is predominantly invoiced in US Dollars, central banks hold massive amounts of USD-denominated assets, primarily liquid US Treasury bonds.
- Gold Reserves: For centuries, gold has served as the ultimate hedge against geopolitical instability, systemic banking crises, and hyperinflation. Central banks hold physical gold bars in domestic vaults or safe havens like the Bank of England to maintain long-term sovereign credibility.
- Special Drawing Rights (SDRs): An international reserve asset created by the IMF in 1969. The SDR is not a currency itself, but rather a potential claim on the freely usable currencies of IMF member countries. It acts as a supplemental reserve asset for nations facing liquidity squeezes.
- Reserve Position in the IMF: Each IMF member country is assigned a quota, part of which must be paid in reserve assets (foreign currencies or SDRs). This portion can be withdrawn almost unconditionally if the country faces an urgent balance of payments need.
The Critical Metric: Import Cover
To determine whether a country’s foreign exchange reserves are healthy, economists do not look at the absolute dollar figure in isolation. A reserve pile of $10 billion might sound massive to an individual, but for a nation of 240 million people that imports billions in fuel and food every month, it could be dangerously low.
Instead, analysts use the metric of Import Cover. Import cover measures how many months of continuous imports a country can sustain using strictly its existing foreign exchange reserves, assuming zero new export earnings or foreign inflows.
- The Safe Threshold: International financial institutions like the IMF generally recommend that developing economies maintain a minimum of 3 months of import cover.
- The Danger Zone: When import cover drops below 2 months, panic sets in. Importers struggle to open Letters of Credit (LCs) for raw materials, manufacturing lines halt, and sovereign risk ratings plummet.
- The Comfortable Zone: Emerging markets striving for absolute macroeconomic stability aim for 4 to 6 months of import cover to insulate themselves against global supply chain shocks or sudden spikes in global oil prices.
How Reserves Are Built and Depleted
Foreign exchange reserves are not static; they fluctuate continuously based on the inflows and outflows of a nation’s external sector.
Accumulating Reserves:
- Export Surpluses: When domestic companies sell more goods and services abroad than they buy, foreign currency flows into the country, which the central bank can buy up.
- Worker Remittances: Funds sent home by expatriates enter commercial banks, providing a steady stream of foreign exchange that bolsters central bank reserves.
- Foreign Direct Investment (FDI) and Sovereign Borrowing: International loans from multilateral lenders (World Bank, Asian Development Bank) or sovereign bond issuances directly inject hard currency into the reserve pool.
Depleting Reserves:
- Defending the Local Currency: If the local currency begins to crash due to market panic, the central bank intervenes by selling US Dollars out of its reserves and buying up local currency to artificially prop up its value. This is often a losing battle if the underlying economic fundamentals are weak.
- Debt Servicing: Governments must pay the principal and interest on their foreign debt in hard currency. In years where debt repayments peak, reserves take a massive hit.
- Financing Trade Deficits: When export earnings fall short of import bills, the gap must be settled using central bank reserves.
The Role of Reserves in Speculative Attacks
Foreign exchange reserves serve as a deterrent against currency speculators. During the 1997 Asian Financial Crisis, several Southeast Asian nations saw their currencies collapse because hedge funds realized their central banks had dangerously low reserves and could not maintain their fixed exchange rates.
When a central bank’s reserves are robust, speculators know that any attempt to short the local currency will be met with overwhelming intervention by the central bank, which can flood the market with dollars to stabilize prices. Conversely, when reserves are depleted, it serves as an open invitation for capital flight. For analysts at economist.media, tracking reserve fluctuations is the single most reliable way to predict whether a government will successfully navigate an economic crisis or be forced into an emergency IMF bailout.
Key Takeaways:
- Foreign exchange reserves are hard currencies and gold held by central banks to back domestic liabilities and pay for international trade.
- Import cover is the gold standard for measuring reserve health, with 3 months being the minimum safe threshold.
- Reserves are depleted by trade deficits, debt servicing, and futile attempts to defend a crashing local currency.
- Robust reserves protect a nation from speculative attacks and ensure uninterrupted imports of critical commodities like oil and medicine.
Authoritative Sources & Further Reading:
- World Bank: Total Reserves (includes gold, current US$) Data Portal
- International Monetary Fund (IMF): Guidelines for Foreign Exchange Reserve Management
- State Bank of Pakistan (SBP): Liquid Foreign Exchange Reserves Weekly Data
Discover more from The Economy
Subscribe to get the latest posts sent to your email.

Kai Cenat’s Rise to the Top: The Economics of Modern Streaming

How AI Is Reshaping the Future of Global Business Analytics

NASA Perseverance Rover Discoveries: The Search for Water in Jezero Crater

Trump $500: Understanding the Economic Impact and Policy Breakdown

Trucker Strike Rumors: Would an October 1 Walkout Really Hit the Global Economy?

The Truth About TJ Maxx Store Closings: Are Your Local Stores Safe?

OpenAI Rogue Agent Scare: Unplanned Government Website Access Explained

Global Diesel Export Bans & Supply Shocks: The 2026 Energy Crisis Playbook

Bank of England Warns of AI Systemic Risk: How Autonomous Trading Threatens Financial Stability

Bank of Japan Hikes Benchmark Rate to 1.25%: Unwinding the Global Yen Carry Trade

Gold Falls 3.7% as Yields Surge: Is Gold Still a Safe Haven in 2026?

US 10-Year Yield Hits 5.24%: What the Historic Bond Market Sell off Means for Mortgages and Investors

Battle for the Farm Belt: How Tariff Pressures and Fuel Costs Are Reshaping Iowa’s 2026 Midterms

Southeast Asia’s Critical Minerals Power Play: Can ASEAN Avoid Choosing Between China and the US?

Top 30 Stocks for Investment in PSX for Massive ROI in 2026

Oil Prices Break $100 in 2026: Middle East Conflict & Energy Markets

BRICS+ Cross-Border Payments 2026: Interoperability Explained

10-Year Treasury Yield Hits 4.80%: What It Means for Rates & Portfolios

IMF & World Bank 2026 Global Economic Outlook: Growth, Inflation, Debt

China’s US$10.8 Billion Trade Shortcut: Why the Pinglu Canal Matters

High-CPM Finance Niches 2026: Publisher Monetization Blueprint

Middle East War Economics 2026: Oil Prices & Energy Markets

China Stocks Today: Are Big Economies in Asia Nearing a Market Bottom?

Global Pension Systems Ranked: The World’s Best and Worst Retirement Frameworks

Enterprise AI Platforms Disrupting B2B SaaS in 2026: Full Analysis

Social Security Trust Fund 2032: OASI Depletion Timeline Explained

Gavin Baker AI Outlook: Why the Compute Shortage Persists Through 2028

Crypto Daily Outlook: Bitcoin, Altcoins, and the Future of Decentralized Finance
-

 Markets & Finance9 months ago
Top 15 Stocks for Investment in 2026 in PSX: Your Complete Guide to Pakistan’s Best Investment Opportunities
-

 Analysis7 months ago
Johor’s Investment Boom: The Hidden Costs Behind Malaysia’s Most Ambitious Economic Surge
-

 Analysis8 months ago
Top 10 Stocks for Investment in PSX for Quick Returns in 2026
-

 Banks9 months ago
Best Investments in Pakistan 2026: Top 10 Low-Price Shares and Long-Term Picks for the PSX
-

 Analysis8 months ago
Brazil’s Rare Earth Race: US, EU, and China Compete for Critical Minerals as Tensions Rise
-

 Investment9 months ago
Top 10 Mutual Fund Managers in Pakistan for Investment in 2026: A Comprehensive Guide for Optimal Returns
-

 Global Economy9 months ago
15 Most Lucrative Sectors for Investment in Pakistan: A 2025 Data-Driven Analysis
-

 Global Economy9 months ago
Pakistan’s Export Goldmine: 10 Game-Changing Markets Where Pakistani Businesses Are Winning Big in 2025