
Inflation
Inflation Is Outpacing Wage Growth Again: What It Means for Your Paycheck

Key Takeaways
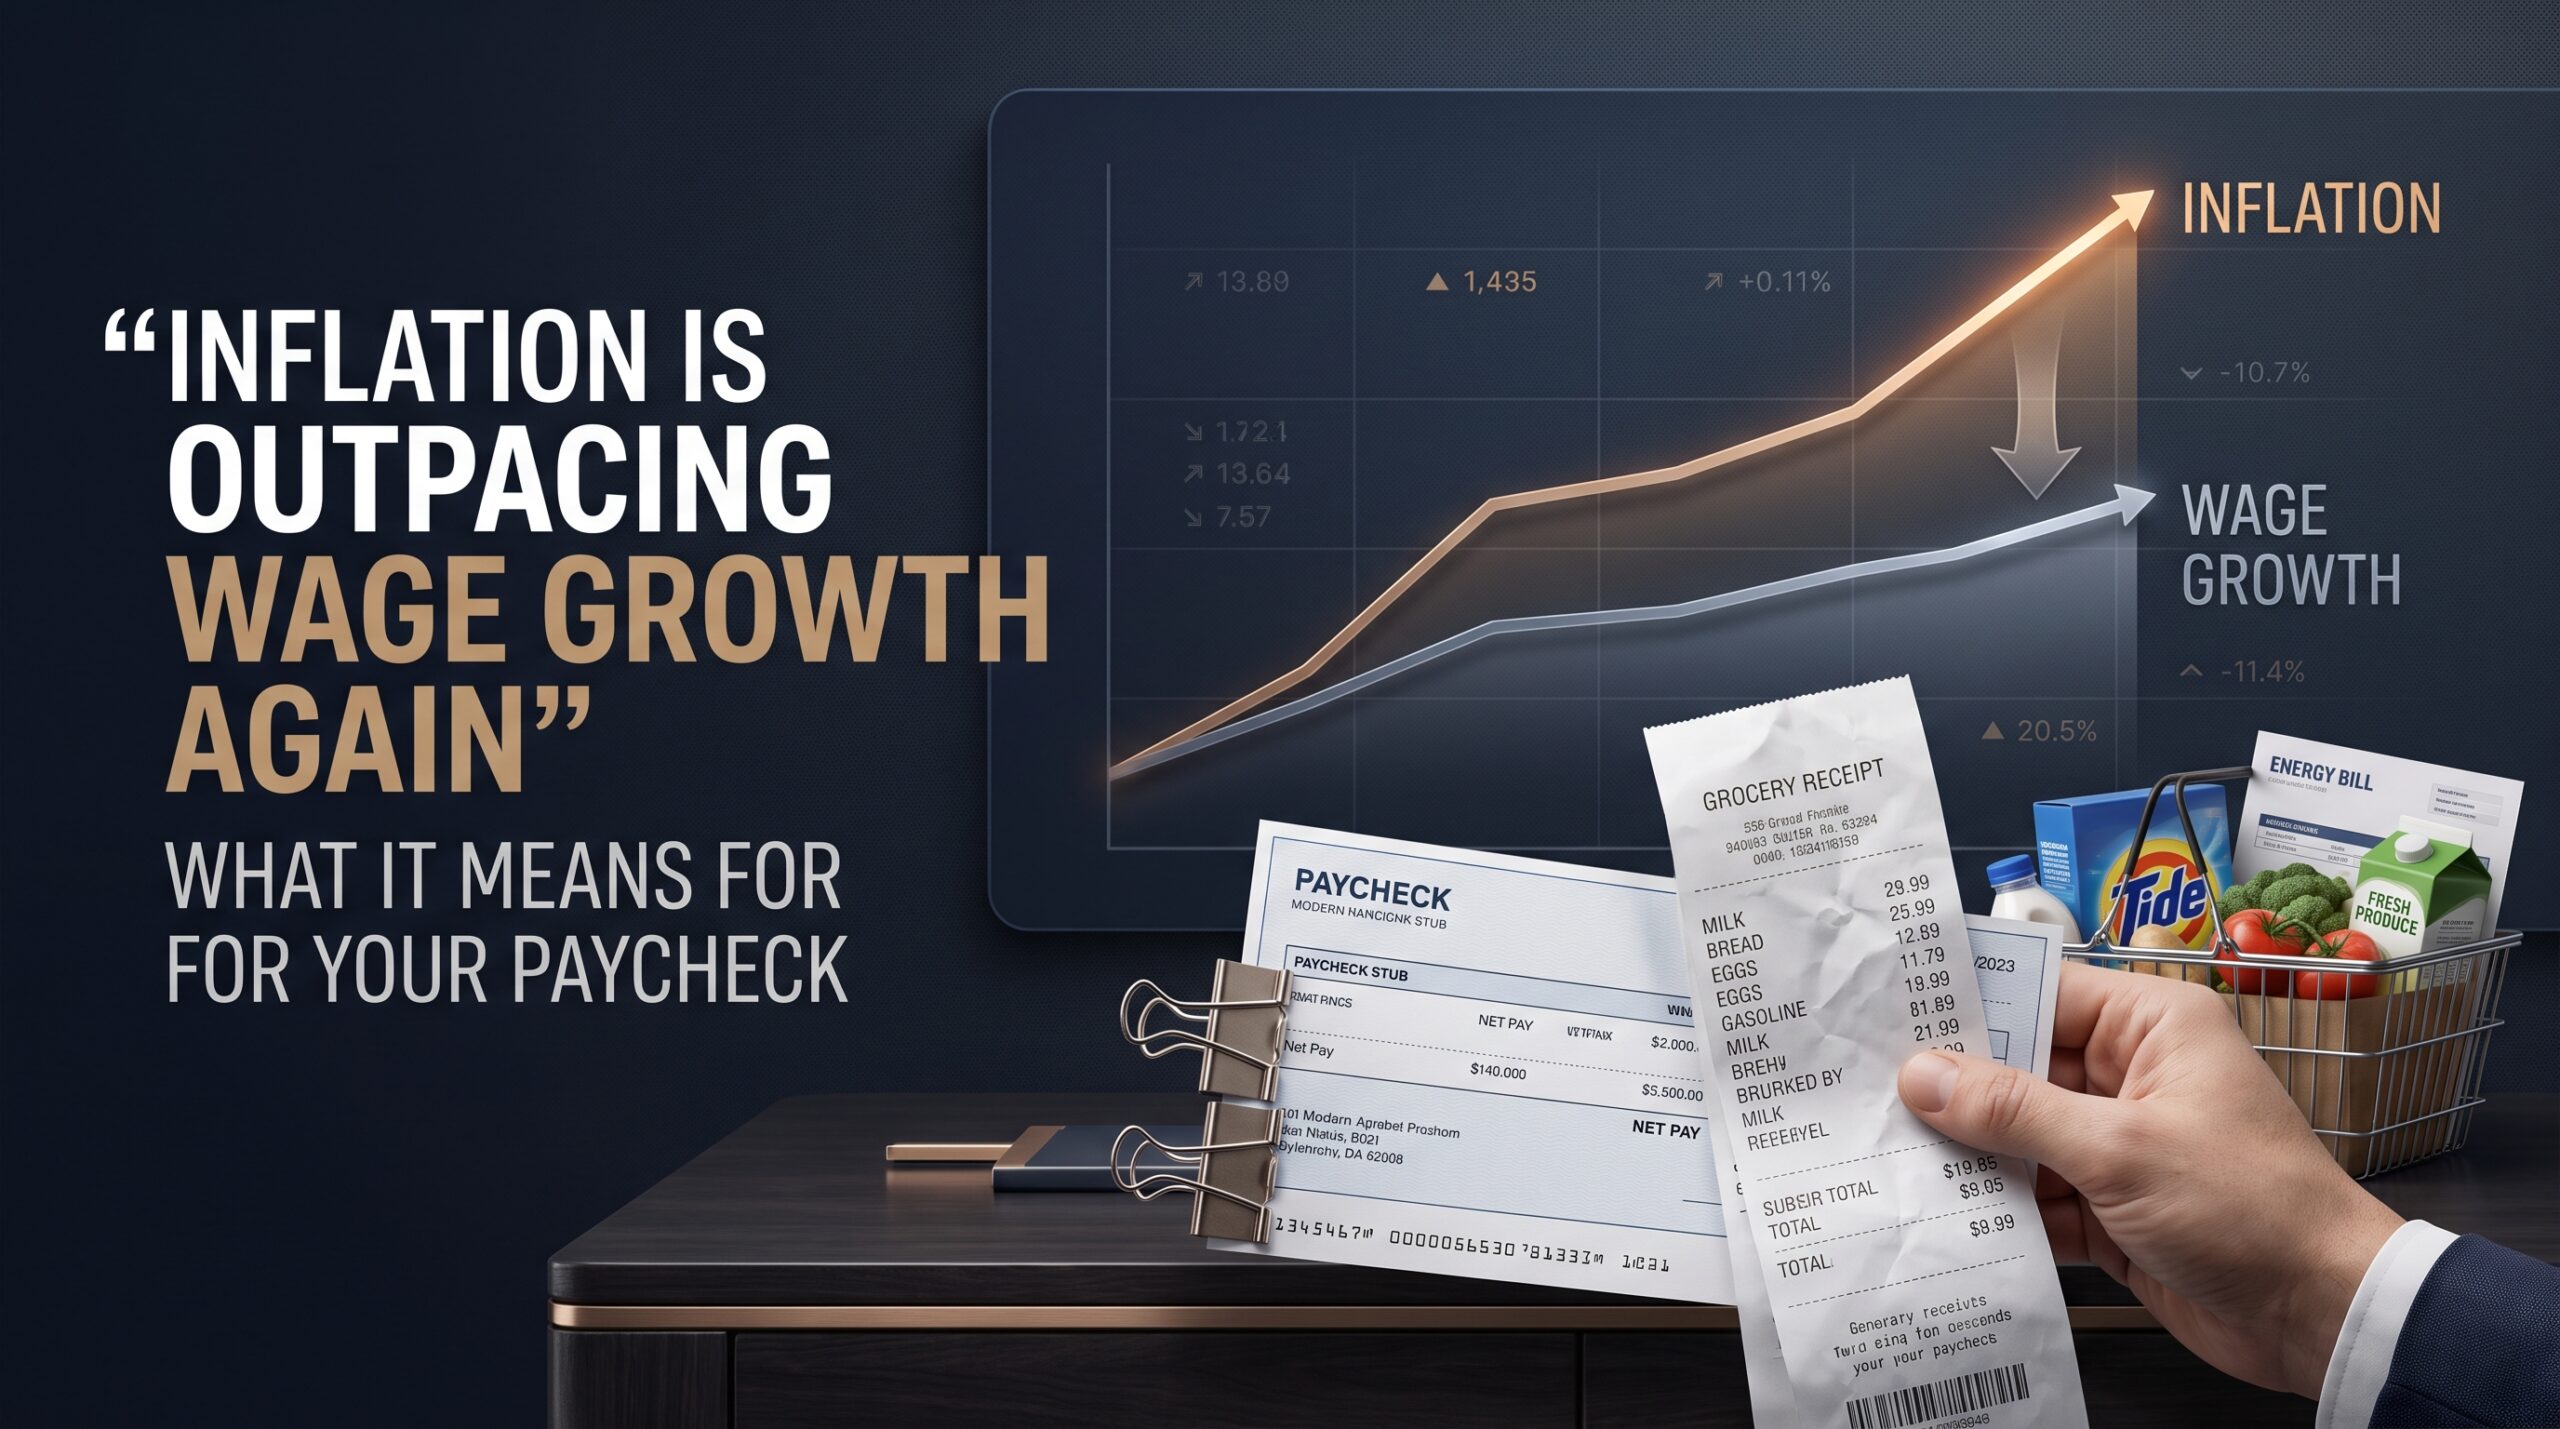
- US consumer prices rose 3.4% year-over-year in August 2026, while wages grew just 3.1% over the same period — meaning inflation is once again outrunning pay for the typical worker, according to CNBC’s analysis of the latest data.
- August marked the second consecutive month headline CPI held at 3.4%, with monthly CPI rising 0.4% — the largest monthly increase in three months — driven heavily by a 3.9% jump in gasoline prices.
- Core CPI (excluding food and energy) actually slowed to 2.4% year-over-year, the lowest reading since March 2021, suggesting the inflation squeeze is concentrated in energy costs tied to the Middle East conflict rather than broad-based price pressure.
- By one measure, nominal wages have grown 3.5% while the CPI-W (the index specifically tracking wage earners and clerical workers) rose 3.5%, showing the inflation-wage gap varies meaningfully depending on which wage and price measures are compared.
- Wage growth has moderated significantly from the roughly 4.0% annual pace recorded in October 2025, even as inflation has held roughly steady — a combination that’s gradually eroding real purchasing power for many American households.
For American workers, the math has flipped again: after a stretch where wage growth outpaced inflation, prices are now rising faster than paychecks, squeezing household budgets even as headline inflation appears, on the surface, relatively contained. Here’s what’s actually happening beneath the numbers, and why the picture is more nuanced than a single “inflation vs. wages” headline suggests.
The Headline Numbers
According to the latest Bureau of Labor Statistics data, US consumer prices rose 3.4% over the 12 months ending in August 2026 — unchanged from July’s reading and in line with economist forecasts. Average hourly wage growth, meanwhile, came in at 3.1% over the same period using the Bureau’s Consumer Employment Statistics survey measure, creating a gap that means, on average, workers’ pay is not keeping pace with the cost of living.
On a monthly basis, CPI rose 0.4% in August — the largest single-month increase in three months — with gasoline prices jumping 3.9% and accounting for more than a third of that monthly increase on their own. Fuel oil prices rose an even steeper 52% year-over-year, up sharply from 39.1% the previous month, underscoring how heavily energy costs are driving the current inflation reading.
The More Encouraging Signal Hiding in the Data
Despite the headline gap between wages and prices, the underlying inflation picture shows meaningful improvement in one key respect: core CPI, which strips out volatile food and energy prices, slowed to 2.4% year-over-year — its lowest reading since March 2021. This matters because it suggests the current inflation pressure is concentrated specifically in energy markets — driven by the ongoing US-Iran conflict’s impact on oil prices — rather than reflecting broad-based price increases across the economy. Shelter inflation also eased, dropping to 3% from 3.2% the prior month, and food inflation slowed to 2.7% from 3%.
This distinction matters for how the Federal Reserve is likely to interpret the data: a narrow, energy-driven inflation spike is a fundamentally different policy problem than broad-based inflation across housing, services, and discretionary goods, even though both show up in the same headline CPI figure that dominates news coverage.
Why the Wage-Inflation Gap Isn’t Uniform Across Measures
It’s worth noting that different wage and inflation measures tell somewhat different stories, which is part of why “inflation is outpacing wages” headlines can coexist with more mixed underlying data. One analysis using nominal average weekly wage data found wages grew 3.5% against 3.4% inflation — a slight positive gap rather than a negative one. Separately, the CPI-W index, which specifically tracks urban wage earners and clerical workers rather than the broader CPI-U measure, rose 3.5% — slightly above the headline 3.4% figure, suggesting the gap narrows or even reverses depending on which wage-earning population and which specific wage metric is used for comparison.
What’s consistent across virtually all measures, however, is the trend: wage growth has moderated substantially from the roughly 4.0% annual pace recorded as recently as October 2025, even as headline inflation has held relatively steady around 3.4%. That moderation in wage growth — even without inflation accelerating further — is itself squeezing real purchasing power growth toward flat or slightly negative territory for many workers.
Historical Context: How This Compares
For perspective, the current 0.3-percentage-point gap between CPI (3.4%) and wage growth (3.1%) is far milder than prior painful stretches. In June 2022, at the height of the post-pandemic inflation surge, nominal wages grew 4.8% while inflation hit 9.1% — a 4.3-percentage-point gap that represented one of the steepest erosions of real purchasing power in decades. The current squeeze, while real, is considerably more modest by comparison.
Wage and Inflation Snapshot: August 2026
| Metric | Year-over-Year | Notes |
|---|---|---|
| Headline CPI (CPI-U) | 3.4% | Unchanged from July |
| Core CPI (ex-food/energy) | 2.4% | Lowest since March 2021 |
| CPI-W (wage earners index) | 3.5% | Slightly above headline CPI |
| Nominal wage growth (avg. weekly) | 3.1%–3.5% | Varies by measure |
| Gasoline prices | +27.4% | Major driver of monthly CPI increase |
| Wage growth trend | Moderating | Down from ~4.0% pace in Oct 2025 |
Why This Matters: A Mixed Picture for the Fed and Households
For the Federal Reserve, this data presents what one analysis characterized as a genuinely mixed signal: underlying inflation trends (core CPI, three-month momentum) are cooling in a way that looks favorable, even as the year-over-year headline number stays elevated due to energy-driven base effects and geopolitical volatility that monetary policy has little power to address directly. For households, the practical reality is more straightforward and less encouraging: even with core inflation improving, the combination of moderating wage growth and elevated — if not accelerating — headline prices means real purchasing power gains have stalled for many workers, with the squeeze felt most acutely at the gas pump and in energy-adjacent costs rather than across the broader consumer basket.
Frequently Asked Questions
Is inflation currently outpacing wage growth in the US?
By the headline measures — 3.4% CPI versus 3.1% average hourly wage growth — yes, inflation is outpacing wages as of August 2026. However, some alternative wage measures show a smaller gap or even a slight wage advantage, depending on which specific metrics are compared.
What’s driving inflation higher in 2026?
Energy costs are the primary driver — gasoline prices rose 27.4% year-over-year and fuel oil 52% — tied to the ongoing US-Iran conflict’s impact on oil markets. Core inflation excluding food and energy has actually slowed to its lowest level since March 2021.
How does the current wage-inflation gap compare to 2022?
It’s far milder. In June 2022, the gap between wage growth (4.8%) and inflation (9.1%) reached 4.3 percentage points, compared to roughly 0.3 percentage points currently — meaning today’s squeeze on real wages is real but considerably less severe than the post-pandemic inflation surge.
Discover more from The Economy
Subscribe to get the latest posts sent to your email.


Understanding the Cost of Living, Price Hikes, and Macroeconomic Stability
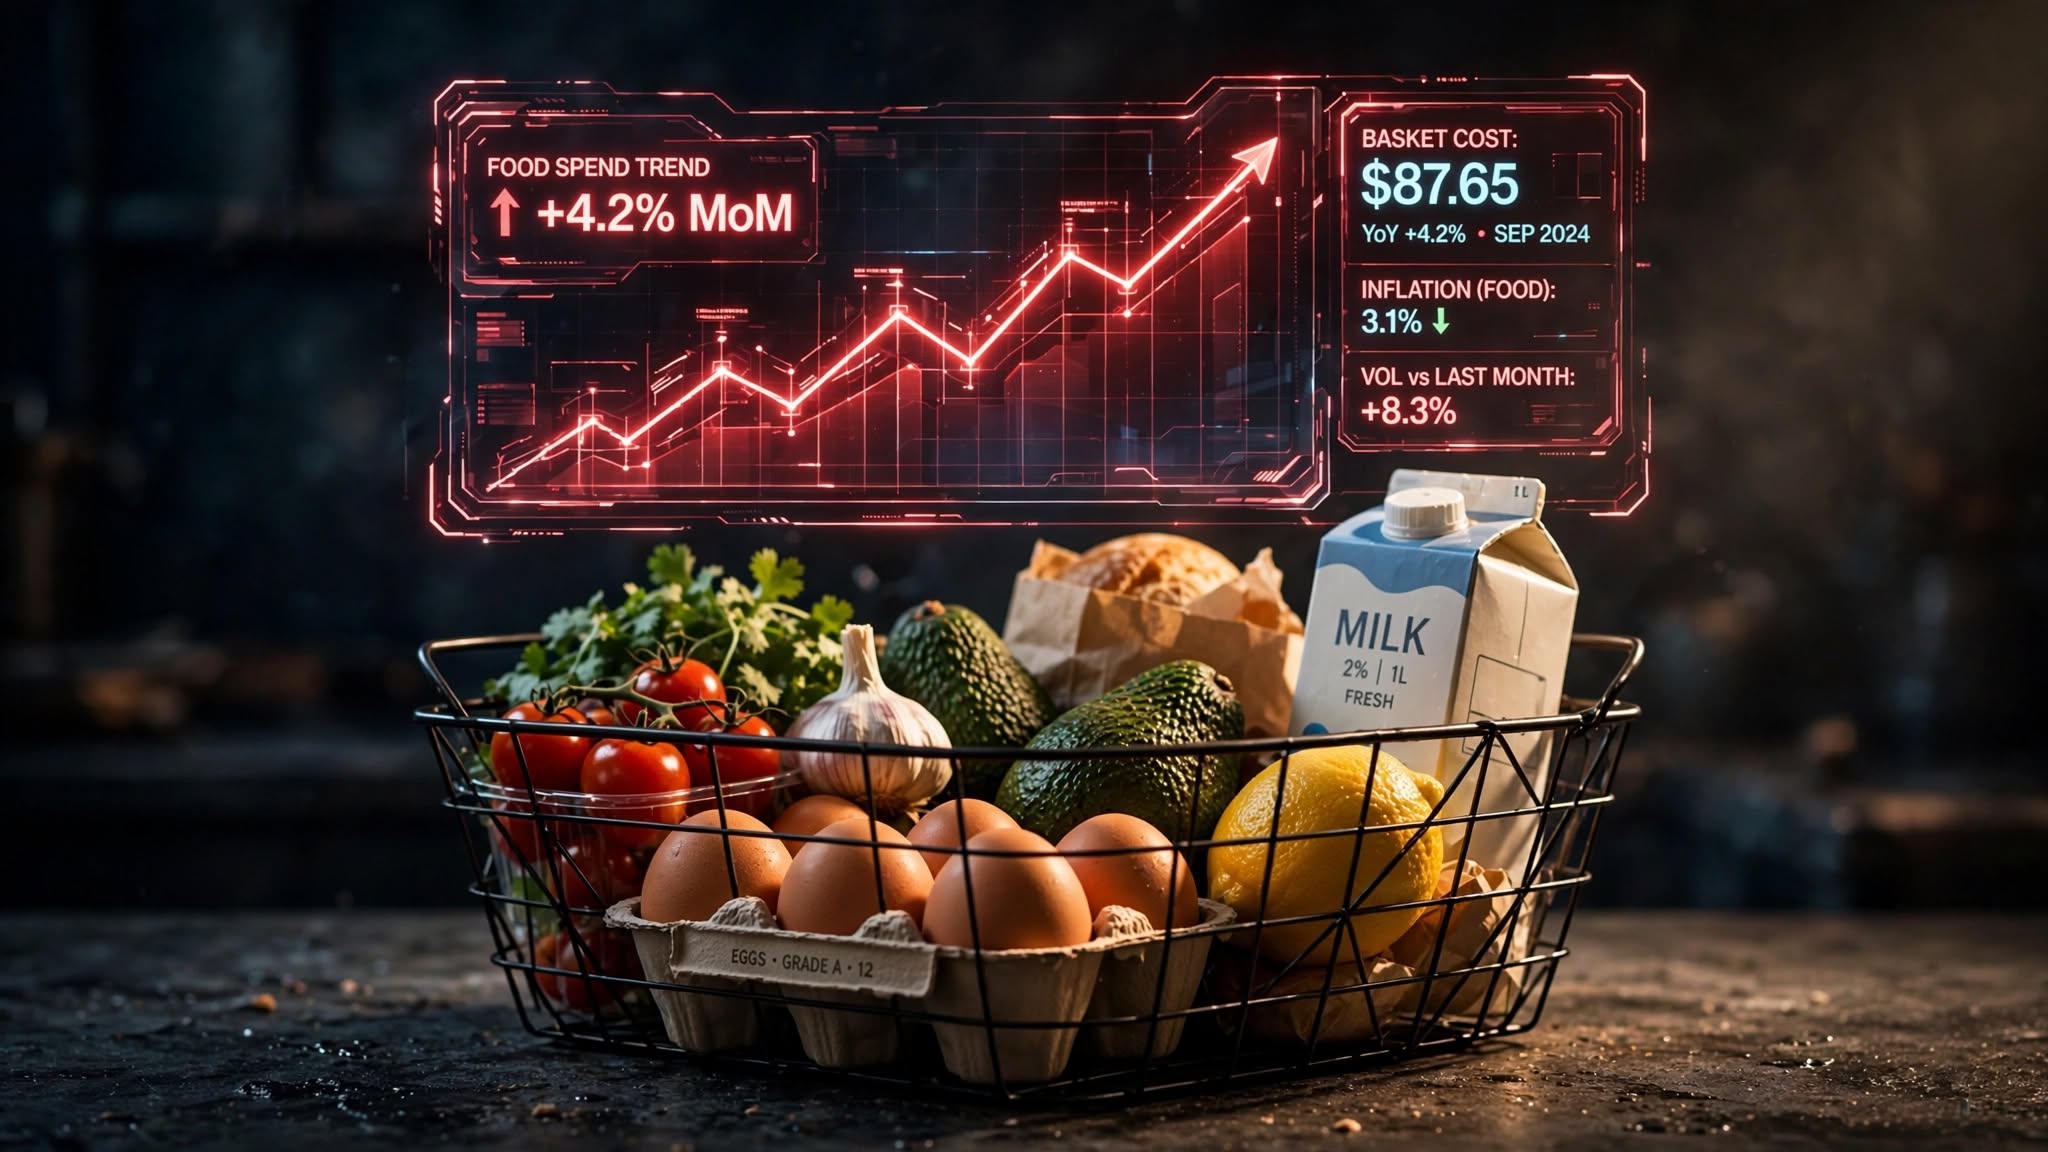
Inflation is the rate at which the general level of prices for goods and services rises in an economy, subsequently eroding the purchasing power of a currency. When inflation goes up, every single unit of currency buys a smaller percentage of a good or service. This means that if inflation is running at 10% annually, a basket of groceries that costs Rs. 1,000 today will cost Rs. 1,100 a year from now.
For readers of Thefinance.pk and Economy.com.pk, understanding inflation is foundational because it affects everything from daily household grocery budgets to high-level corporate investment strategies. It is not inherently a negative phenomenon; central banks generally target a low, predictable inflation rate (often around 2% in developed economies) to encourage consumption and investment over hoarding cash. However, hyperinflation or volatile inflation can cripple economic growth.
The Three Main Causes of Inflation
Economists generally divide the causes of inflation into three primary categories:
- Demand-Pull Inflation: This occurs when the overall demand for goods and services in an economy outpaces the economy’s ability to produce them. In simple terms, it is “too much money chasing too few goods.” This often happens during periods of rapid economic growth or when a government injects large amounts of stimulus money into the economy.
- Cost-Push Inflation: This type of inflation is driven by an increase in the cost of production. When raw materials (like crude oil or agricultural commodities) become more expensive, or when wages rise significantly, manufacturers pass these increased costs onto the consumer in the form of higher retail prices. A global oil shock is a classic trigger for cost-push inflation.
- Built-In Inflation: Also known as wage-price inflation, this is a psychological and adaptive phenomenon. When workers expect prices to continue rising, they demand higher wages to maintain their standard of living. Employers grant these wage increases but raise the prices of their goods and services to maintain profit margins, creating a continuous loop.
Measuring Inflation: The Consumer Price Index (CPI)
While inflation is the overarching concept, the Consumer Price Index (CPI) is the specific statistical metric used to measure it. The CPI tracks the average change over time in the prices paid by urban and rural consumers for a predefined “basket” of goods and services.
This basket is meticulously designed to reflect the daily spending habits of an average household. It includes various categories heavily weighted by their importance:
- Food and Non-Alcoholic Beverages: Often the largest weight in developing economies.
- Housing, Water, Electricity, and Gas: Utility costs and rent.
- Transport: Fuel prices and public transit costs.
- Health and Education: Medical care, tuition fees, and books.
- Apparel: Clothing and footwear.
How is CPI Calculated?
Statistical bureaus calculate CPI by collecting price data for the items in the basket from retail outlets across the country on a weekly or monthly basis. They establish a “base year” to serve as a benchmark (given an index value of 100).
If the base year is 2016 (Index = 100), and the current index value is 150, it means that the general price level of the basket has increased by 50% since 2016. The percentage change in the CPI from one month to the next, or one year to the next, represents the inflation rate.
CPI in the Context of Pakistan’s Economy
In Pakistan, the Pakistan Bureau of Statistics (PBS) is responsible for compiling and releasing CPI data every month. For platforms like economist.media, the monthly CPI reading is a critical data point.
Because a massive portion of the average Pakistani household income is spent on food and energy, the PBS assigns a very high weighting to these categories. Consequently, when global oil prices spike or agricultural yields drop (due to floods or droughts), Pakistan’s CPI surges aggressively. This imported inflation forces the State Bank of Pakistan (SBP) to tighten monetary policy, usually by raising interest rates to suppress demand and stabilize the Rupee.
The Hidden Tax on Savings
One of the most profound impacts of inflation is its effect on savings. Inflation is often referred to as a “hidden tax.” If you keep your money in a traditional savings account yielding 5% annually, but the CPI inflation rate is 10%, your real rate of return is negative 5%. Your money is mathematically growing, but its actual buying power in the real world is shrinking. This dynamic pushes investors toward assets that traditionally outpace inflation, such as real estate, equities, or gold.
Key Takeaways:
- Inflation represents the loss of purchasing power over time.
- The CPI measures this change using a weighted basket of everyday goods and services.
- Central banks combat high inflation by raising interest rates, which cools down consumer spending and corporate borrowing.
- High food and energy weights make developing economies particularly susceptible to global commodity price shocks.
Authoritative Sources & Further Reading:
- World Bank: Inflation Overview and Global Data
- International Monetary Fund (IMF): Inflation and the Cost of Living
Discover more from The Economy
Subscribe to get the latest posts sent to your email.
The Bureau of Labor Statistics’ July Consumer Price Index report, released Wednesday, August 12, showed headline CPI rising just 0.1% month-over-month, holding the annual inflation rate at 3.4% — a second consecutive month of cooling and a result that gives the Federal Reserve considerably more room to maneuver at its September meeting (BLS).
Inside the Numbers
The July reading followed a 0.4% monthly decline in June — the sharpest drop since April 2020 — as the initial energy shock from the U.S.-Iran conflict continued to fade. Trading Economics’ breakdown shows gasoline prices up 24.6% year-over-year in July, down from 26.7% in June, while fuel oil costs rose 39.1%, easing from 42.9% the prior month. Shelter inflation cooled slightly to 3.2% from 3.3%, and food inflation held steady at 3% (Trading Economics).
Economists polled ahead of the release had expected a similarly modest 0.1% headline increase and a 0.2% rise in core CPI, according to CNBC’s pre-release preview, with the report widely seen as “a big deal for the Fed” given how directly it would shape September rate-decision odds (CNBC).
Why This Report Matters More Than Usual
The July CPI print landed against the backdrop of a weak July jobs report that had already shifted market expectations sharply toward a rate cut. CNBC’s prediction-market tracking noted that the odds of a Fed hike in September “tumbled” following the disappointing jobs data, with the debate among traders shifting almost entirely toward the size of an eventual cut rather than its direction (CNBC Finance).
That combination — a softening labor market alongside genuinely cooling inflation — is precisely the setup the Fed has been waiting for since the Iran-war-driven energy spike complicated its policy path earlier in the year. With energy-related price pressures now clearly in retreat and the labor market showing real cracks, the case for holding rates restrictively into the fall has weakened considerably.
The Market Reaction
Broader financial markets have been trading on exactly this dynamic all week. CNBC’s live markets coverage from August 10 showed oil prices still elevated — Brent crude near $84.42 a barrel — as traders assessed mixed signals over whether a US-Iran deal to reopen the Strait of Hormuz would materialize, even as equity markets continued pricing in a more dovish Fed path (CNBC). By August 12, European and U.S. futures were mixed as attacks on vessels in the Red Sea and Gulf of Oman reignited some shipping-route concerns even as Strait of Hormuz reopening diplomacy continued to show incremental progress (CNBC).
What Comes Next
The Fed’s rate decision is still roughly a month away, and one more jobs report and a Personal Consumption Expenditures inflation reading will land before then. But Wednesday’s CPI data removes one of the last major obstacles to a September cut. The BLS has confirmed the next Consumer Price Index release — covering August data — is scheduled for September 11, 2026, just days before the Fed’s meeting, meaning that report will likely be the final, decisive input into the September decision (BLS).
For now, the combination of a cooling CPI print and a softening labor market has done what months of Fed commentary could not: it has largely settled the argument over the direction of the next move, leaving only the size of the cut still genuinely in question.
What was the US inflation rate in July 2026?
US CPI inflation held at 3.4% year-over-year in July 2026, with prices rising just 0.1% month-over-month, reinforcing market expectations for a Federal Reserve rate cut in September.
Discover more from The Economy
Subscribe to get the latest posts sent to your email.
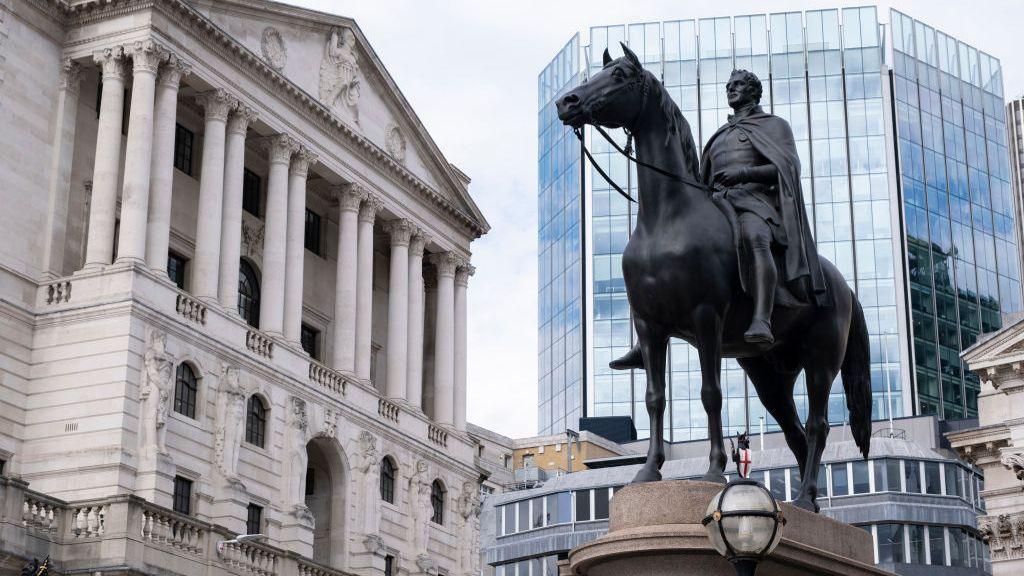
The Bank of England’s Monetary Policy Committee left interest rates unchanged at 3.75% on July 30, but the accompanying message was anything but reassuring: policymakers now expect CPI inflation to peak at around 3.2% in the fourth quarter of 2026, with “risks to the inflation outlook tilted to the upside” (House of Commons Library).
A Split Committee, a Cautious Message
The vote itself revealed real disagreement inside the Bank: six members backed holding rates steady, while three voted for a 0.25 percentage point increase — a notably hawkish split for a central bank that spent the previous 16 months gradually cutting rates from a 2023 peak of 5.25% down by a cumulative 1.5 percentage points (House of Commons Library).
Governor Andrew Bailey framed the dilemma plainly: “Inflation has fallen faster than we’d expected, but the conflict in the Middle East continues to mean high and volatile energy prices. That will cause inflation to rise again later this year,” he said, according to Hanbury Wealth’s summary of the July decision (Hanbury Wealth).
The Numbers So Far
UK CPI inflation stood at 2.6% in June 2026, down from 2.8% in May, with food price inflation easing to 1.7% — its lowest level since August 2024 (House of Commons Library). Prior to the Middle East conflict, the Bank had expected inflation to fall to around 2% from April and hold there through the rest of 2026. Instead, its June 18 forecast pointed to CPI running “a little under 3%” in Q3 and “a little over 3¼%” in Q4 — materially hotter than the pre-conflict baseline.
Why Britain Is Uniquely Exposed
The Resolution Foundation’s Q2 2026 Macroeconomic Policy Outlook identifies two structural features that make the UK more vulnerable to this energy shock than its G7 peers. First, gas accounts for 62% of final household energy consumption in Britain — by far the highest share in the G7 — and UK electricity prices are closely tied to wholesale gas costs. Second, UK interest rates have been unusually reactive: in March 2026, UK 10-year gilt yields rose more than those of any other G7 economy except Italy, reflecting both sticky inflation and stretched public finances (Resolution Foundation). The same analysis notes the IMF and OECD both cut their 2026 UK growth forecasts by 0.5 percentage points — the largest downgrade of any advanced economy.
The Labour Market Is Cooling Too
Employment data compiled by Opus Business Advisory Group shows unemployment holding at 4.9% in the three months to May, with job vacancies falling to 712,000 — almost half their 2022 level. Youth unemployment is a particular concern, running at 16.4% for those aged 16–24 in March–May 2026, up from 14.2% a year earlier. Real wage growth, adjusted for CPIH, was just 0.3% for the period — modest but a slight improvement on the near-flat readings of previous quarters (Opus Business Advisory Group).
Government Response
Prime Minister Andy Burnham has moved to cushion the cost-of-living impact directly, pledging a £2 bus-fare cap across England and the removal of VAT from household electricity bills from October, while insisting he will maintain existing fiscal rules rather than raise taxes (Hanbury Wealth). Separately, the government has announced a 20% business-rates reduction for pubs, clubs, and live-music venues from April 2027, alongside an expansion of the British Business Bank’s Growth Guarantee scheme to reach 12,000 more UK businesses — part of a wider push to arrest small-firm closures amid what the Federation of Small Businesses calls a troubling “new normal” of contraction expectations.
The Bottom Line
The British Chambers of Commerce forecasts UK GDP growth of just 0.9% for 2026, with unemployment peaking at 5.2% and inflation reaching 3.8% by year-end — modestly hotter than the Bank’s own projection. Both the BCC and IMF broadly agree the Bank should hold rates steady through the rest of 2026 rather than tighten further, betting that a restrictive-but-stable policy stance will anchor long-term inflation expectations without needlessly crushing growth (British Chambers of Commerce). Whether that bet pays off depends almost entirely on how the Middle East conflict — and the energy prices it continues to drive — evolves over the rest of the year.
What is the Bank of England’s interest rate in August 2026?
The Bank of England held its base rate at 3.75% on July 30, 2026, with policymakers projecting CPI inflation will peak near 3.2% in Q4 2026 due to Middle East-driven energy price pressures.
Discover more from The Economy
Subscribe to get the latest posts sent to your email.

Dow Jones vs. Middle East Tensions: How Wall Street Is Pricing In a 2026 Conflict Nobody Saw Coming

Bank of England’s September 17 Decision: Will UK Interest Rates Finally Move?

Inflation Is Outpacing Wage Growth Again: What It Means for Your Paycheck

10-Year Treasury Yield Tops 5%: What It Means for Mortgages, Stocks, and the Fed

Ceasefire Negotiations in 2026: Predicting the Rebound of European and Asian Economies

Emerging Markets Update: The Impact of World Bank Policies on PSX Stability

Costco Oil Shortage 2026: Will Prices Double for All Synthetic Motor Oils?

Trump’s $5,000 Promise: The Hidden Tax Implications for Retail Investors

Global Economy Outlook 2026: What Ceasefire Talks Mean for the Tech Sector

China Stocks Today: Are Big Economies in Asia Nearing a Market Bottom?

Stock Market Crash 2026? How the Trump $5,000 Dividend Impacts Global Inflation

Tax-to-GDP Ratio Explained: Global Benchmarks, Fiscal Sovereignty & 2026 Insights

Trade Deficit & Terms of Trade Explained: Global Impact, Real-World Examples, and 2026 Insights

Supply vs Demand Shocks Explained: Market Equilibrium, Inflation Risks & Policy Responses in 2026

State Farm’s $5B Dividend 2026: Who Qualifies & Payout Dates

US-China Relations in Q3 2026: Trade Tariffs and Supply Chain Risks

Gold’s Wild 2026: From a Record $5,600 Peak to a 24% Crash and Back Toward $4,500

Oil Surges as Strait of Hormuz Traffic Collapses Again

Bank of England Set to Hold Rates Through Year-End, Reuters Poll Shows

SpaceX Starship Flight 14: First Orbital Attempt & Starlink V3 Launch Explained

The 2026 Crypto Regulatory Shift: What It Means for Institutional Investors

Top 30 Stocks for Investment in PSX for Massive ROI in 2026

AI Chip Stocks 2026: The Best Semiconductor Investments Beyond Marvell

AI-Powered Training: The Next Multi-Billion Dollar Ecosystem in Fitness

Tween Back-to-School Trends 2026: What’s Driving the $85B Season

Russia’s Black Sea Oil Exports Fall for a Fifth Straight Week

Global Chip Selloff Deepens: What’s Driving the Aug. 19 Semiconductor Rout

Shein Clothes Quality & Safety in 2026: What Lab Tests Show
-

 Markets & Finance8 months ago
Top 15 Stocks for Investment in 2026 in PSX: Your Complete Guide to Pakistan’s Best Investment Opportunities
-

 Analysis7 months ago
Johor’s Investment Boom: The Hidden Costs Behind Malaysia’s Most Ambitious Economic Surge
-

 Analysis7 months ago
Top 10 Stocks for Investment in PSX for Quick Returns in 2026
-

 Analysis7 months ago
Brazil’s Rare Earth Race: US, EU, and China Compete for Critical Minerals as Tensions Rise
-

 Banks8 months ago
Best Investments in Pakistan 2026: Top 10 Low-Price Shares and Long-Term Picks for the PSX
-

 Investment8 months ago
Top 10 Mutual Fund Managers in Pakistan for Investment in 2026: A Comprehensive Guide for Optimal Returns
-

 Global Economy9 months ago
15 Most Lucrative Sectors for Investment in Pakistan: A 2025 Data-Driven Analysis
-

 Global Economy9 months ago
Pakistan’s Export Goldmine: 10 Game-Changing Markets Where Pakistani Businesses Are Winning Big in 2025