
Mortgage
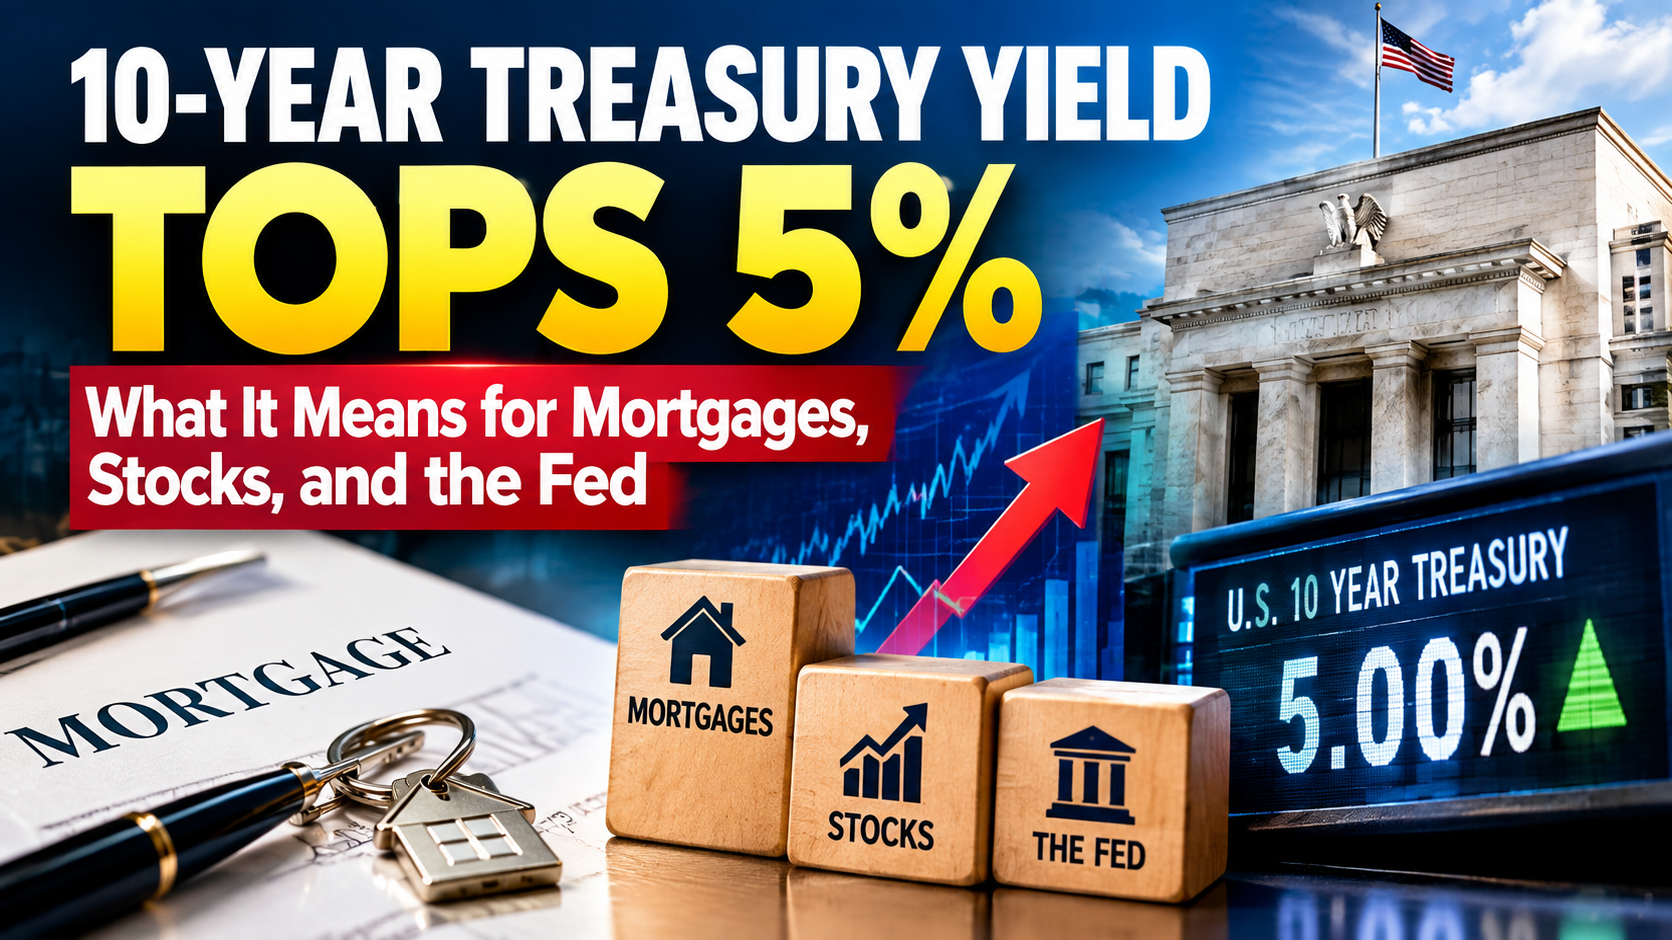
10-Year Treasury Yield Tops 5%: What It Means for Mortgages, Stocks, and the Fed

Key Takeaways
- The benchmark 10-year US Treasury yield briefly touched 5.014% on Monday, September 14, 2026 — its first move above the psychologically important 5% threshold since October 2023, and only its second time above that level since the 2007-2008 financial crisis.
- The move came just two days before the Federal Reserve’s September policy meeting, with markets now pricing roughly a 90% probability of a rate hike rather than a cut, according to CME Group’s FedWatch tool.
- The catalyst combines several forces at once: Brent crude topping $109/barrel, a hotter-than-expected August CPI report, swelling government and corporate borrowing needs, and a possible unwinding of the Japanese yen carry trade as Japanese rates climb.
- The 30-year Treasury yield reached 5.386%, directly affecting mortgage pricing, while 10-year yields in the UK and Australia have also climbed above 5% — signaling this is a global, not purely American, bond-market phenomenon.
- Veteran market strategist Ed Yardeni notes that neither the yield spike nor the global bond selloff has “broken” the stock market’s bull run so far, crediting continued strength in corporate earnings.
For the first time in nearly three years, the interest rate that anchors global borrowing costs — the US 10-year Treasury yield — has crossed the symbolically important 5% threshold. The move, which arrived just 48 hours before the Federal Reserve’s September policy decision, is rippling through mortgage markets, equity valuations, and central bank calculations from Washington to Tokyo. Here’s what actually happened, why, and what it means for anyone watching the stock market today.
What Happened
The 10-year Treasury yield climbed as high as 5.014% intraday on Monday, September 14, 2026, before paring the move back to around 4.94–4.99% by afternoon trading. It marked the first time the yield had crossed 5% during a trading session since October 23, 2023, and — as several outlets noted — only the second time it has traded this high since July 2007, just before the global financial crisis. A close above 5.02% would represent the highest level since that pre-crisis period.
The move wasn’t isolated to the 10-year note. The 2-year Treasury yield, which is more directly sensitive to near-term Fed policy, climbed to 4.679%, surpassing its previous July 2024 high. The 30-year yield — the benchmark most directly tied to fixed mortgage rates — touched 5.386% before paring some of its gains.
Why Yields Are Spiking: Four Forces Converging
1. Oil-driven inflation fears. Brent crude climbed to a session high past $109 a barrel as fighting between the US and Iran escalated, directly feeding into bond investors’ inflation expectations. Rising energy costs erode the fixed returns bondholders receive, pushing yields higher to compensate.
2. A hotter-than-expected inflation print. Friday’s August CPI report showed inflation running hotter than markets had anticipated. Goldman Sachs’ chief economist David Mericle wrote that while the report didn’t change the bank’s underlying inflation view, it pushed market pricing of a Fed rate hike this week to nearly 90% — a striking reversal from earlier-year expectations of continued rate cuts.
3. Swelling government and corporate borrowing. The yield spike is also being driven by basic supply-and-demand dynamics in the bond market: both the federal government and major corporations are issuing substantial new debt to fund spending, adding to the overall supply of bonds competing for investor capital.
4. A potential yen carry-trade unwind. Yardeni Research has floated a more technical explanation with global implications: as Japanese interest rates rise and the yen strengthens (partly on Japan’s own defense-spending and monetary-policy shifts), the long-popular “carry trade” — in which investors borrow cheaply in yen and invest in higher-yielding assets elsewhere — becomes less attractive. Unwinding those positions could be contributing to selling pressure across global bond markets, not just US Treasuries.
Global Context: This Isn’t Just an American Story
The yield surge isn’t confined to the US. Ten-year yields in both Australia and the UK have also climbed above 5%, reinforcing that this is a broader global bond-market repricing rather than a US-specific event. Yardeni’s assessment captures the moment’s tension well: a global yield spike of this magnitude “would normally be enough to break a global bull market in stocks. Neither has so far” — crediting resilient corporate earnings for equities’ relative calm despite the bond turmoil.
Rate Decision Timing: Why This Matters So Much Right Now
The timing amplifies the significance considerably. The yield spike landed just two days ahead of the Federal Reserve’s September policy meeting, transforming what might otherwise be a notable but contained bond-market move into a live variable in the Fed’s own deliberations. According to CME Group’s FedWatch tool, the probability of a rate hike this week has climbed above 90%, while Polymarket bettors have priced the same outcome at around 80%. Some market watchers are also monitoring rising tension between President Trump and Fed Chair Kevin Warsh as a wildcard factor in how the central bank navigates the decision.
Yield Snapshot
| Maturity | Peak Yield (Sept 14, 2026) | Significance |
|---|---|---|
| 2-year Treasury | 4.679% | Highest since July 2024; most Fed-sensitive |
| 10-year Treasury | 5.014% | First above 5% since October 2023 |
| 20-year Treasury | 5.426% | Sensitive to geopolitical risk |
| 30-year Treasury | 5.386% | Benchmark for mortgage rates |
Why This Matters: Mortgages, Portfolios, and the Fed’s Next Move
For everyday borrowers, the 30-year yield’s climb toward 5.4% translates fairly directly into higher fixed mortgage rates, making home purchases and refinancing meaningfully more expensive than earlier in 2026. For equity investors, the key question is whether corporate earnings can continue outrunning the drag from higher borrowing costs — the dynamic Yardeni credits for the stock market’s calm so far. And for the Fed, Wednesday’s decision now carries outsized weight: a hike would validate the bond market’s current pricing, while a hold could trigger further yield volatility if investors interpret it as the central bank falling behind an inflation trend that oil prices and geopolitical tension are actively worsening.
Frequently Asked Questions
Why did the 10-year Treasury yield cross 5% in September 2026?
The move was driven by a combination of surging oil prices tied to the escalating US-Iran conflict, a hotter-than-expected August CPI report, heavy government and corporate bond issuance, and a possible unwinding of the yen carry trade as Japanese rates rise.
How does a 5% Treasury yield affect mortgage rates?
The 30-year Treasury yield, which climbed to 5.386% alongside the 10-year’s move, is the most direct benchmark for 30-year fixed mortgage rates, meaning this yield spike is likely pushing mortgage borrowing costs higher for US homebuyers.
Will the Federal Reserve raise interest rates this week?
As of the yield spike, markets were pricing roughly a 90% probability of a rate hike at the Fed’s September meeting, according to CME Group’s FedWatch tool — a sharp reversal from earlier expectations of rate cuts.
Discover more from The Economy
Subscribe to get the latest posts sent to your email.


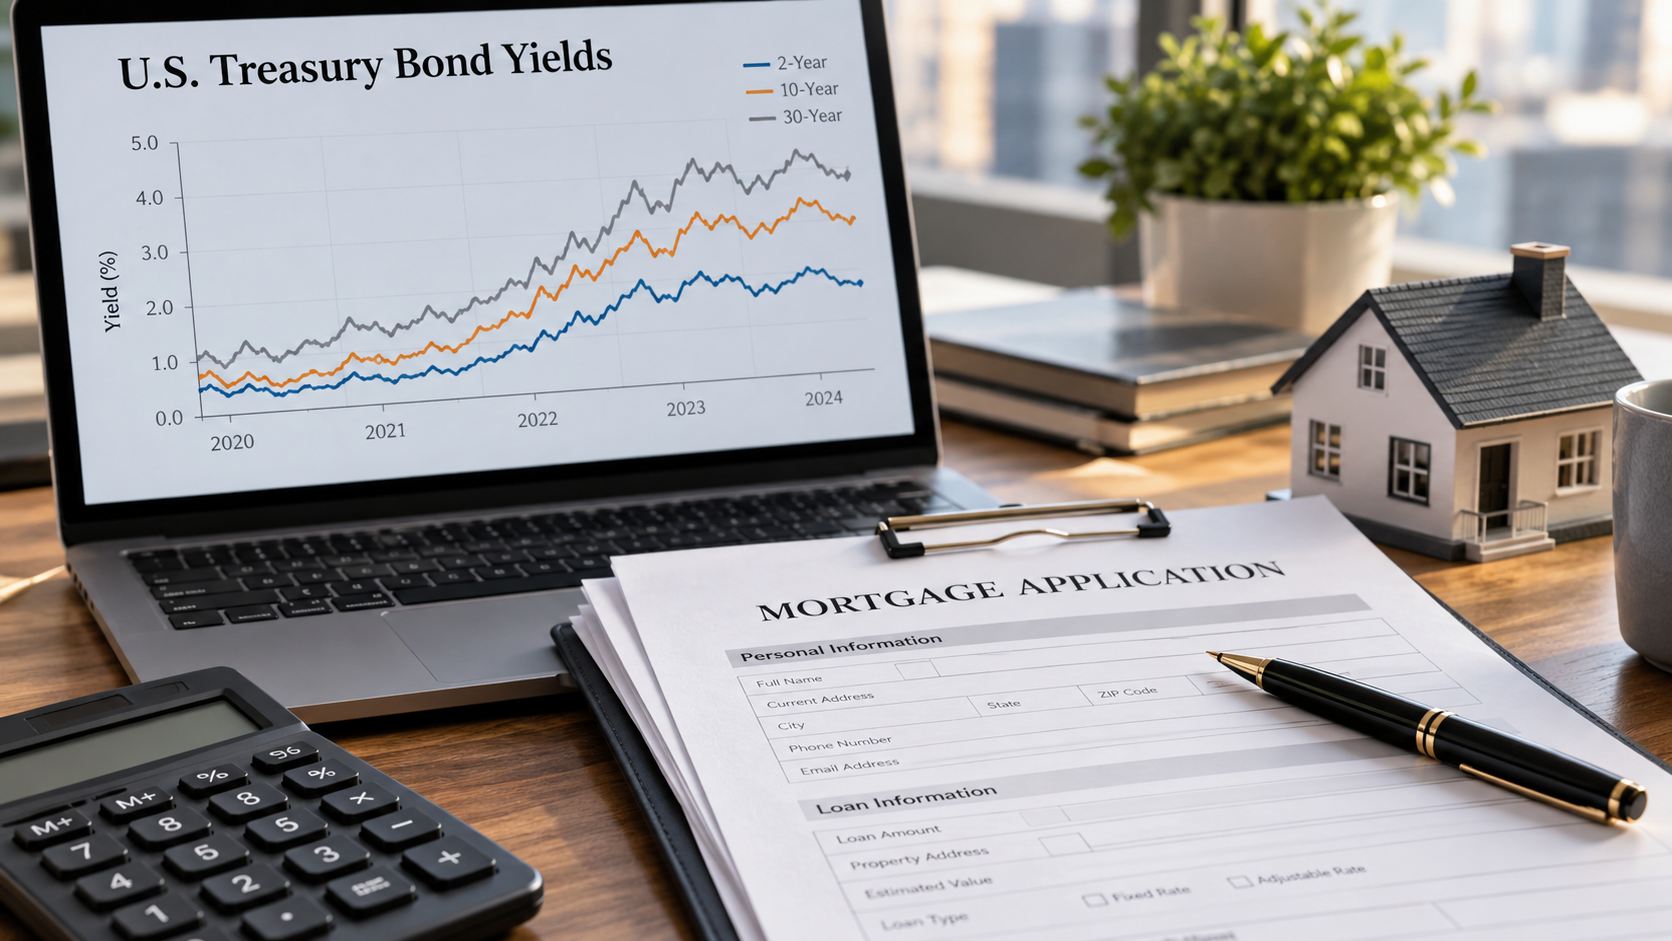
Long-term Treasury yields are the price signal linking government borrowing, mortgages, growth-stock valuations and the return available on safer assets. Reuters has highlighted an unusual 2026 divergence: shares near highs while longer-term bond yields have climbed. A bond yield is not the same as the Federal Reserve policy rate, and a large move in either can affect people differently depending on whether they borrow, save or invest. Sources: Reuters bond market analysis and Reuters market breadth.
The important context competitors can overlook
Bond prices generally fall when market yields rise. That inverse relationship explains why holders of long-duration bond funds can suffer losses even as the yields offered to new buyers become more attractive. Mortgage rates also reflect lending spreads, credit risk and other factors, so a single Treasury number cannot predict a specific home-loan offer. Companies with distant expected cash flows may be particularly sensitive to higher discount rates. For primary-source checks and current reporting, see Reuters bond market analysis and Investor.gov. The key distinction is translate bond math into household decisions.
Long-term Treasury yields connect bond markets to household borrowing and asset values. Higher yields can benefit new savers while hurting some borrowers and existing bondholders. Research cutoff: October 12, 2026; confirm developing facts before publication.
A practical way to use this information
Compare yields at consistent maturities rather than mixing two-year and ten-year readings. A homebuyer should assess monthly payment affordability at an actual lender quote. A saver choosing between a short-term bill and a long-term fund should consider liquidity needs and interest-rate risk. For an investor, the useful question is what rate assumptions are embedded in a company valuation, not whether “6%” makes a dramatic headline.
A simple rate-shock example
Imagine an existing long-duration bond fund whose duration is eight years. A simplified duration approximation suggests a one-percentage-point increase in yield could mean about an 8% price decline, before convexity, income and other effects. This is illustrative, not a forecast for a named fund. A short-term Treasury instrument with far lower duration usually reacts less to the same yield shock.
That distinction makes a practical difference for readers considering an emergency fund versus retirement money they can invest for a decade. The current market narrative described by Reuters should prompt a discussion of time horizon, not a blanket instruction to abandon bonds.
What to verify before making a decision
The right next step is to identify the source, timestamp and applicable market or jurisdiction. Check whether a number is a historical observation, official announcement, target, forecast or scenario. If you intend to act financially, legally or commercially, use the relevant provider’s current terms and obtain professional advice where appropriate. The sources cited here establish context; they are not a substitute for live prices, individual eligibility checks or binding agreements.
Reader questions
Are higher Treasury yields always bad?
No. New fixed-income savers may earn more, while existing long-duration bond prices can decline.
Does the Fed set the ten-year Treasury yield?
No. It influences conditions, but market expectations and term premiums also matter.
Why the ten-year yield influences everyday borrowing
The 10-year U.S. Treasury yield is an important benchmark for longer-term financing because it reflects the return investors require to hold government debt with that maturity. Mortgage rates do not equal the 10-year yield, but lenders consider Treasury markets, mortgage-backed securities, credit risk, servicing costs and competition when setting offers. If investors demand a higher return across long-term bonds, mortgage borrowing can become more expensive even without an immediate increase in the Federal Reserve’s short-term policy rate.
Suppose a buyer finances $300,000 over 30 years with a fixed-rate mortgage. At an illustrative 6% annual interest rate, principal and interest are roughly $1,799 per month; at 7%, they are roughly $1,996. The difference of about $197 per month excludes taxes, insurance, fees and other ownership costs. It demonstrates why a change in borrowing conditions can outweigh a modest change in a home’s asking price. Real quotes depend on the borrower’s circumstances and market conditions, not merely the Treasury yield reported in a news article.
Why bond prices and bond yields move in opposite directions
A conventional fixed-coupon bond promises specified payments. When newly issued securities offer higher yields, an existing bond with a lower coupon generally must trade at a lower price to attract buyers. The opposite happens when market yields fall. Duration measures a bond’s sensitivity to interest-rate changes. As an approximate illustration, a portfolio with an effective duration of seven years could lose about 7% in price if relevant yields rise by one percentage point, before other effects. The relationship is approximate and can vary with convexity, changing spreads and portfolio holdings.
For savers, a higher yield can be welcome if they are buying newly issued securities and can hold them under suitable circumstances. For owners of existing long-duration bonds, the same move can produce mark-to-market losses. Investors seeking near-term stability should understand the distinction between a bond’s redemption terms and the market price they might receive if they must sell before maturity. Credit risk also differs between Treasury securities and corporate or municipal bonds.
The yield curve tells a story, but not one prediction
The yield curve plots interest rates across maturities. Its shape can reflect expectations for growth, inflation, monetary policy and compensation for holding longer bonds. An inverted curve has often been studied as a recession signal, yet neither inversion nor steepening guarantees a specific economic outcome. A steepening curve may arise because investors expect stronger future activity, higher inflation or greater long-term borrowing supply. The underlying cause matters more than the shape alone.
Distinguish nominal yields from real yields after expected inflation. If a nominal Treasury yield rises because inflation expectations rise, the investor’s purchasing-power return may not improve nearly as much as the headline suggests. Treasury Inflation-Protected Securities provide another reference point, though their market prices and practical suitability also require care. Useful analysis compares inflation expectations, real yields and nominal yields rather than describing all higher rates as a sign of healthy growth.
A decision framework for households
Borrowers should compare multiple complete loan offers, including interest rate, annual percentage rate, closing costs and applicable points. A lower headline rate with very large upfront fees may not be cheaper for someone planning to move or refinance. Depositors should distinguish variable savings-account APYs from yields locked by certain fixed-term products. Bond-fund investors should review duration, credit quality, expenses and possible withdrawals. Stock investors should consider how higher discount rates affect the value assigned to future profits, particularly where profits are expected many years ahead.
No single financial product becomes universally best because yields reach a round number. A retiree seeking predictable cash flow, a first-time homebuyer and a technology-company investor face different tradeoffs. Their financial decisions are better guided by time horizon, liquidity and risk tolerance than by a prediction of where the yield will be next week.
The key variables to monitor
For a coherent market story, compare the 2-year and 10-year Treasury yields, current Fed communications, the latest inflation data and changes in bond-market liquidity. Track the time at which each observation was made. Also distinguish a policy announcement from a market-implied forecast; futures pricing can change significantly with new information. Where a report cites a historic high, specify the exact maturity and comparison period. Generalized phrases such as “rates hit their highest level” can conceal important differences.
Relevant data and explanations are available from the U.S. Treasury and Federal Reserve. Those are appropriate baselines for an article readers may use to understand mortgages, bonds and savings decisions.
Discover more from The Economy
Subscribe to get the latest posts sent to your email.

For US homebuyers, the mortgage question in 2026 is about more than the direction of the next interest-rate announcement. The practical issue is whether the full cost of a home fits a household’s finances without depending on an uncertain future refinance.
Freddie Mac’s Primary Mortgage Market Survey reported a 7.40% average for a 30-year fixed mortgage on 8 October 2026, compared with 7.28% a week earlier. The 15-year average was 6.73%. These are weekly market benchmarks, not offers available to every applicant. Actual pricing depends on the borrower, property, loan structure and lender.
Earlier forecasts can now look optimistic because they were produced under different conditions. The right response is to compare current evidence with current costs, rather than assume that a predicted decline must eventually arrive on schedule.
Why the Federal Reserve does not set your mortgage rate
The Federal Reserve influences short-term financial conditions, but a long-term fixed mortgage is priced through a broader market. Investors consider expected inflation, future interest rates and the return available from other securities. Lenders also account for operating costs and the characteristics of the loan.
Mortgage rates can therefore move before a central bank announcement. If investors expect a decision, its likely effect may already be reflected in prices. Rates can even rise after an announcement that appears supportive if the accompanying outlook is less reassuring than expected.
Long-term bond yields are useful context, but they are not a complete mortgage calculator. The spread between those yields and mortgage pricing also changes. A borrower should avoid treating one Treasury-market headline as a precise prediction of the next lender quotation.
A forecast is different from an affordable offer
A national rate forecast can help explain the direction of market expectations. It cannot determine an individual applicant’s approved rate. Credit history, down payment, loan size, occupancy and other factors influence the quote.
Comparisons also become misleading when products differ. A low advertised rate may require upfront points. A shorter term may carry a lower rate but a much higher monthly payment. A variable-rate product may begin attractively while exposing the borrower to later changes.
The Consumer Financial Protection Bureau’s homebuying resources provide a useful starting point for understanding the borrowing process and comparing mortgage documents. For a real decision, written terms from lenders matter more than a promotional headline or a general market prediction.
What a one-percentage-point difference means
Consider an illustrative $300,000 loan repaid over 30 years at a fixed rate. At 6%, monthly principal and interest would be approximately $1,799. At 7%, the payment would be about $1,996. At 8%, it would be around $2,201.
These figures are calculated examples, not lender quotes. They exclude property taxes, insurance, mortgage insurance, homeowners’ association charges and maintenance. They nevertheless show why apparently small changes in rates matter to household cash flow.
The comparison also demonstrates the danger of shopping only by house price. Two buyers purchasing the same property at different rates can face substantially different monthly obligations. Conversely, a price reduction may offset part of a rate increase. The useful unit of comparison is the complete payment and cash requirement, not either variable in isolation.
The monthly payment is only the beginning
Ownership creates expenses that a principal-and-interest calculator does not capture. Taxes and insurance can change over time. Repairs arrive irregularly. A roof replacement or plumbing problem may not respect the timing of a household’s savings plan.
Closing costs also affect affordability. A borrower who uses nearly all available cash for the purchase may have a manageable scheduled payment but little room for disruption. That distinction matters when employment or other income is uncertain.
A practical budget should separate predictable monthly expenses from reserves for less frequent costs. It should also include the costs of moving and setting up the home. Furniture, utilities and immediate repairs are easy to overlook because they occur outside the mortgage contract, yet they can materially change the first year’s financial experience.
How to compare points and fees
Mortgage points involve paying an upfront amount in exchange for a particular rate arrangement. Whether that trade makes sense depends on the exact offer and how long the borrower expects to keep the loan.
Suppose two otherwise comparable offers differ by $3,000 in upfront cost and $75 in monthly principal and interest. A simple cash-flow comparison produces a 40-month break-even period. That is only an illustration: a full comparison would consider other fees, balances, tax treatment where relevant and the time value of money.
The main lesson is to connect upfront charges with the intended holding period. Someone expecting to sell or refinance soon faces a different calculation from someone planning to keep the same mortgage for many years. A lower rate is not automatically the least expensive overall offer.
Rate locks reduce one uncertainty
A rate lock can protect specified pricing for a defined period, subject to the agreement’s conditions. The details matter: expiry dates, extension charges and changes to the application can affect the result.
The Wall Street Journal’s recent reporting on rate locks describes borrowers seeking more protection as rates rise. That does not establish that the longest available lock is best for every buyer. Its value depends on the expected closing timeline and cost.
Before choosing, ask what happens if the purchase is delayed, whether any float-down feature exists, and which changes could alter the quoted terms. A clear written explanation is more useful than a verbal assurance that the rate is protected. Locking a rate also does not remove the need to complete underwriting and satisfy other conditions.
Refinancing later is an option, not a guarantee
The idea of buying now and refinancing after rates fall can be appealing. It remains conditional on several things: market rates must become attractive, the borrower must qualify, the property must meet relevant requirements, and the savings must justify the costs.
Income, credit history and home value can change. A lower national rate does not ensure an individual borrower will receive an economical offer. Refinancing can also extend the repayment period, reducing the monthly payment while changing the total interest paid over time.
A stronger affordability test asks whether the initial loan works if refinancing never becomes attractive. Potential future savings can then be treated as an additional benefit rather than the assumption holding the purchase together. This is particularly important for households already stretching their monthly budget.
Buying versus waiting requires more than a rate prediction
Waiting has possible benefits and costs. It may allow more savings, improved credit or a clearer employment outlook. It also means continuing to pay rent and accepting uncertainty about future home prices, supply and borrowing costs.
Buying has its own trade-offs. It can provide stability for someone planning a long stay, but it reduces flexibility and creates transaction costs if plans change. A purchase motivated primarily by fear of missing out may not fit the household’s actual needs.
Compare realistic scenarios rather than one ideal outcome. What if rates remain near current levels? What if the desired home becomes cheaper but financing becomes more expensive? What if a job change requires relocation? A decision that remains workable across several plausible outcomes is less dependent on successful market timing.
What to watch next
The most relevant indicators include inflation data, long-term bond yields, credit conditions and lender competition. Housing supply also matters: lower mortgage rates would not automatically make homes affordable if prices rose enough to offset the financing improvement.
Update comparisons using the same loan amount, term, lock period and fee assumptions. Record the date of each quote because market conditions can change quickly. If one offer appears dramatically cheaper, identify the reason before treating it as an equivalent product.
Mortgage rates in 2026 remain a major affordability constraint, but forecasting them is only part of the decision. The more dependable approach is to compare complete offers, protect a realistic cash reserve and purchase only within a budget that works under the loan’s actual terms. The calculations here are educational examples rather than personalised mortgage advice.
Discover more from The Economy
Subscribe to get the latest posts sent to your email.
Mortgage rates near 7% change the refinance math. Learn how to calculate your break-even point, weigh closing costs, and decide if refinancing still pays.
Key Takeaways
- Freddie Mac’s weekly average for a 30-year fixed mortgage reached 7.28% for the week ending October 1, 2026, up from 6.00% in early March.
- Refinancing pays off only when monthly savings recover closing costs within the years you plan to stay in the home.
- Use this formula: total closing costs ÷ monthly savings = months to break even.
- Closing costs commonly run 2% to 6% of the loan amount, so a $300,000 refinance could cost $6,000 to $18,000.
- A lower rate is not automatically a better deal. Term length, cash-out amounts, and how long you stay all change the answer.
Search Intent Summary
Most people searching for refinancing want to answer one question: “Will refinancing save me money, and when?” This guide gives you the calculation, the current rate context, and the questions to ask before you sign.
Where Mortgage Rates Stand Right Now
The rate environment has shifted sharply in 2026. Freddie Mac’s Primary Mortgage Market Survey, which averages rates for well-qualified borrowers on conventional loans, showed the 30-year fixed at 6.00% in early March. By September, rates had moved above 6.7%, and the survey put the 30-year at 7.28% for the week ending October 1.
That matters because many homeowners who refinanced in 2020 or 2021 locked in rates well below 4%. Those borrowers have little reason to refinance today. Others who bought in 2024 or 2025 may have hoped for a drop that has not arrived.
Rates set weekly averages, but your offer depends on your credit score, loan-to-value ratio, and loan type. Freddie Mac’s survey describes a strong borrower profile, so your actual quote may differ. The Federal Reserve Economic Data (FRED) series for the 30-year rate is useful if you want to track the long-run trend yourself.
Calculating Whether Refinancing Makes Sense
The core calculation is simple, and most lenders will give you the inputs.
Step 1: Add up your closing costs. These include lender origination fees, appraisal, title insurance, recording fees, and sometimes prepaid interest and escrow deposits. The Consumer Financial Protection Bureau’s Loan Estimate form lists each charge, and you should compare these forms from at least three lenders.
Step 2: Find your monthly savings. Subtract your new principal-and-interest payment from your current one. Don’t count changes to taxes or insurance, since those would apply either way.
Step 3: Divide. Closing costs divided by monthly savings gives your break-even point in months.
Here is a hypothetical example. Suppose your closing costs are $6,000 and your new payment is $250 lower each month. Dividing gives 24 months. If you plan to stay for ten years, you keep roughly $24,000 in savings beyond the break-even point, minus any interest you pay on a new loan term.
Now consider the reverse. If you expect to sell in two years, that same refinance produces almost no net benefit.
The Hidden Variables Most Guides Skip
Many refinance decisions go wrong because the monthly payment is the only number people compare. Several other factors matter.
Restarting the clock. If you were 8 years into a 30-year loan and refinance into another 30-year loan, you lower the payment but add years of interest. Shortening the term to 15 or 20 years can raise the payment while cutting total interest sharply. Choose the term based on your total cost, not just the monthly figure.
Rolling costs into the loan. No-closing-cost refinances are not free. The lender either charges a higher rate or adds fees to your balance. Adding fees to principal raises the amount you owe and pushes your break-even point later. Compare the two options side by side.
Cash-out refinancing. Taking equity out in cash raises your balance and usually your rate. The money may be useful for home improvements, but it turns a rate decision into a debt decision. Be honest about what the cash will fund.
Your time horizon. A refinance that takes four or five years to break even can still be a good move if you expect to stay for a decade. The Georgia state housing team’s refinancing guidance puts it plainly: you need to recover costs while you still own the home.
Comparing Your Options
| Scenario | Closing Costs | Monthly Savings | Break-Even | Works If You Plan To Stay |
|---|---|---|---|---|
| Rate-and-term, same term | $6,000 | $250 | 24 months | 2+ years |
| Shorter term (30 to 15 years) | $6,000 | $0 to -$100 | Not a savings play | Stays cheaper overall |
| No-closing-cost refi | $0 upfront | $250 | Depends on rate increase | Under 3 years |
| Cash-out | $6,000 | Varies | Often not a savings play | Only if cash has clear value |
The table shows why one number never settles the question. A shorter-term refinance can raise the monthly payment while still saving thousands in interest.
Practical Strategy Before You Apply
Start by pulling your current loan statement and checking the interest rate, remaining balance, and remaining term. Then request Loan Estimates from at least three lenders on the same day. Quotes that arrive on different days can differ because rates move daily.
Ask each lender for the exact closing cost total and the rate for each term option. Run the break-even math on each one. If the difference between offers is small, the lender’s service and speed matter more.
Check your credit before you apply. A higher score can lower your rate enough to change the break-even point. Pay down revolving balances if you can do so cheaply, and avoid opening new credit lines during the process.
Watch the Thursday Freddie Mac release, but treat it as a trend signal rather than a quote. Your lender’s daily rate is what you can lock.
Future Outlook
Nobody can reliably predict where rates go next. The Federal Reserve’s decisions, Treasury yields, and inflation data all feed into mortgage pricing. Waiting for a drop has a cost too, because a delayed refinance means fewer months of savings. The better question is whether the numbers work at today’s rate for the years you plan to stay.
Frequently Asked Questions
Is it worth refinancing when rates are above 7%?
It depends on your current rate. If your existing loan is at 6% or above, a refinance at today’s rates usually won’t save money. If your current rate is well above the market, run the break-even calculation before deciding. Staying in your home for a long time can still make a higher-rate refinance worthwhile, but only if the savings justify it.
How much do refinancing closing costs usually run?
Expect roughly 2% to 6% of your loan amount, according to Bankrate’s refinancing guide. On a $300,000 loan, that works out to about $6,000 to $18,000. Lenders vary, and some fees can be negotiated.
How do I calculate my refinance break-even point?
Divide your total closing costs by your monthly payment savings. For example, $6,000 in costs and $250 in monthly savings gives a 24-month break-even point. If you plan to move before that date, refinancing may cost you money.
Should I choose a shorter loan term when refinancing?
A shorter term usually reduces total interest but raises the monthly payment. It fits best if you can afford the higher payment without strain. A longer term lowers the monthly payment but increases the lifetime interest you pay, so compare total costs, not just the monthly figure.
Discover more from The Economy
Subscribe to get the latest posts sent to your email.

Gold at the $4,000 Line: Possible December Fed Hike

Oil at $100+: Hormuz, a Qatari Peace Draft and the Iran Deadline

The Fed’s 10-2 Hold: Why Two Dissenters Wanted a Rate Hike

SBP Raises Policy Rate to 12%: What It Means for Your Loans, Savings and Business

IMF’s $1.2bn Staff-Level Deal: What Pakistan Promised on Surplus

Decoding the DBS–BCA Merger Rumour: Market Volatility, Strategic Realities

New Xbox Games October 26–30, 2026: Releases and Game Pass

Tokyo Disneyland Peter Pan’s Flight Closure: January–February 2027 Guide

Neocloud Economics in 2026: GPU Debt, Utilization and Power

What Is a Neocloud? How AI GPU Clouds Work and Compare

Lula Re-elected in 2026: What Changes for the Dollar, Brazilian Stocks, and Interest Rates?

Lula Wins Brazil’s 2026 Election: Five Economic Tests for 2027

SSI November 2026 Payment: Why Benefits Arrive October 30

Russia Sanctions Waiver: What Asian Oil Buyers Gain

Crude Oil & Petroleum Market Analysis: OPEC+ Decisions and Price Forecasts

Top US Convenience Store Chains: Store Counts, EV Charging, and Sales Trends

Social Security Extra $90 Deposit: Who Qualifies for the October 2026 Medicare Rebate?

Who Is Shivon Zilis? The Neuralink Executive at the Center of the Musk–OpenAI Trial

Algorithmic Dogfights: Why the U.S. and China Must Establish Rules of Engagement for Autonomous Air Power

Gold Price Outlook 2026: The Forces Behind the Forecasts—and What Could Reverse Them

Corporate America Faces a New Debt Test as US Borrowing Costs Surge

Global Economic Outlook 2026: 7 Forces Reshaping Markets, Trade and Business

Stock Market Crash in 2026? Warning Signs, Scenarios and a Calm Investor Checklist

Stock Market Today: Dow, S&P 500, and Nasdaq Retreat as Treasury Yields

Geopolitics and Your Portfolio: How International Affairs Move Global Markets

Anthropic Bans Sustained Abuse of Claude AI Under New Usage Policy Effective November 12, 2026

US–Iran Conflict in October 2026: Hormuz, Oil Prices and Diplomacy

Why Did I Get $90 From Social Security? 8 Reasons Behind an Unexpected SSA Payment
-

 Markets & Finance10 months ago
Top 15 Stocks for Investment in 2026 in PSX: Your Complete Guide to Pakistan’s Best Investment Opportunities
-

 Analysis8 months ago
Johor’s Investment Boom: The Hidden Costs Behind Malaysia’s Most Ambitious Economic Surge
-

 Analysis8 months ago
Top 10 Stocks for Investment in PSX for Quick Returns in 2026
-

 Banks10 months ago
Best Investments in Pakistan 2026: Top 10 Low-Price Shares and Long-Term Picks for the PSX
-

 Analysis9 months ago
Brazil’s Rare Earth Race: US, EU, and China Compete for Critical Minerals as Tensions Rise
-

 Investment10 months ago
Top 10 Mutual Fund Managers in Pakistan for Investment in 2026: A Comprehensive Guide for Optimal Returns
-

 Global Economy10 months ago
15 Most Lucrative Sectors for Investment in Pakistan: A 2025 Data-Driven Analysis
-

 Global Economy10 months ago
Pakistan’s Export Goldmine: 10 Game-Changing Markets Where Pakistani Businesses Are Winning Big in 2025