
Analysis
US Tech Stocks Rebound in 2026 Despite Amazon Plunge: What It Means for Investors

On the morning of February 6, 2026, traders on Wall Street braced for another punishing session. The previous week had seen the S&P 500 software index shed a staggering $1 trillion in market value—a bloodletting driven by mounting anxieties over artificial intelligence spending and returns.
Yet by the closing bell, something unexpected happened: the Nasdaq Composite had clawed back nearly 1.5%, delivering a tech stocks rebound that caught even seasoned analysts off guard. This rally materialized despite Amazon’s shares cratering by approximately 10% after the e-commerce and cloud computing giant announced a jaw-dropping $200 billion-plus capital expenditure plan for AI infrastructure in 2026. The juxtaposition—a broad-based recovery amid a bellwether’s collapse—offers a revealing snapshot of where Wall Street’s relationship with artificial intelligence stands today.
The resilience displayed by US stock markets on February 6 suggests investors are learning to parse winners from losers in the AI gold rush, rather than painting the entire technology sector with a single brush. While Amazon’s ambitious—some would say reckless—spending announcement spooked shareholders, chipmakers and AI infrastructure providers surged, with Nvidia climbing approximately 5% and Broadcom advancing around 4%.
Even cryptocurrency markets, battered by a 50% Bitcoin decline from recent peaks, showed tentative stabilization. This divergence points to a maturing narrative: the market is no longer asking whether AI will transform the economy, but who will capture the value and at what cost.
The Amazon Plunge: Reasons Behind the Drop
Amazon’s stock plunge on February 6 stemmed from a capital allocation announcement that left investors reeling. The company’s commitment to deploy over $200 billion in AI-related capital expenditures throughout 2026—encompassing data centers, custom silicon, and machine learning infrastructure—represents one of the largest single-year technology investments in corporate history. According to financial analysts tracking the sector, this figure dwarfs the combined annual capital spending of most Fortune 500 companies and signals Amazon’s determination to dominate the generative AI race alongside Microsoft and Google.
Yet investors balked. The immediate 8-11% share price decline reflected deep-seated concerns about return timelines and competitive moats. Unlike previous infrastructure buildouts—Amazon Web Services’ expansion in the 2010s, for instance, which generated predictable revenue streams—AI capex carries uncertain payoff horizons. Wall Street’s reaction echoed a broader anxiety: that technology giants are engaged in an arms race where spending begets more spending, but monetization remains elusive. As one portfolio manager noted to Reuters, “We’re witnessing the greatest capital deployment in tech history with the least clarity on customer willingness to pay premium prices for AI services.”
The Amazon stock plunge reasons also tie to margin compression fears. Building and operating AI infrastructure at this scale consumes enormous energy resources and requires specialized talent commanding premium salaries. Amazon’s operating margins, already under pressure from retail competition and AWS pricing dynamics, face additional headwinds. Shareholders appear increasingly skeptical that near-term AI revenues can offset these structural cost increases—a skepticism magnified by the company’s recent earnings reports showing slowing growth in high-margin cloud services.
Nasdaq Recovery: AI Impact and Key Gainers
Despite Amazon’s travails, the Nasdaq recovery on February 6 demonstrated that equity markets have developed a more nuanced understanding of AI’s economic impact. The day’s gainers told a coherent story: investors are backing companies positioned as AI infrastructure providers rather than those merely deploying AI at massive scale.
Nvidia’s 4-6% surge exemplified this dynamic. The chipmaker’s graphics processing units remain the essential hardware powering large language models and generative AI applications. With each additional dollar that Amazon, Microsoft, or Meta commits to AI spending, a meaningful percentage flows to Nvidia. Industry data analyzed by Bloomberg suggests Nvidia’s data center revenue could exceed $100 billion annually by fiscal 2026, driven by insatiable demand for its H100 and next-generation processors. Unlike Amazon, Nvidia faces minimal execution risk on its AI bet—the company sells picks and shovels rather than digging for gold itself.
Broadcom’s 3-5% advance reflected similar logic. The semiconductor firm supplies custom AI accelerators and networking equipment essential for scaling AI data centers. Its business model—high-margin, long-cycle contracts with technology giants—insulates it from the capex skepticism plaguing Amazon. As cloud providers race to build AI infrastructure, Broadcom captures revenue without bearing the utilization risks that come with operating that infrastructure.
The broader Nasdaq Composite’s 1-1.5% rebound also benefited from stabilization in previously battered software names. After losing $1 trillion since late January, the S&P 500 software index found a floor as bargain hunters stepped in. Companies offering AI-enabled software tools—such as ServiceNow and Salesforce—had been indiscriminately sold alongside pure-play AI infrastructure firms, creating valuation disconnects that value-oriented investors began exploiting. This buying interest reflected a recognition that enterprise software incorporating AI features might achieve pricing power and margin expansion even if the underlying infrastructure providers face compressed returns.
Wall Street Tech Rally: Understanding the Broader US Stock Market Bounce Back
The February 6 rally extended beyond mega-cap technology stocks, encompassing a wider US stock market bounce back that suggested improved investor sentiment. Financial sector equities advanced modestly, benefiting from stable interest rate expectations and resilience in consumer credit metrics. Energy stocks posted gains as crude oil prices firmed on geopolitical supply concerns. Even consumer discretionary names—typically sensitive to recession fears—showed tentative strength.
This breadth matters. When technology stocks rebound in isolation, it often signals speculative froth or sector rotation. But when the rally encompasses multiple sectors, it typically indicates genuine improvement in economic fundamentals or risk appetite. The Economic Times reported that manufacturing purchasing manager indices released earlier in the week had exceeded expectations, suggesting the US economy maintained momentum despite Federal Reserve tightening and global growth concerns.
The Wall Street tech rally despite losses in bellwether names like Amazon also highlighted an important psychological shift. Investors appear increasingly comfortable with dispersion—the idea that individual stock performance will vary dramatically based on business model specifics rather than moving in lockstep. This represents a departure from the 2020-2021 period, when virtually all technology stocks surged together on pandemic-driven digitalization narratives. Today’s market rewards precision: knowing not just that AI matters, but which business models will actually profit from it.
Cryptocurrency markets provided an interesting sidebar to the traditional equity rally. Bitcoin, which had plummeted roughly 50% from recent peaks amid regulatory uncertainty and correlations with risk assets, stabilized around key technical support levels. While far from a full recovery, this stabilization removed a source of systemic concern. Large-scale crypto liquidations had previously spillover effects into leveraged equity positions, so Bitcoin’s steadying—even at depressed levels—reduced tail risks for traditional investors.
Tech Sector Recovery Trends: What the Data Reveals
Examining the underlying data behind the tech stocks rebound 2026 reveals several critical trends that will likely shape the sector’s trajectory through the year. First, valuation discipline has returned. The forward price-to-earnings multiples for the Nasdaq 100 have compressed approximately 20% from 2023 peaks, according to financial data compiled by The New York Times. This compression reflects both earnings growth and multiple contraction, suggesting much of the AI enthusiasm has been wrung out of valuations.
Second, AI spending is bifurcating into infrastructure versus application layers, with vastly different investor implications. Infrastructure providers—chipmakers, data center operators, and networking equipment vendors—are commanding premium valuations because their revenue visibility extends years into the future through long-term contracts. Application layer companies, conversely, face heightened scrutiny around customer acquisition costs and monetization strategies. This bifurcation explains why Nvidia and Broadcom rallied while Amazon struggled: the market trusts infrastructure providers to capture value even if ultimate AI applications disappoint.
Third, the pace of AI capital deployment, while staggering in absolute terms, may be moderating at the margin. Financial Times analysis indicates that several major technology firms have begun emphasizing capital efficiency in recent earnings calls, signaling a shift from “build at all costs” to “build strategically.” This moderation, paradoxically, may support stock prices by alleviating fears of infinite spending with finite returns. Amazon’s $200 billion announcement may represent a high-water mark that spooks investors precisely because it seems disconnected from this emerging discipline.
The Road Ahead: Analyst Predictions and Investment Implications
Looking beyond the immediate February 6 rebound, sell-side analysts are sketching two plausible scenarios for tech sector recovery trends through 2026 and beyond. The bull case envisions AI productivity gains materializing faster than expected, driving enterprise adoption and justifying the massive infrastructure buildout. In this scenario, companies like Amazon ultimately vindicate their spending as AI-powered services—from sophisticated customer service agents to automated logistics optimization—generate substantial revenue growth and margin expansion. Chipmakers would continue benefiting from upgrade cycles, and the Nasdaq could revisit all-time highs by year-end.
The bear case, however, warns of a prolonged digestion period where AI capabilities advance but monetization lags. Under this scenario, infrastructure providers might see order growth decelerate as cloud platforms reach temporary capacity sufficiency, and application developers struggle to convert AI features into pricing power. Valuations could remain range-bound, and investors might favor defensive positioning over growth.
The most likely outcome probably lies between these poles: a muddle-through environment where AI proves transformative over five-to-ten year horizons, but the path forward includes volatility, disappointments, and periodic reassessments of timeline and magnitude. For investors, this suggests several principles: maintain exposure to well-capitalized infrastructure providers with durable competitive advantages; approach application layer bets with skepticism unless accompanied by clear evidence of customer willingness to pay; and resist the temptation to extrapolate single-day moves like February 6’s rebound into definitive trend reversals.
The Amazon stock plunge, paradoxically, may prove healthy for the sector long-term if it forces more rigorous capital allocation discussions. Markets function best when they impose discipline on management teams, and the swift punishment of Amazon’s announcement sends a clear message: scale alone won’t satisfy investors—returns matter. As the AI revolution progresses, this discipline will separate sustainable value creation from speculative excess, ultimately benefiting both shareholders and the broader economy.
Discover more from The Economy
Subscribe to get the latest posts sent to your email.


AI
AI Infrastructure Debt Bubble 2026: $570 Billion in Global Debt Issuance Raises Systemic Risk Alarm

Morgan Stanley estimates AI-related global debt issuance will hit $570 billion in 2026, with hyperscaler spending exceeding $1 trillion by 2027. Oracle’s crisis may be the first systemic warning sign.
The question Wall Street was reluctant to ask openly throughout 2024 and most of 2025 is now unavoidable: is the AI infrastructure buildout generating a debt burden that markets have not yet properly priced?
The numbers have become too large to dismiss as routine capital expenditure cycles. Morgan Stanley estimates that AI-related global debt issuance will more than double to nearly $570 billion in 2026, with aggregate hyperscaler capital expenditure projected to exceed $1 trillion by 2027. That figure encompasses spending by Amazon, Microsoft, Alphabet, Meta, Oracle, and a growing constellation of second-tier infrastructure providers building the physical layer of the AI economy.
How the Debt Stack Has Built
The trajectory of Oracle’s balance sheet is instructive as a case study in the speed at which leverage can accumulate. In fiscal 2025, Oracle carried a net cash deficit of approximately $394 million after free cash flow. By the end of fiscal 2026, that had deteriorated to negative $23.7 billion in free cash flow, with long-term debt reaching approximately $124.7 billion. Capital expenditures of $55.7 billion in a single fiscal year represent a 162% increase from the prior year.
Oracle is not alone, though its position is the most stretched. The structural dynamic across the hyperscaler complex is that the companies investing most aggressively in AI data centre capacity are simultaneously facing competitive pressure on their existing software and cloud businesses from AI-native tools — creating a margin squeeze that occurs precisely when cash demands are highest.
Credit Default Swaps as an Early Warning System
One underappreciated signal in this cycle is the behaviour of credit default swaps. Fortune reported that Morgan Stanley’s Lisa Shalett flagged Oracle’s CDS widening as a potential early indicator of broader AI trade stress. CDS spreads — which function as insurance premiums against corporate default — had reached record levels for Oracle by early 2026, even before the most recent earnings-related stock decline.
The concern Shalett articulated was systemic rather than company-specific: “If people start getting worried about Oracle’s ability to pay, that’s gonna be an early indication to us that people are getting nervous.” For a company whose debt is included in major corporate bond indices, the widening of Oracle’s CDS spreads has implications not just for Oracle investors but for anyone holding investment-grade credit exposure broadly.
Bank of America Research described “the lack of clarity on hyperscaler borrowing” as “the key risk going into 2026” — a view validated by subsequent events as Oracle’s stock collapsed and CDS widened even further.
The OpenAI Nexus
A critical vulnerability embedded in the current AI infrastructure cycle is concentration around OpenAI as both the defining customer and the primary justification for hyperscaler spending. Oracle‘s remaining performance obligations are concentrated at least $300 billion in the OpenAI relationship. OpenAI itself is burning cash at what one analyst described as “an insane rate” and has committed to more than $1.4 trillion in total AI buildouts — a commitment that depends on the company’s own ability to sustain fundraising and ultimately generate revenue at scale.
The logical chain from that dependency is a concern articulated plainly by Melius Research: “It is hard to know if Oracle can stick to this capex plan if incremental business arises from the likes of OpenAI and Anthropic. Also, its competitors are unlikely to slow spending and could use Oracle’s spending moderation as the means to gain share.” The competitive dynamic creates a collective action problem: no single hyperscaler can slow down without ceding ground, yet the collective pace of spending is generating balance sheet stress across the sector.
Second-Order Vulnerabilities: Data Centre REITs and Chip Suppliers
The debt accumulation in hyperscaler balance sheets has second-order effects that are not captured in the headline AI capex numbers. Data centre real estate investment trusts — which provide the physical infrastructure that hyperscalers increasingly lease rather than own — have their own exposure to counterparty concentration and lease extension risk. Reports that Blue Owl, Oracle‘s primary data centre financing partner, declined to back the Michigan facility highlighted the fragility of the supporting ecosystem even when the primary tenant appears solvent.
Nvidia, whose chips underpin the entire AI buildout, has been insulated from these concerns by persistent demand that exceeds supply. But if even two or three hyperscalers simultaneously scaled back data centre spending in response to balance sheet pressures, the chip demand outlook would shift rapidly.
The Memory Shortage as Collateral Signal
CNBC reported in late June 2026 that “the memory shortage shaking Apple and Microsoft is an ‘existential crisis’ for smaller players” — a reminder that supply chain bottlenecks are not yet resolved, adding cost and execution risk to projects whose timelines are already being stretched. The combination of persistent demand exceeding supply, expensive debt financing, and uncertain monetisation schedules creates a financial engineering challenge that may prove harder to solve than the engineering challenges of building the data centres themselves.
The AI infrastructure cycle is not necessarily a bubble in the sense of zero underlying demand — the use cases are real and adoption is accelerating. But the debt structure being used to finance it, and the concentration of risk around a small number of foundational relationships, has introduced systemic vulnerabilities that markets are only beginning to price.
Discover more from The Economy
Subscribe to get the latest posts sent to your email.

The World Bank projects global growth at 2.5% in 2026, the weakest since the pandemic, as the US-Iran conflict drives energy price spikes, inflation, and tighter monetary policy worldwide.The World Bank’s mid-2026 baseline carries a number that markets have had to absorb slowly: global GDP growth of 2.5% this year — the weakest since the pandemic — and the culprit is clear.
The World Bank’s latest Global Economic Prospects report identifies the US-Iran conflict that began in late February 2026 as the central shock reshaping the international economic outlook. Energy prices have risen sharply, inflation has re-accelerated across multiple continents, and central banks that had been on the verge of easing cycles have instead begun signalling hikes. The combination has compressed household incomes, widened fiscal deficits, and created a global policy dilemma — fight inflation or protect growth — that has no clean answer.
The Anatomy of the Slowdown
Emerging market and developing economies (EMDEs) face what the World Bank characterises as their weakest per capita income growth since the pandemic era. Growth is projected to decelerate across all EMDE regions in 2026, with the Middle East, North Africa, Afghanistan, and Pakistan bearing the worst damage given direct exposure to the conflict, higher energy import costs, and disrupted shipping. South Asia remains the fastest-growing EMDE region but has nonetheless seen forecasts revised downward.
The mechanism of transmission is threefold. Direct energy price exposure drives headline inflation and suppresses real consumer spending. Disruptions to Strait of Hormuz shipping — which handles roughly 20% of global oil trade — have compressed supply chains and added a risk premium to shipping costs more broadly. And the expectation of prolonged tighter monetary policy has pushed sovereign borrowing costs higher for indebted developing economies.
The Rio Times Global Economy Briefing captured the daily rhythm of the uncertainty: “Whether the US-Iran ceasefire holds. Renewed strikes would push oil higher and add to the inflation problem the Fed is already confronting.” As of the week of June 28, markets remained on edge about the durability of the ceasefire following reports of Iranian targeting of US military assets, which temporarily pushed Brent crude higher and triggered a brief equity sell-off before the market recovered.
Advanced Economies: Slow But Not Collapsing
Advanced nations face a different but related challenge: growth that was already below trend has been further dragged by energy costs and the policy response to inflation. Deloitte’s 2026 Global Economic Outlook noted that after years of disruptive US trade policy, the global trading system has partially reorganised — with numerous bilateral trade deals struck between non-US countries as an alternative to the US-centric framework.
France is projecting GDP growth of just 0.9% in 2026, according to Banque de France, with the contribution of net exports turning negative. Germany and Japan face their own exposure to the China Shock 2.0, as Chinese high-tech exports crowd into categories where both countries previously held competitive advantage. The US itself is navigating a narrowing current account deficit that reflects weaker domestic demand rather than export strength — an ambiguous signal that the Federal Reserve has explicitly flagged as complicating its rate decisions.
Fiscal Pressure and the Poverty Gap
One consequence of the conflict-driven slowdown that policy discussions often underweigh is the distributional impact on the world’s poorest economies. Low-income countries are projected to grow at 5.4% in 2026 — 0.3 percentage points below prior forecasts — as energy import costs consume fiscal space that would otherwise go to infrastructure, healthcare, and education. The World Bank projects that gains in per capita income, averaging 2.7% annually through 2027–28, will be “insufficient to significantly reduce poverty” given the breadth of the setback.
Fiscal pressures will limit governments’ ability to reduce food insecurity and create jobs — a combination the World Bank regards as a medium-term political risk as well as a humanitarian one. A newly identified Ebola outbreak in a low-income economy adds a further downside tail to the forecast.
The 2027 Recovery Thesis
The World Bank’s forward guidance is that a recovery should materialise in 2027–28, driven by an assumed decline in energy prices as supply adjusts and the conflict’s acute phase passes, and a rebound in global trade activity. That recovery is explicitly conditional on the ceasefire holding and conflict not escalating to involve Gulf oil infrastructure more directly. Recoveries are projected across all EMDE regions in 2027–28, but the pace will depend heavily on policy buffers — many of which were depleted fighting the post-pandemic inflation.
The upside scenario, acknowledged in the World Bank report, involves broader AI adoption lifting productivity and economic activity. Estimates of the productivity impact of AI vary “widely,” and the report notes that different scenarios “could lead to markedly different growth paths.” The AI tailwind is real but front-loaded in advanced economies, and access to the technology in lower-income countries remains constrained by infrastructure gaps and digital divides.
Discover more from The Economy
Subscribe to get the latest posts sent to your email.
China’s May 2026 data shows high-tech manufacturing up 15.1% while property investment fell 16.2%. How Beijing’s export-led gamble is reshaping global supply chains.
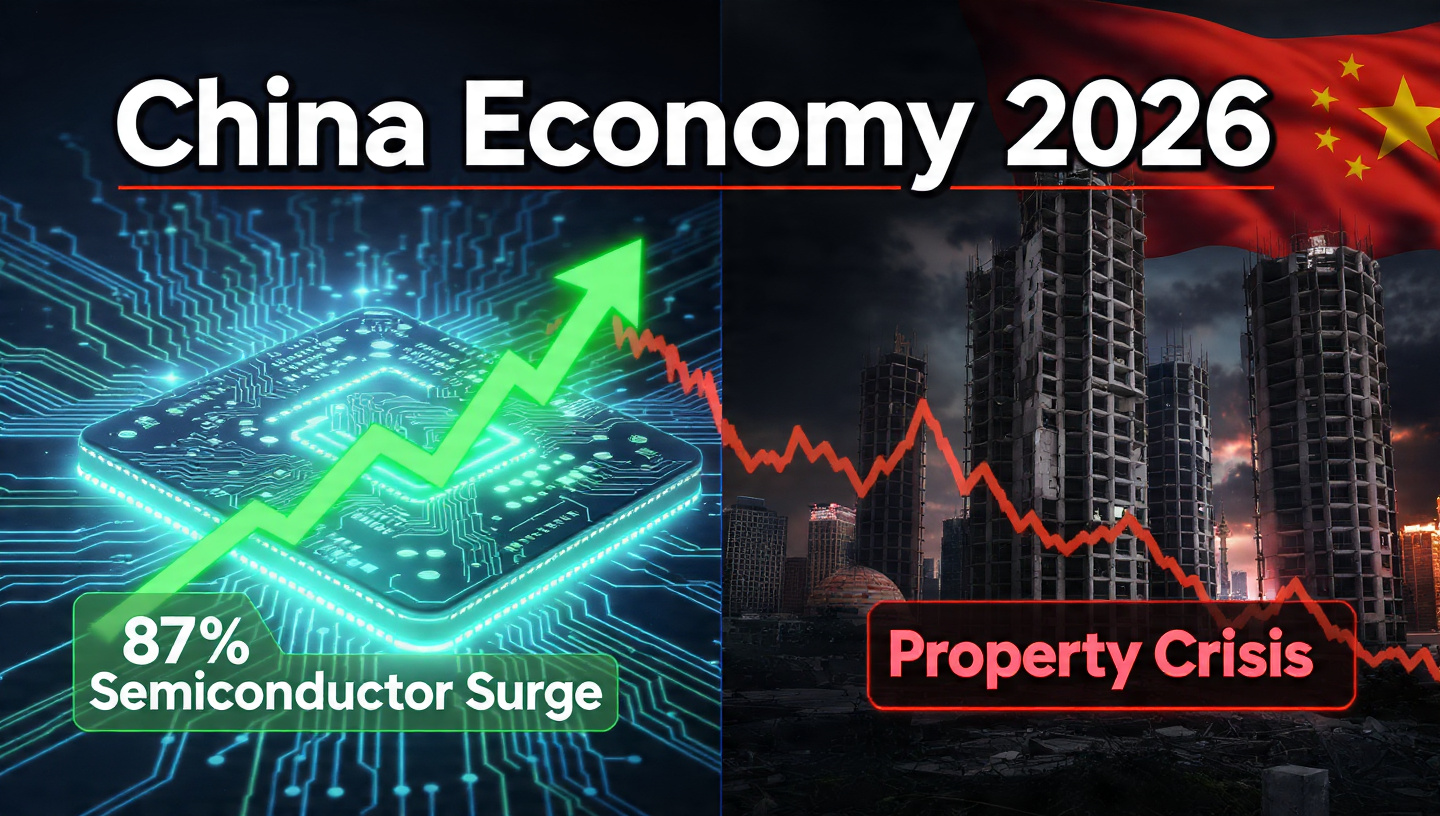
The National Bureau of Statistics’ May 2026 release confirmed what economists had begun calling China’s “industrial divergence.” Scale-above industrial value-added output grew 4.5% year-on-year in May, accelerating 0.4 percentage points from April, with high-tech manufacturing surging 15.1%. The semiconductor sector was the standout: domestic output jumped 87% from the prior year, while China’s exports of semiconductors were up 110% from a year earlier, exports of mobile phones climbed 44%, and automatic data-processing machines rose 66%.
The Export Engine Running at Full Throttle
China‘s May exports (denominated in US dollars) were up 19.6% from a year earlier — the second biggest monthly increase since January 2022. The first two months of 2026 had registered an extraordinary 39.6% gain. Over all of 2025, China recorded a trade surplus exceeding $1.2 trillion — the largest ever posted by any country — as manufactured goods, particularly in advanced technology categories, poured into global markets.
The strength carries a double driver. First, the global AI boom has generated extraordinary demand for semiconductors and related hardware, where China‘s manufacturing base has rapidly scaled. Second, as domestic demand softened, manufacturers redirected capacity toward export markets. Gary Ng, senior Asia Pacific economist at Natixis, characterised this as the operative dynamic: “China’s exports have decelerated as the Iran war starts to affect global demand and supply chains,” though he noted the moderation was from record levels.
China’s economy in mid-2026 resembles a dual exposure photograph — one frame showing a technology powerhouse outpacing global rivals, the other depicting a property market in structural retreat that is slowly draining household wealth.
Goldman Sachs had projected 5–6% annual growth in China’s exports and raised its 2026 real GDP forecast to 4.8% — above both IMF projections and Bloomberg consensus. That upgrade rested on the observation that Chinese exports demonstrated resilience even against elevated US tariffs that hit 100% in April 2025 before settling at 30% in May following a bilateral agreement. Chinese exports of chips, semiconductors, autos, and auto parts continued to expand despite the tariff headwinds.
The Property Hole That Will Not Close
The other side of the ledger is less encouraging. In the first five months of 2026, fixed-asset investment fell 4.1% year-on-year — the steepest decline since May 2020. Within that, property investment dropped 16.2%. Given that roughly two-thirds of Chinese household wealth is held in real estate, the wealth destruction is persistent and consequential. Consumers saving to restore depleted balance sheets rather than spending is the logical response — and it explains why domestic retail demand has been chronically soft despite headline economic growth of 5% in 2025.
The Economist Intelligence Unit’s Nick Marro captured the strategic bet underlying Beijing’s trajectory: “There’s a strong emphasis on doubling down on manufacturing and ensuring that China’s competitive positioning in global supply chains remains sticky.” China‘s 15th Five-Year Plan (2026–2030), approved in late 2025, explicitly prioritises advanced manufacturing, semiconductors, AI, renewable energy, and digital infrastructure — doubling down on supply-side transformation rather than demand-side stimulus.
The Global Spillover: China Shock 2.0
The US-China Economic and Security Review Commission flagged a “14 percent surge in China Shock 2.0,” noting that developing markets are bearing the brunt of an export deluge driven by China’s market distortions. Unlike the original China Shock of the 2000s — which displaced labour-intensive, low-value manufacturing in rich economies — China Shock 2.0 is crowding out high-tech, high-value manufacturing in Europe and Japan. Goldman Sachs estimates that for every 1 percentage point of export-driven boost to Chinese GDP, other economies may see a 0.1 to 0.3 percentage point drag, with tech-intensive producers facing acute pressure.
Meanwhile, China’s voracious appetite for advanced chips it cannot yet manufacture domestically has produced a paradox: China imported a record $135 billion in semiconductors in the most recent quarter as AI investment accelerates. The country remains dependent on foreign-made advanced logic chips dominated by ASML, creating a structural vulnerability that its Five-Year Plan is designed to remedy — but may not resolve within this decade.
The Endgame of the Xi Gamble
The Economist captured the existential dimension of Beijing‘s strategy by quoting Johns Hopkins University‘s Yuen Yuen: “At no time in modern history has a large country gone all in on investment in high-end technology while also navigating a slowing economy and a local-government debt crisis.” Xi Jinping’s wager is that the technology-driven growth model scales faster than the old property-and-construction model collapses. The data through mid-2026 suggest the race is closer than Beijing’s official narrative acknowledges.
China’s GDP growth target for 2026 is the lowest since 1991 at 4.5–5%. Meeting it will depend on whether AI and green technology exports can sustain momentum against an Iran-related global slowdown that is already beginning to weigh on overall demand. The outcome will shape global trade balances, supply chain geography, and the AI chip economy for the next decade.
Discover more from The Economy
Subscribe to get the latest posts sent to your email.

AI Infrastructure Debt Bubble 2026: $570 Billion in Global Debt Issuance Raises Systemic Risk Alarm

Argentina Economy 2026: Milei’s Fiscal Surplus, Inflation Drop to 29%, and What Comes Next

Global Economic Growth 2026: World Bank Cuts Forecast to 2.5%

Gold Price 2026: J.P. Morgan Forecasts $6,000/oz as Inflation, Iran War

US Section 301 Tariffs 2026: 60 Countries Face 12.5% Duties on Forced Labour Goods

China Economy 2026: 87% Semiconductor Surge, Property Crisis

Kevin Warsh Fed 2026: Rate Hold, Hawkish Dot Plot, and the End of Forward Guidance

SpaceX IPO 2026: $2 Trillion Valuation, Retail Frenzy, and the Risks

Oracle AI Debt Crisis 2026: $130 Billion Gamble Triggers Worst Stock Crash Since Dot-Com Bust

Male Labor Force Participation Rate 2026: Why Men Are Leaving & Economic Impact

Trump Tariffs 2026: Economic Impact, Household Costs & Trade War Outlook

China Economy 2026: Export Boom Masks Property Crisis & Investment Slump

US Inflation 4% May 2026: Is the Worst Over? Fed, Oil Prices

AI Memory Chip Shortage 2026: Nvidia, Apple & What Comes Next

PwC China Partner Payouts Cut Amid Evergrande Audit Fraud

Broadcom Market Value Loss: Revenue Forecast Disappoints

Investors Pile Into Bullish Dollar Bets as ‘US Exceptionalism’ Trade Returns

Here’s How Much It’ll Cost You to Be Part of SpaceX’s Record-Breaking $75 Billion IPO

Nasdaq Tumbles 4% as Chip and Memory Stocks Sink: A $1.2 Trillion Wipeout

How to Fix Pakistan’s Debt Economy: A Structural Blueprint

Smash Capital Leads $200M Funding for Allen Control Systems

Democrats Draw a Red Line Around Military AI — And the Pentagon Is Already Pushing Back

New Investment Super-Cycle: AI, Green Energy & Re-Shoring

Grinding the Already Ground: Pakistan’s Inflation Crisis

Xponential Fitness Franchise Lawsuit: The $3.97M Judgment

Middle East Conflict Oil Prices: The $4 Surge Explained

The End of the Chatbot: Why OpenAI is Tearing Up Its Most Successful Product

Musk’s SpaceX Lines Up Retail Investors for Record IPO Allocation
-

 Markets & Finance6 months ago
Top 15 Stocks for Investment in 2026 in PSX: Your Complete Guide to Pakistan’s Best Investment Opportunities
-

 Analysis4 months ago
Top 10 Stocks for Investment in PSX for Quick Returns in 2026
-

 Analysis5 months ago
Brazil’s Rare Earth Race: US, EU, and China Compete for Critical Minerals as Tensions Rise
-

 Analysis4 months ago
Johor’s Investment Boom: The Hidden Costs Behind Malaysia’s Most Ambitious Economic Surge
-

 Banks5 months ago
Best Investments in Pakistan 2026: Top 10 Low-Price Shares and Long-Term Picks for the PSX
-

 Investment6 months ago
Top 10 Mutual Fund Managers in Pakistan for Investment in 2026: A Comprehensive Guide for Optimal Returns
-

 Global Economy6 months ago
15 Most Lucrative Sectors for Investment in Pakistan: A 2025 Data-Driven Analysis
-

 Global Economy6 months ago
Pakistan’s Export Goldmine: 10 Game-Changing Markets Where Pakistani Businesses Are Winning Big in 2025