
Analysis
Iran War Brings Fuel Risk to Indonesia Ahead of Eid Travel Surge

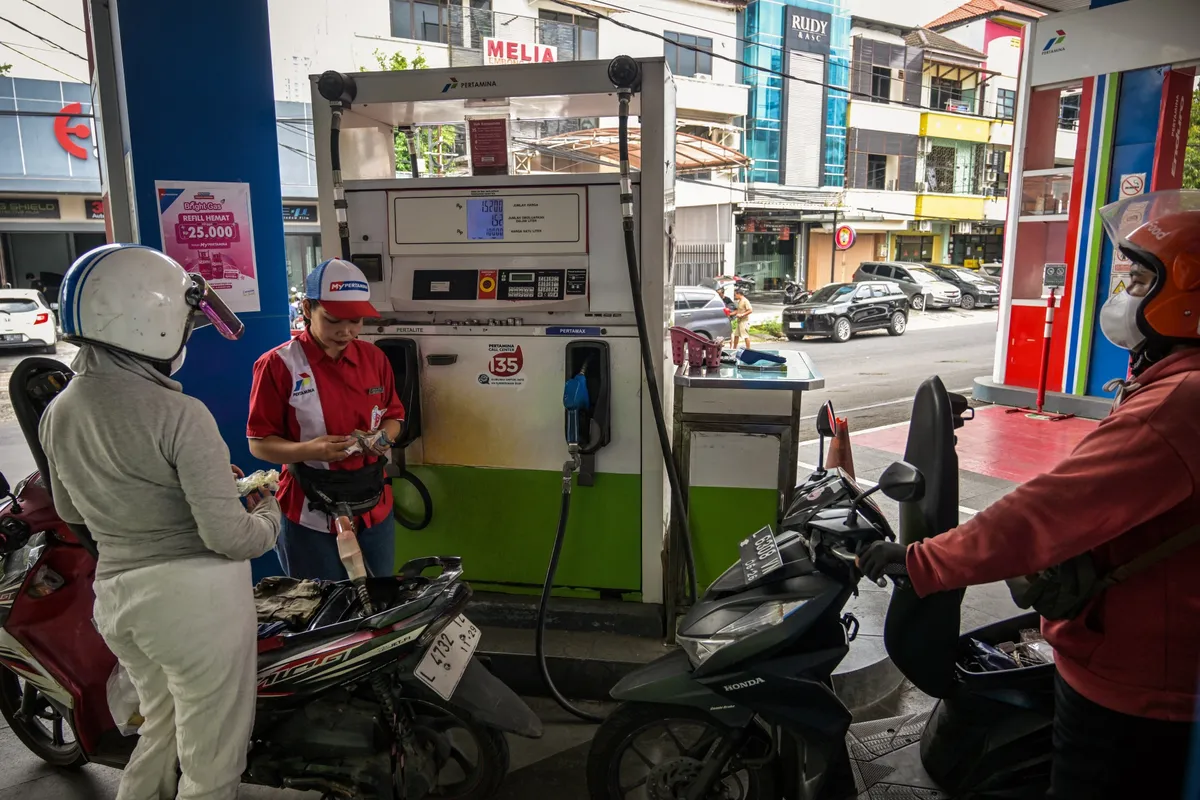
As Brent crude climbs above $85 a barrel and the Strait of Hormuz trembles under the weight of geopolitical crisis, Southeast Asia’s largest economy is walking a tightrope — and 100 million travellers are about to test it.
The Road Home, and the Price of Getting There
Every year, in the days before Eid Al-Fitr, Indonesia undergoes a transformation that has no real parallel anywhere on earth. Highways seize up from Surabaya to Semarang. Ferries groan under the weight of motorbikes strapped three-deep to their decks. Buses depart Jakarta at midnight, headlights cutting through diesel haze, carrying families back to villages they left for the city a generation ago. The mudik — the great homeward migration — is less a logistical event than a national act of faith: the moment when modern, urbanised Indonesia briefly remembers where it came from.
This year, that journey carries an unfamiliar undercurrent of anxiety. As Eid Al-Fitr falls on 20–21 March 2026, the Iran war and the attendant turbulence in global energy markets have transformed what is normally a question of traffic management into a test of macroeconomic resilience. The question hanging over Jakarta’s ministries is no longer simply whether the roads can handle the load — it is whether the fuel can.
Iran War Fuel Risk Indonesia: The Supply Chain Under Siege
The arithmetic of Indonesia’s exposure to the Iran-Israel-US conflict is stark. Historically, roughly a quarter of the country’s crude oil imports and approximately 30 percent of its liquefied petroleum gas have transited the Strait of Hormuz — the narrow, strategically irreplaceable chokepoint between Oman and Iran through which some 20 percent of global crude and gas supply ordinarily flows. With hostilities now disrupting that corridor, Brent crude has breached $85 per barrel for the first time since July 2024, and analysts at Goldman Sachs and elsewhere are openly modelling scenarios in which sustained Hormuz disruptions push prices above $100.
For a country that imports more petroleum products than any of its Southeast Asian neighbours — and that subsidises those products for a population of 280 million — this is not an abstract commodity-market fluctuation. It is a direct fiscal threat arriving at the worst conceivable moment on the domestic calendar.
State energy company Pertamina has moved quickly to diversify supply routes, accelerating a shift toward US crude purchases under the framework of a newly announced $15 billion bilateral energy agreement with Washington. The company has also offered discounts on aviation turbine fuel (avtur) to keep airline ticket prices from spiking ahead of the holiday. But industry insiders acknowledge that reserve buffers are tighter than public communications suggest, and that the pivot to American supply — while strategically sensible in the medium term — cannot be executed instantaneously at the volumes required.
Fuel Prices Indonesia Eid Al-Fitr 2026: The Demand Spike That Cannot Be Deferred
Indonesia’s fuel demand typically surges 30 percent or more in the regions through which mudik traffic flows — Java’s north coast road, the Trans-Sumatran Highway, the arteries feeding Bali’s ferry terminals — in the week surrounding Eid. LPG demand climbs sharply in parallel, as tens of millions of families prepare festive meals in villages where cooking-gas cylinders are the primary heat source and where informal supply chains are already stressed.
This cyclical demand surge has historically been manageable. Pertamina pre-positions stocks. The government calibrates subsidised fuel distribution. The system creaks, but it holds. What changes the calculus in 2026 is the compounding of domestic demand pressure with a global supply shock of unusual severity. The prolonged energy market impact of the Iran conflict — unlike previous Gulf crises, which were resolved or contained within weeks — shows no imminent sign of resolution. Shipping insurers have raised war-risk premiums on tanker routes through the Gulf of Oman. Several major trading houses have quietly rerouted cargoes. The market is pricing in duration, not a spike.
For Indonesia, the timing could scarcely be worse. The mudik demand surge is not deferrable. It arrives on a fixed schedule, indifferent to geopolitics.
Prabowo Fuel Subsidies: A Budget Under Existential Pressure
The government’s formal fiscal response has been to expand the subsidy envelope. Finance Minister Sri Mulyani Indrawati and Energy and Mineral Resources Minister Bahlil Lahadalia have sanctioned a fuel and energy subsidy allocation of approximately Rp381 trillion — equivalent to roughly $22.6 billion at current exchange rates — a figure that was already politically contentious before Brent moved above $85. If crude sustains current levels or rises further, the actual cost of honouring that commitment at current pump prices will balloon beyond the budgeted envelope, forcing either a mid-year supplementary budget, a drawdown of fiscal reserves, or — the option the Prabowo administration has categorically ruled out ahead of Eid — a price increase passed to consumers.
President Prabowo Subianto, who took office in October 2024 inheriting an economy navigating a complex post-pandemic fiscal consolidation, has staked considerable political capital on stability messaging. His administration has publicly committed to no retail fuel price increases through the holiday period and has launched public reassurance campaigns emphasising supply security. Prabowo himself has called on citizens to practise fuel-saving behaviours — a request with limited practical resonance for the family loading a motorbike with luggage at 3am for a 12-hour journey to Central Java.
The concern among analysts is not that the government’s immediate commitment is insincere. It is that the structural mismatch between subsidy arithmetic and crude-price reality is being papered over rather than addressed.
“Calm Without Concrete Solutions”: The Analyst Warning
Few observers have articulated this concern more precisely than Bhima Yudhistira Adhinegara, Executive Director of the Center of Economic and Law Studies (CELIOS) in Jakarta. “The government is asking the public to remain calm without presenting concrete solutions,” Bhima said in recent days. “This is highly risky, especially ahead of Eid Al-Fitr, when consumption typically rises.”
The critique cuts to a structural tension in Indonesian energy policy that predates Prabowo. Subsidised fuel prices are politically sacrosanct — any government that raises them ahead of a major holiday, or in the immediate aftermath of one, risks the kind of street-level anger that has complicated Indonesian politics since the reformasi era. But the fiscal cost of suppressing prices in a sustained high-crude environment is equally unsustainable. The IMF has repeatedly flagged Indonesia’s subsidy burden as a drag on the productive investment its growth ambitions require.
Across Southeast Asia, governments have responded to the oil-price surge with a patchwork of demand-management and price-cap measures — Malaysia has introduced targeted consumption limits for commercial users, Thailand has reinstated a temporary fuel price cap, and the Philippines has signalled a review of its automatic price-adjustment mechanism. Indonesia’s approach — absorb costs, reassure the public, defer difficult decisions — is not unique in the region, but it carries heightened risk given the scale of the subsidy commitment and the breadth of the domestic demand event it must now bridge.
Indonesia Oil Imports Strait of Hormuz: Shifting the Supply Map
There is a longer strategic story embedded in the immediate crisis. Indonesia’s accelerated pivot toward US crude purchases — partly driven by Washington’s own interest in cementing the $15 billion energy framework as a geopolitical counterweight to Chinese influence in the archipelago — represents a meaningful, if painful, diversification of import geography. Pertamina’s procurement teams are reportedly in active discussions with US Gulf Coast exporters and West African producers to expand non-Hormuz supply lines.
This is the right direction. But energy supply chain reconfiguration is measured in quarters and years, not days. For the purposes of the Eid surge beginning this week, Indonesia’s import exposure to Hormuz-adjacent disruption remains materially significant. The shipping lead times involved in rerouting US cargoes — longer voyages, higher freight costs, different refinery configurations — mean that the buffer between current physical inventory levels and a genuine shortage scenario is narrower than official statements imply.
The fiscal squeeze is compounded by currency pressure. The rupiah has been under persistent downward pressure throughout early 2026 — a function of global risk-off sentiment, capital outflows from emerging markets, and Indonesia-specific concerns about fiscal discipline. A weaker rupiah directly inflates the local-currency cost of dollar-denominated crude imports, creating a negative feedback loop between currency depreciation and the subsidy bill: as the rupiah falls, the cost of maintaining fixed domestic fuel prices rises, which widens the fiscal deficit, which pressures the rupiah further.
Prabowo’s Growth Gamble and the Subsidy Math
The deepest tension in Indonesia’s current predicament is not the Eid surge itself — it is the collision between the subsidy commitment and Prabowo’s signature economic ambition. The president has set a target of 8 percent annual GDP growth, a level Indonesia has not sustained since the Suharto era and one that presupposes a dramatic acceleration of productive investment, infrastructure spending, and industrial policy. The fiscal arithmetic of that ambition requires a leaner, better-targeted subsidy regime, not an expanded one.
Every additional trillion rupiah committed to fuel subsidies under crisis conditions is a trillion rupiah not available for the downstream industrial diversification, port infrastructure, or education investment that Prabowo’s growth model nominally requires. Sri Mulyani — widely regarded as the anchor of fiscal credibility in the cabinet — has worked hard to maintain Indonesia’s 3 percent deficit cap, a constraint that is now visibly strained by the combination of falling commodity revenues (nickel and palm oil export prices have softened) and rising import costs.
The political economy is equally fraught. Prabowo entered office with strong popular approval but has since navigated significant turbulence: student-led protests over democratic backsliding concerns, anxiety in markets about the coherence of his economic team, and now an external shock that strikes directly at the daily cost of living for ordinary Indonesians. The mudik is not merely a logistical event — it is a moment of national emotional and political temperature-taking. Fuel queues or price spikes during the homeward journey would land with particular symbolic force.
Beyond the Holiday: Energy Transition as the Only Durable Hedge
There is, ultimately, an irony in Indonesia’s predicament that its policymakers are not unaware of. The country sits on extraordinary renewable energy potential — geothermal reserves second only to the United States, solar irradiance across the equatorial archipelago, hydropower capacity in Kalimantan and Papua that remains largely untapped. A serious long-term hedge against Hormuz-style supply shocks is not a cleverer procurement strategy for crude oil; it is the accelerated electrification of transport and cooking — precisely the transition that $22.6 billion in annual fossil fuel subsidies structurally delays.
Every year that the subsidy regime absorbs a crisis of this kind and survives — narrowly, expensively, through improvisation rather than structural reform — is a year in which the case for energy transition grows stronger in the technocratic ministries and weaker in the political calculus. Eid will pass. The mudik will happen, probably without a catastrophic fuel crisis, because Indonesian governments have long experience of managing this event and because the commitment to price stability ahead of the holiday is politically non-negotiable. The crude price may ease. The immediate danger will subside.
But the structural exposure will remain. And the next Hormuz crisis — or the next rupiah slide, or the next commodity downturn that squeezes fiscal space precisely when a demand shock requires its expansion — will find Indonesia in the same position: a large, subsidy-dependent importer with ambitious growth targets, navigating an energy system whose architecture was designed for a different era.
For the family loading the motorbike in the predawn darkness of South Jakarta this week, none of that is the immediate concern. The pump is open; the price, for now, holds; the road awaits. But for the economists watching the budget spreadsheets, and for a president who has staked his legacy on 1990s-style growth in a 2020s world, the Iran war has illuminated something that neither reassuring press conferences nor expanded subsidy lines can fully obscure: Indonesia’s energy vulnerability is not a crisis to be managed. It is a structural condition to be transformed.
FAQ: Iran War Fuel Risk and Indonesia’s Eid 2026
How does the Iran war affect Indonesia’s Eid travel fuel prices? The conflict has disrupted Hormuz transit routes for roughly a quarter of Indonesia’s crude and 30 percent of its LPG imports, pushing Brent crude above $85/bbl. The government has committed to holding pump prices stable through Eid, absorbing the difference via expanded subsidies — but the fiscal cost is significant and growing.
Will there be a fuel shortage in Indonesia during Eid Al-Fitr 2026? The government and Pertamina say no, citing pre-positioned stocks and new US supply agreements. Independent analysts are less categorical, noting that reserve buffers are tighter than official messaging suggests and that the supply-chain pivot to non-Hormuz sources cannot be completed at the required scale before the holiday.
What is Indonesia’s total fuel subsidy budget for 2026? The government has allocated approximately Rp381 trillion (around $22.6 billion) for fuel and energy subsidies. At current crude prices, sustaining domestic price controls through a prolonged high-oil environment would likely require supplementary budget measures.
How is Prabowo Subianto’s government responding to the oil price surge? The administration has ruled out pre-Eid price increases, expanded the subsidy envelope, initiated a supply diversification toward US crude, and launched public messaging campaigns emphasising stability. Critics argue the approach manages optics without addressing structural exposure.
Could the Iran war derail Indonesia’s 8 percent growth target? Sustained high oil prices would widen the current account deficit, pressure the rupiah, inflate the subsidy bill, and crowd out the productive investment spending the growth target requires. Most analysts regard 8 percent growth as aspirational under current conditions; an extended energy crisis would make it arithmetically improbable.
Discover more from The Economy
Subscribe to get the latest posts sent to your email.



Key Takeaways
- Rolex’s secondary market rose approximately 7.9% year-over-year as of 2026 (per WatchCharts data) — trailing Patek Philippe (+16.2%) and Tudor (+11.4%) but still outperforming Audemars Piguet (+3.4%).
- Rolex raised U.S. retail prices 4–9% in January 2026 (steel models ~5.6%, gold models ~8.7%), narrowing the historical gap between retail and pre-owned pricing.
- Not every model appreciates: steel sports references (Submariner, GMT-Master II, Daytona) have held value far better than two-tone or widely available dress references like the standard Datejust.
- The Lady-Datejust posted the sharpest 2026 gain among tracked collections — up 22.73%, from roughly $9,269 to $11,376 — driven by demand for smaller, “everyday luxury” watches.
- Gold’s rise past $2,400/oz has directly lifted the investment case for Rolex’s precious-metal references (Day-Date, Sky-Dweller, Yacht-Master).
The Model-by-Model Picture
| Category | 2026 Trend |
|---|---|
| Lady-Datejust | +22.73% (strongest performer among tracked collections) |
| Steel sports models (Submariner, GMT-Master II) | Held value well; corrected from 2022 peak but stabilized above retail |
| Daytona | Corrected from highs above $50,000 to the mid-$30,000s; still among the most sought-after references |
| Two-tone/widely available Datejust | Flat to negative — “holds value” is an overstatement for this category |
| Gold references (Day-Date, Sky-Dweller) | Lifted by gold’s rise above $2,400/oz |
Why the “Rolex Always Appreciates” Myth Is Fading
The pandemic-era boom pushed some references — the Daytona above all — to speculative highs disconnected from historical norms. Since the March 2022 peak, steel sports models have compressed meaningfully, and dealers who bought inventory near the top have in some cases faced 20–40% markdowns on liquidation. The lesson for 2026 buyers: Rolex as a category is not a monolith. Value retention depends heavily on specific reference, condition, and whether the piece comes with box and papers (“full set”).
What’s Actually Driving 2026 Strength
- Retail price increases raise the floor. When a new Submariner retails at $10,050 (up from $9,500), a pre-owned example at $11,000–$12,000 suddenly represents a smaller premium — narrowing the gap without secondary prices actually moving.
- Supply discipline remains Rolex’s core lever. The brand has never confirmed production numbers, and secondary-market premiums remain entirely a function of Rolex’s own manufacturing decisions — a risk factor as much as a support.
- Certified Pre-Owned rollout. Rolex’s now fully rolled-out CPO program has changed how buyers transact in the used market, adding a layer of brand-verified legitimacy that supports pricing.
The Case for Rolex as a Portfolio Diversifier
Financial advisors increasingly frame luxury watches not as a replacement for equities or bonds, but as a tangible, historically low-correlation diversifier — one that carries its own risks (illiquidity, condition-dependent pricing, no yield) but has demonstrated multi-decade resilience for specific references.
Is Rolex a good investment in 2026?
It depends heavily on the specific reference. Steel sports models like the Submariner and Daytona have held or grown in value; two-tone and widely available dress models generally have not. Overall, Rolex’s secondary market rose about 7.9% year-over-year in 2026, trailing Patek Philippe but ahead of Audemars Piguet.
Discover more from The Economy
Subscribe to get the latest posts sent to your email.

Navigating Mortgage and Loan Refinancing in a High-Yield Environment
Global public debt crossing critical thresholds has kept central bank policies volatile, resulting in fluctuating US Treasury yields throughout 2026. For homeowners and commercial property holders burdened by previous high-interest borrowing cycles, finding optimal refinance windows has become a high-stakes financial puzzle. Stalled disinflation and stubborn employment numbers mean rate cuts are incremental, requiring borrowers to act with precision.
Timing your mortgage or commercial loan refinance in this environment requires a deep understanding of yield curve movements and lender risk appetites.
Decoding 2026 Refinance Dynamics
The 10-Year Treasury Yield Benchmark
Mortgage rates continue to track closely with the 10-year US Treasury yield. When macroeconomic anxiety spikes debt issuance, yields rise, tightening consumer borrowing capacity. Savvy borrowers monitor weekly Treasury auctions to lock in rates during brief dip windows.
Hybrid ARMs and Alternative Structures
With fixed rates remaining elevated, 7/1 and 10/1 adjustable-rate mortgages (ARMs) have surged in popularity. These products offer lower initial monthly payments, giving borrowers breathing room until central bank easing cycles fully materialize.
| Loan Product | Current Rate Range | Best For | Key Risk Factor |
| 30-Year Fixed Mortgage | 6.2% – 6.8% | Long-term predictability | Higher initial monthly outlay |
| 7/1 Hybrid ARM | 5.5% – 5.9% | Short-term ownership / flipping | Rate reset risk after year 7 |
| Commercial Refinance | 7.0% – 8.2% | Corporate asset restructuring | Strict DSCR lender covenants |
Actionable Steps for Successful Refinancing
To maximize your chances of securing favorable refinance terms in a volatile market, follow a disciplined preparation strategy.
Boost Your Credit Score Immediately: Lenders in 2026 are applying stringent credit tiering; a 20-point increase can drop your APR by a crucial quarter-point.
Shop Regional Credit Unions: Smaller financial institutions often offer portfolio loans with more flexible underwriting than major national banks.
Calculate the Break-Even Point: Ensure your total closing costs are recouped through monthly savings within 24 months of closing.
“Market Strategist View: Refinancing in 2026 is an exercise in opportunistic timing. Borrowers must maintain immaculate financial profiles ready to strike the moment Treasury yields dip.”
Mastering the complexities of today’s debt environment ensures you can successfully lower your debt service costs and protect your long-term financial stability.
Discover more from The Economy
Subscribe to get the latest posts sent to your email.

The days of pulling generic auto insurance quotes based purely on your zip code and age are officially over. In 2026, insurance comparison engines are powered entirely by generative AI and real-time telematics. These platforms digest thousands of live data points—ranging from your driving smoothness via connected vehicle sensors to real-time traffic congestion patterns—to generate hyper-personalized premiums instantly.
For consumers, this evolution represents both a massive opportunity for savings and a hidden trap for penalty pricing. Understanding how AI algorithms evaluate risk is essential for anyone looking to lower their monthly auto insurance premiums.
How AI Comparison Engines Evaluate Your Risk Profile
Behavioral Telematics and Connected Cars
Modern cars stream performance data directly to insurance aggregators. Generative AI models analyze braking sharpness, acceleration curves, cornering G-forces, and phone distraction metrics. Drivers who maintain smooth, defensive habits are rewarded with dynamic rate cuts of up to 40% compared to traditional rating tiers.
Predictive Traffic and Weather Modeling
AI tools now cross-reference your daily commute route with predictive weather and accident probability models. If your standard parking location or driving corridor has a statistically higher incidence of uninsured motorist claims, your quotes will reflect that hyper-local risk assessment.
| Comparison Factor | Traditional Rating Model | 2026 Generative AI Model | Impact on Premium |
| Mileage & Usage | Annual estimated odometer reading | GPS tracking & live trip duration | High (up to 35% savings) |
| Driving Behavior | MVR driving record & accidents | Real-time braking, speed, & G-force | Critical (determines tier) |
| Vehicle Tech | Make, model, and safety rating | ADAS calibration & repair cost data | Moderate |
Strategies to Lower Your AI-Driven Insurance Quote
To outsmart the algorithm and secure the lowest possible premium in 2026, drivers must proactively manage their digital footprint on insurance platforms.
Opt-In for Telematics Trial Periods: Many insurers offer immediate 15% discounts just for installing their driving app; let it track safe habits for 30 days to lock in permanent savings.
Scrub Unverified Public Records: Ensure your motor vehicle report is free of clerical errors that AI risk models misinterpret as reckless behavior.
Compare AI Aggregators: Use platforms that integrate multi-carrier API feeds rather than single-brand comparison sites to find the best risk-adjusted rate.
“Industry Note: AI-driven pricing rewards transparency and precision. Drivers who actively manage their telematics data consistently out-save those relying on legacy quote calculators.”
Embracing AI comparison tools allows savvy policyholders to customize coverage limits precisely to their driving habits, eliminating wasted premium spend while ensuring robust protection.
Discover more from The Economy
Subscribe to get the latest posts sent to your email.

Fidelity Investments Review: Maximizing Returns in a Volatile Stock Market

How Crypto Transformed the Trump Fortune: A $1.4 Billion Financial Breakdown

Global Pension Systems Ranked: The World’s Best and Worst Retirement Frameworks

Global Supply Chain Vulnerabilities: From Eurasian Trade Corridors to Food Consumer Recalls

Why 5% U.S. Treasury Yields Signal a Global Market Regime Shift.

Federal Reserve Defies White House Pressure: Inside Trump’s Demand for Sub-1% Interest Rates After Historic 2026 Rate Hike

How Rising Interest Rates Impact Gig Economy Apps: DoorDash, Uber, and Urban Services

GasBuddy Market Insights: How Crude Price Shifts Impact Local Fuel Cost Averages

DoorDash Driver Payouts, Fee Structures, and Market Competition Analysis

OPINION:Breaking the 3.5% Growth Trap: How Pakistan Can Build a High-Productivity Export Economy

Global Equity Market Divergence: US Tech vs. European Dividend Stocks vs. Asian Growth

Asian Markets Analysis: Navigating Volatility in China, Japan, and Singapore Stocks

Stagflation vs. Soft Landing: How Central Bank Rates Are Reshaping European and Asian Economies

IMF & World Bank Global Economic Outlook: Growth Forecasts Across Europe and Asia

State Farm’s $5B Dividend 2026: Who Qualifies & Payout Dates

US-China Relations in Q3 2026: Trade Tariffs and Supply Chain Risks

SpaceX Starship Flight 14: First Orbital Attempt & Starlink V3 Launch Explained

Top 30 Stocks for Investment in PSX for Massive ROI in 2026

The 2026 Crypto Regulatory Shift: What It Means for Institutional Investors

AI Chip Stocks 2026: The Best Semiconductor Investments Beyond Marvell

AI-Powered Training: The Next Multi-Billion Dollar Ecosystem in Fitness

Tween Back-to-School Trends 2026: What’s Driving the $85B Season

Oil Prices Break $100 in 2026: Middle East Conflict & Energy Markets

10-Year Treasury Yield Hits 4.80%: What It Means for Rates & Portfolios

Fidelity Investments Review 2026: SPAXX Yields & Zero-Fee Funds

Shein Clothes Quality & Safety in 2026: What Lab Tests Show

MRVL Earnings 2026: Why Marvell Sank Despite Beating Estimates

China’s US$10.8 Billion Trade Shortcut: Why the Pinglu Canal Matters
-

 Markets & Finance9 months ago
Top 15 Stocks for Investment in 2026 in PSX: Your Complete Guide to Pakistan’s Best Investment Opportunities
-

 Analysis7 months ago
Johor’s Investment Boom: The Hidden Costs Behind Malaysia’s Most Ambitious Economic Surge
-

 Analysis7 months ago
Top 10 Stocks for Investment in PSX for Quick Returns in 2026
-

 Analysis7 months ago
Brazil’s Rare Earth Race: US, EU, and China Compete for Critical Minerals as Tensions Rise
-

 Banks8 months ago
Best Investments in Pakistan 2026: Top 10 Low-Price Shares and Long-Term Picks for the PSX
-

 Investment8 months ago
Top 10 Mutual Fund Managers in Pakistan for Investment in 2026: A Comprehensive Guide for Optimal Returns
-

 Global Economy9 months ago
15 Most Lucrative Sectors for Investment in Pakistan: A 2025 Data-Driven Analysis
-

 Global Economy9 months ago
Pakistan’s Export Goldmine: 10 Game-Changing Markets Where Pakistani Businesses Are Winning Big in 2025