
Analysis
The Impact of Rising Gas Prices on Consumer Spending in 2026
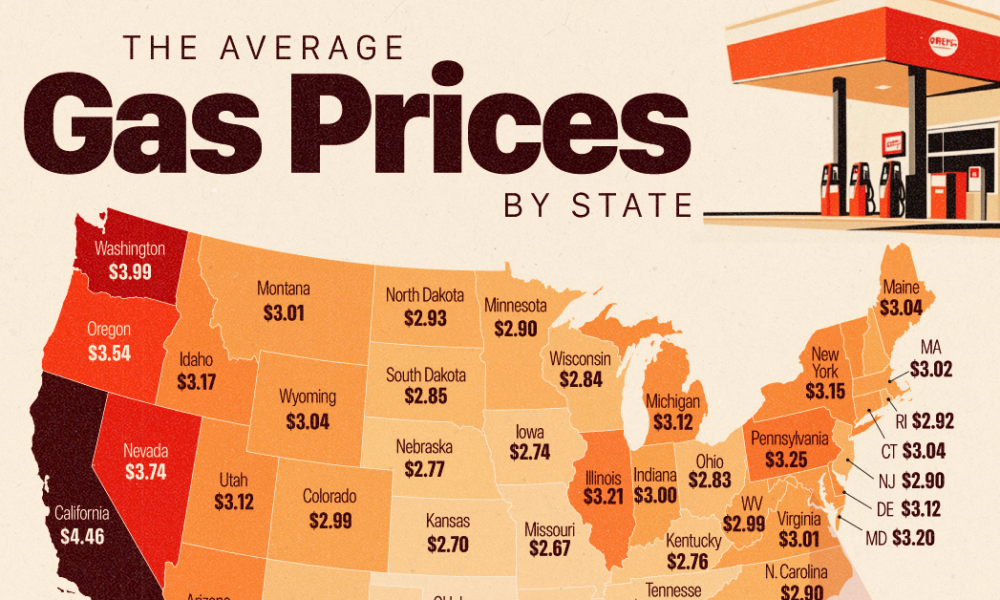
The American gas station sign is a unique psychological weapon. It is the only retail price consistently broadcast in two-foot-tall, illuminated numbers to passing motorists, demanding attention regardless of whether you actually need a fill-up. When those numbers begin a relentless upward march, the effect on the national psyche is immediate and visceral. In recent weeks, the price of regular unleaded has quietly crossed the threshold from a minor annoyance back into a structural household burden.
For the vast majority of the country, driving isn’t a choice; it is the prerequisite for participating in the economy. So, when the cost of commuting spikes, the math at the kitchen table changes abruptly. Families don’t stop driving. They stop buying everything else.
The Macro View: A Squeeze on the Margin
To grasp the current environment, we have to look at the broader economic engine. The Federal Reserve has spent the better part of the last few years attempting to engineer a soft landing, relying heavily on the legendary resilience of the American shopper. For a long time, that reliance paid off. Real wage growth had finally begun to outpace headline inflation, and household balance sheets, while bruised, were largely holding together.
Yet, the sudden surge in global crude prices has thrown a wrench into this delicate equilibrium. By early May 2026, the national average for a gallon of gasoline breached $3.85, up significantly from the winter lows. This is not just a localized spike on the West Coast; it is a nationwide phenomenon driven by tight refinery capacity and geopolitical friction in the crude markets. According to data from the US Energy Information Administration, implied gasoline demand remains stubbornly high even as prices climb, underscoring just how trapped consumers are by their daily commutes.
When you take an extra $40 to $60 out of a middle-class family’s monthly budget just to get to work, that capital has to be extracted from somewhere else. The result is a silent but severe contraction in the aisles of big-box stores.
The Core Development: Trimming the Fat
To understand the true impact of rising gas prices on consumer spending, you have to look at what disappears from the shopping cart first. Americans are not cutting back on groceries or generic medications. Instead, they are quietly abandoning the discretionary purchases that drive high-margin retail growth.
The latest advance monthly retail trade report from the US Census Bureau paints a stark picture of this substitution effect. While overall retail sales figures might appear nominally flat, the underlying composition has fractured. Spending at electronics and appliance stores has contracted, and apparel retailers are reporting unexpected dips in foot traffic. Big-ticket items—patio furniture, high-end electronics, and major appliances—are sitting idle in warehouses.
Consider the reality of a household earning $75,000 a year. If their monthly fuel expenditure increases by 15 percent, they don’t default on their mortgage. They simply cancel the weekend trip to the mall, delay replacing an aging laptop, and trade down from premium brands to private-label alternatives.
This behavioral shift is already manifesting in corporate boardrooms. Retail giants are flashing warning signs about the health of the lower-income consumer. When Doug McMillon and other retail chief executives discuss “wallet share,” they are explicitly talking about the invisible tax levied by the gas pump. Every extra dollar spent on energy is a dollar permanently removed from the retail ecosystem. Retailers are now scrambling to adjust inventory management strategies, deeply discounting non-essential goods to clear shelf space before the crucial back-to-school season.
Still, the cutbacks are highly stratified. The top 20 percent of earners, insulated by stock market gains and fixed-rate mortgages, hardly notice a 40-cent jump at the pump. For the bottom half of the income distribution, however, the spike acts as an immediate, regressive tax.
Analytical Layer: The Economics of the Pump
Why does a relatively small macroeconomic shift in petroleum markets cause such outsized ripples in retail? It comes down to the mechanics of price elasticity.
How do rising gas prices affect consumer spending? When gas prices rise, consumer spending on discretionary goods drops because fuel is an inelastic necessity. Households immediately divert cash from electronics, dining out, and apparel to cover the higher cost of commuting, effectively acting as a regressive tax on middle- and lower-income budgets.
This inelasticity forces an immediate reallocation of resources. Unlike a slow increase in rent or a gradual rise in health insurance premiums, gas prices are volatile and instantly realized. You pay for it right there at the pump, often twice a week.
This creates a unique phenomenon known to behavioral economists as the “gas station effect.” The psychological weight of paying more to fill a tank sours consumer confidence far more effectively than abstract economic data. The University of Michigan’s Surveys of Consumers routinely shows a direct, inverse correlation between pump prices and near-term economic optimism. When people feel poorer at the pump, they act poorer at the store, regardless of what their actual bank balance says.
What follows, however, is a dangerous feedback loop. As consumers pull back on discretionary spending, retail margins compress. Stores order fewer goods, which slows down manufacturing and logistics. The irony is that the very inflation driven by energy costs eventually causes deflation in consumer goods, simply because nobody has the spare cash to buy a new television.
We saw identical mechanics during the fuel shocks of 2008 and the inflation peak of 2022. The difference today is the exhaustion of the consumer buffer. During previous spikes, households either had access to cheap credit or pandemic-era savings. Today, credit card interest rates are punishingly high, and excess savings have largely evaporated. The American consumer is navigating this price shock without a safety net, meaning the translation from higher gas prices to lower retail sales is faster and more brutal than it has been in a decade.
Implications & Second-Order Effects: The Ripple Through the Economy
The downstream consequences of this shift extend far beyond a bad quarter for apparel brands. The most immediate casualty is corporate profit margins.
For the past three years, companies have successfully passed increased costs onto the consumer, protecting their margins under the guise of broad inflation. That era is definitively over. Consumers have hit a wall. When input costs rise—often driven by the same diesel prices that are making unleaded gasoline expensive—companies can no longer risk raising the final retail price. They are forced to absorb the hit.
This dynamic is creating a headache for policymakers in Washington. The Federal Reserve explicitly focuses on “core inflation,” which strips out volatile food and energy prices to gauge the underlying trend of the economy. But you cannot neatly separate energy from the rest of the economy. Energy is in everything. It is in the plastic used for packaging, the fertilizer used for crops, and the diesel burned by the trucks delivering goods to fulfillment centers.
When energy prices remain elevated, they inevitably bleed into core inflation via logistics and freight surcharges. The Bureau of Labor Statistics’ Consumer Price Index has begun to reflect this sticky reality. Even as goods deflation provides some relief, the cost of moving those goods is preventing inflation from cleanly returning to the Fed’s two percent target.
This places the central bank in a terrible bind. If they keep interest rates high to cool the broader economy, they punish the exact same debt-burdened consumers who are already struggling with $4 gas. If they cut rates prematurely, they risk triggering a resurgence in demand that could push commodity prices even higher.
Furthermore, the squeeze on the consumer wallet is reshaping the credit landscape. Delinquency rates on auto loans and credit cards have been slowly creeping up. Families are increasingly using revolving credit not to finance vacations, but to bridge the gap between their paychecks and their basic living expenses. When a tank of gas goes on a credit card carrying a 24 percent annual percentage rate, the financial fragility of the household compounds rapidly.
Competing Perspectives: Are We Misreading the Consumer?
That said, the narrative of the broken American consumer is not universally accepted. A vocal contingent of economists argues that we are misinterpreting the data.
The counterargument suggests that Americans aren’t actually cutting back because they are impoverished by the gas pump; they are simply normalizing their consumption patterns after a historic, pandemic-fueled binge on physical goods.
From this vantage point, the decline in retail sales for electronics and furniture is a natural reversion to the mean. People simply do not need another couch or a third laptop. Instead of retreating, this theory posits that consumers are merely rotating their capital into the “experiences economy.”
There is compelling data to support this view. Despite the pain at the pump, spending on travel, live entertainment, and dining out has shown remarkable resilience. The Bureau of Economic Analysis data on personal consumption expenditures consistently highlights that services spending is holding the economy aloft. If consumers were truly tapped out by gasoline costs, the argument goes, TSA checkpoints wouldn’t be seeing record foot traffic, and Taylor Swift tickets wouldn’t be trading for astronomical premiums.
Energy analysts, including voices like Amrita Sen, point out that gasoline demand itself hasn’t cratered the way it would in a true recessionary environment. If things were truly dire, vehicle miles traveled would plummet. Instead, people are gritting their teeth, paying the price, and finding the money by skipping the local department store.
This perspective frames the current dynamic not as a systemic failure, but as a healthy, albeit painful, rebalancing. Goods inflation is cooling because demand is cooling, and the money being spent on gas is simply money that would have otherwise overheated the retail sector. It is a harsh mechanism, but perhaps a necessary one to drain excess liquidity from the system.
The Final Tally
The picture is more complicated than a simple binary of a thriving or dying middle class. The American consumer is a highly adaptive engine, capable of absorbing tremendous friction before stalling out entirely.
Yet, adaptation has its limits. The reallocation of household capital from discretionary goods to unavoidable energy costs is a zero-sum game for the broader retail economy. The resilience of the services sector may mask the pain temporarily, but the fundamental math remains unchanged: every dollar captured by the gas pump is a dollar denied to the rest of the marketplace.
As we move deeper into the summer driving season, the tension between wages and pump prices will only intensify. Policymakers and retail executives alike would do well to remember that while the American shopper rarely quits completely, they are entirely capable of going on a silent, localized strike. The flashing numbers on the corner gas station sign will dictate exactly when that strike begins.
Discover more from The Economy
Subscribe to get the latest posts sent to your email.


South Korea’s won has not traded at these levels since Lehman Brothers collapsed and the world was sorting through the wreckage of its worst financial crisis in eighty years. That the currency has returned to those depths under entirely different circumstances — not a global credit event, but a sustained combination of dollar strength, political uncertainty, and structural capital outflows — makes the current episode more complex, and in some ways more concerning, than 2009.
The Numbers
On July 1, 2026, the won declined as much as 0.6 percent to 1,559.10 per dollar, following a prior session low of 1,562.20 — a level last seen in March 2009. Overseas investors sold a net 1.46 trillion won ($938 million) of stocks in the Kospi index on a single trading day, marking the eighth consecutive session of equity outflows from the Korean market.
“The dollar’s strength is such that a fresh low for the won would not be surprising,” said Moon Dawoon, an economist at Korea Investment & Securities. “If it does break through, it will be difficult to identify the next technical level, so from a qualitative perspective, the downside for the won should be kept open to around 1,600 per dollar.”
A breach of 1,600 would represent territory not visited since the 1997 Asian financial crisis — a threshold that carries both technical and psychological significance for regional currency markets.
Why the Won Is Falling
The 2026 won story is not a simple export slump. South Korea continues to run a current-account surplus — $18.70 billion in December 2025, $13.26 billion in January 2026. The fundamentals of the trade balance have not deteriorated dramatically. What has changed is the capital account.
Several forces are pulling simultaneously in the wrong direction. The US-Korea interest rate differential remains wide, making dollar-denominated assets relatively attractive to Korean investors. Structural outward investment — Korean residents and institutions consistently moving capital into foreign assets — keeps upward pressure on dollar demand. Trade friction and tariff uncertainty from the United States raise risk premia on Korean assets broadly. And geopolitical stress in the Middle East has driven a risk-off flight to dollar safety that penalises emerging market currencies disproportionately.
The IMF estimated Korea’s growth at 0.9 percent in 2025, with a projected rebound to 1.8 percent in 2026 — an improvement, but well below Korea’s historical growth trajectory. The Bank of Korea has held its base rate at 2.50 percent, balancing growth support against exchange-rate and financial stability concerns.
The Semiconductor Exposure
Korea’s currency vulnerability is amplified by its sector concentration. Samsung and SK Hynix together constitute a dominant share of the global memory chip market — and global memory chip markets are themselves being stress-tested by the AI infrastructure boom. The so-called “RAMageddon” dynamic, in which AI-fuelled demand for memory chips has sent prices soaring, has provided export revenue support. But it has also created concentration risk: a reversal in AI capex demand, which the BIS and Chinese hedge funds have been warning about, would hit Korea’s export base and currency simultaneously.
The Kospi index’s heavy weighting toward Samsung, Hyundai, and semiconductor-adjacent companies means that institutional investors who reduce technology sector exposure globally tend to sell Korean equities as a primary execution path. Eight consecutive days of outflows is the market expressing that thesis in real time.
Regulatory Response
Following an earlier episode in which the won slid to its lowest since 2009 in June 2026, South Korean authorities convened an emergency meeting between the Bank of Korea governor and financial regulators. The government announced measures including stepped-up oversight of offshore currency derivatives, boosted inspections for suspected market misconduct, and investigations into potentially illegal foreign-exchange transactions.
The won briefly rebounded following those announcements before resuming its decline in early July. The pattern is familiar in currency management: administrative measures can slow momentum but rarely reverse the underlying capital flow dynamics that are driving the move.
Regional Contagion Signals
The won’s decline on July 1 led a broader retreat in Asian currencies, reflecting the dollar’s role as the default safe haven in periods of global risk aversion. The Japanese yen simultaneously extended losses to multi-decade highs against the dollar — a different dynamic driven by the US-Japan rate differential, but contributing to a picture of simultaneous stress across the major Asian currency pairs.
Emerging market investors are monitoring whether won weakness begins translating into spillover dynamics: whether Korean retail investors rotate into crypto as a won hedge (measurable through the “kimchi premium” on Korean crypto exchanges), and whether institutional outflows from Korean equity and bond markets intensify as currency losses erode total returns for foreign holders.
A currency at 1,562 per dollar, trending toward 1,600, with eight straight days of equity outflows and a semiconductor sector exposed to an AI capex cycle that global institutions are increasingly questioning — is not a crisis yet. But it is accumulating the conditions for one.
Discover more from The Economy
Subscribe to get the latest posts sent to your email.
Analysis
Japan’s $2.3 Trillion Bet: Takaichi’s AI-Semiconductor Moonshot and the Fiscal Tightrope It Requires

Japan has never been timid about industrial policy. But the plan unveiled by Prime Minister Sanae Takaichi on June 24, 2026, represents an ambition of a different magnitude: JPY 370 trillion — approximately $2.3 trillion — in combined public and private investment across 17 strategic sectors over the 14 fiscal years ending in March 2041. It is the most consequential economic growth blueprint Japan has released in a generation, and it carries risks proportionate to its scale.
The Numbers and Their Logic
The plan’s centrepiece is AI and semiconductors, which together account for JPY 101.6 trillion — nearly one-third of the total. Of that allocation, the largest share targets semiconductor manufacturing. The government projects that domestic chip sales, currently at roughly 8 trillion yen annually, will reach 40 trillion yen by fiscal 2040: a fivefold increase that would require sustained policy commitment, significant private capital mobilisation, and a structural reconfiguration of Japan’s manufacturing base.
Beyond semiconductors, the plan earmarks $65 billion specifically for AI infrastructure — data centres, power capacity, and the hardware underlying large-scale AI deployment. Vertical AI tools, built for specific industries such as healthcare, manufacturing, and logistics, receive separate priority funding alongside physical AI systems. The government projects semiconductor investment alone will generate 443 trillion yen in economic spillovers by fiscal 2040, with physical and vertical AI adding a further combined 366 trillion yen.
Additional sectors covered include defence, space development, advanced manufacturing, shipbuilding, and critical minerals — all framed as pillars of economic security in an era of intensifying geopolitical competition.
The Political Context
Takaichi became Japan’s first female prime minister in October 2025, following a decisive Liberal Democratic Party electoral victory in February 2026 that gave her government the political runway to pursue long-horizon strategies. The plan builds on prior investment commitments: since 2021, the government has channelled roughly 7.2 trillion yen into semiconductors and AI, including approximately 2.6 trillion yen in support for state-backed chip venture Rapidus.
The Nikkei 225 briefly surpassed 72,000 following the announcement — a level that reflected AI-adjacent stock enthusiasm, particularly around SoftBank and Tokyo Electron. The market signal was interpretable in two ways: confidence in the industrial vision, or exuberance about government-supported capital flows into a sector already attracting speculative premium.
The Fiscal Tightrope
The plan’s fiscal architecture is where complexity enters. According to the Japanese government’s roadmap, public funding accounts for slightly less than half of the total, with the remainder expected from private capital. Three long-term fiscal scenarios were released alongside the plan, with sharply divergent outcomes.
In the most optimistic case, the strategy delivers as intended: Japan’s debt-to-GDP ratio declines steadily even as the government contributes 10 trillion yen in real annual spending. In the two alternative scenarios, where market demand or technological uptake falls short, the ratio resumes its upward trajectory during the 2030s.
Critically, all three scenarios assume inflation stabilises at around 2 percent. They exclude the potential costs of expanded defence spending and proposed consumption-tax reductions, meaning actual fiscal pressure could significantly exceed the government’s baseline projections. Meanwhile, Japan’s superlong government bond yields have risen to multi-decade highs — a market signal that investor confidence in fiscal discipline is not fully intact, even as the Nikkei rallied.
The Bank of Japan, under Governor Kazuo Ueda, has signalled continued rate increases in response to above-target inflation and upside price risks. Deputy Governor Ryozo Himino reinforced that the BoJ expects to adjust policy in response to economic conditions and financial developments, while monitoring risks including the conflict in Iran. A government pushing expansionary fiscal policy while the central bank tightens monetary conditions is a combination that creates sovereign yield risk — precisely the kind of sovereign-financial nexus the BIS has flagged as a global vulnerability.
The Industrial Security Imperative
The plan’s framing as an economic security initiative, rather than purely a growth strategy, reflects Japan’s reading of the current geopolitical moment. Supply chain resilience, technological self-sufficiency, and domestic semiconductor capacity have become strategic imperatives for governments across the developed world in the wake of the pandemic disruptions and US-China technology competition.
Japan’s bid to quinttuple domestic chip sales by 2040 places it in direct competition with the United States’ CHIPS Act investments, the EU’s European Chips Act, and South Korea’s semiconductor cluster ambitions. The difference is that Japan is making the largest single national commitment to that competition — a bet that the country has identified the window for industrial transformation, and that the cost of missing it exceeds the fiscal risk of pursuing it.
Whether the numbers work depends on outcomes that no government roadmap can control: whether AI adoption curves justify the infrastructure being built, whether Rapidus can achieve competitive semiconductor yields, and whether private capital follows government funds at the scale the plan requires. The bet is large. The stakes are higher.
Discover more from The Economy
Subscribe to get the latest posts sent to your email.
The numbers are unambiguous, even if their implications remain contested. In 2025, global personal wealth rose at its fastest pace since 2017. Nearly one million new millionaires were minted. The billionaire population swelled by 13 percent. And in most of the 56 markets where the UBS Global Wealth Report tracks outcomes, median wealth — the wealth of the person sitting precisely in the middle of the distribution — actually declined.
That combination, record headline growth alongside falling typical household wealth, is the defining economic signature of the AI boom. It raises questions about the sustainability of an economic narrative built on aggregate progress.
What the UBS Report Found
The UBS Global Wealth Report 2026, released June 30 and built from data spanning 56 markets representing 92 percent of all global wealth, recorded 10.8 percent growth in personal wealth in 2025 — the fastest rate in at least three years. The millionaire population grew by 1.5 percent, adding close to one million people at a pace of roughly 2,680 per day.
More than 440,000 of those new millionaires were American — exceeding 1,200 per day — making the United States responsible for close to half of the worldwide increase. The United Kingdom added more than 43,000 new millionaires, while France, Spain, Japan, and India each added more than 30,000.
The report also counted 3,302 US dollar billionaires, an increase of 383 people, or 13.1 percent, over the prior year. Billionaire wealth grew by 25 percent on average in the year ended in April, compared with a 10.8 percent rise in average personal wealth. James Mazeau, an economist at UBS, attributed the outperformance directly to the AI boom in equity markets.
The Median Paradox
UBS chief economist Paul Donovan acknowledged to Fortune what the headline figures conceal: “There is a concentration of equity wealth into the very highest wealth and income cohorts, which means that periods of strong equity performance will widen the gap between the two.” When asset markets rise and the gains are overwhelmingly held at the top of the distribution, aggregate averages can soar while the typical household experiences stagnation or decline.
The pattern is not incidental. Software and platform businesses scale at close to zero marginal cost, meaning that when an AI-adjacent product wins, it tends to win globally — and the revenue, profit, and equity all funnel into very few hands. The World Inequality Report 2026 sharpened the point with striking precision: just 56,000 ultra-wealthy individuals — the top 0.001 percent — now control more wealth than the poorest 4 billion people on Earth combined. Their share of global wealth has nearly doubled since 1995.
Since 1995, billionaire wealth has compounded at approximately 8.5 percent annually. The bottom half of the global population has grown theirs at roughly 3.4 percent.
The Ultra-Wealthy Tier Accelerates
Altrata, a wealth intelligence firm, tracked a 14.4 percent jump in 2025 in the number of people worth more than $30 million — reaching a record 556,850 worldwide. In mainland China, the $50 million to $100 million cohort has compounded in real terms at nearly 31 percent annually since 2000. The United States’ top 1 percent of households, per the Federal Reserve, now holds approximately 32 percent of the nation’s total wealth — the highest proportion since the Fed began compiling the relevant data in 1989.
Within this hierarchy, the AI trade has functioned as a supercharger. Founders who hold large equity stakes in companies that have benefited from AI-driven market re-ratings have watched their personal wealth compound at the same exponential rates as the underlying businesses. The upcoming major IPOs — SpaceX, Anthropic, and OpenAI — are projected to create a new cohort of billionaires and dramatically expand the existing ultrawealthy population.
The Political Economy of the K-Shape
Bloomberg’s K-shaped economy analysis projected that the divergence between asset holders and wage earners will deepen further. The political consequences are already visible. California Governor Gavin Newsom, in comments reported ahead of a potential 2028 presidential run, proposed a national wealth tax and an initiative to give Americans a direct stake in AI development. Former Amazon CEO Jeff Bezos called for the bottom 50 percent of earners to pay zero federal income tax.
Axios reported that a growing number of tech billionaires are developing prescriptions for AI-fuelled inequality — not from altruism, but from a calculation that populist revolt represents a greater threat to their interests than redistributive taxation. “The pitchforks are here, they’re not just coming,” Newsom warned, predicting that resentment toward billionaires and AI-driven automation will dominate the 2026 and 2028 electoral cycles.
Donovan, the UBS economist, noted that governments are likely to seek to mobilise wealth to lower the cost of debt finance. What that means in practice — wealth taxes, forced investment mandates, or some novel fiscal instrument — remains the defining policy question of the decade the AI boom is creating.
Discover more from The Economy
Subscribe to get the latest posts sent to your email.

$109 Trillion and Counting: How the World’s Sovereign Debt Crisis Is Being Built in Plain Sight

South Korea’s Won Slides to Its Weakest Since Lehman: Asia market impact

Japan’s $2.3 Trillion Bet: Takaichi’s AI-Semiconductor Moonshot and the Fiscal Tightrope It Requires

A 13% Surge in Billionaires, a Falling Median: The AI Boom’s Wealth Paradox

The Next Banking Crisis Won’t Come From Bad Loans. JPMorgan Says It Will Come From Hackers.

The Kill Switch: Bank of England Moves to Contain Agentic AI Before It Crashes Financial Markets

The AI Super Bubble Is Ready to Burst

Carry Trade Unwind 2026: How the Yen’s Snapback Triggered a Global Margin Call

Bitcoin $150k Milestone Achieved as US Sovereign Crypto Pivot Looms

S&P 500 7000 Target: Wall Street’s Bullish Case for Year‑End 2026

EU Greenwashing Enforcement Hits New Peak with €1.2 Billion Fast‑Fashion Fine

India Economic Rise 2026: How the Subcontinent Toppled Japan

Sovereign Debt Crisis 2026: The ‘Lost Decade’ Is Already Here for 40 Nations

Crude Oil Price Rally June 2026: OPEC+ Extends Cuts, Targets $100

PwC China Partner Payouts Cut Amid Evergrande Audit Fraud

Broadcom Market Value Loss: Revenue Forecast Disappoints

Investors Pile Into Bullish Dollar Bets as ‘US Exceptionalism’ Trade Returns

Here’s How Much It’ll Cost You to Be Part of SpaceX’s Record-Breaking $75 Billion IPO

Nasdaq Tumbles 4% as Chip and Memory Stocks Sink: A $1.2 Trillion Wipeout

Japan’s Nikkei Scales Record Peak as AI Shares Track US Chip Rally

How to Fix Pakistan’s Debt Economy: A Structural Blueprint

Grinding the Already Ground: Pakistan’s Inflation Crisis

Smash Capital Leads $200M Funding for Allen Control Systems

Democrats Draw a Red Line Around Military AI — And the Pentagon Is Already Pushing Back

JPMorgan Cuts Anthropic AI Access in Hong Kong

New Investment Super-Cycle: AI, Green Energy & Re-Shoring

Middle East Conflict Oil Prices: The $4 Surge Explained

Xponential Fitness Franchise Lawsuit: The $3.97M Judgment
-

 Markets & Finance6 months ago
Top 15 Stocks for Investment in 2026 in PSX: Your Complete Guide to Pakistan’s Best Investment Opportunities
-

 Analysis4 months ago
Top 10 Stocks for Investment in PSX for Quick Returns in 2026
-

 Analysis5 months ago
Brazil’s Rare Earth Race: US, EU, and China Compete for Critical Minerals as Tensions Rise
-

 Analysis4 months ago
Johor’s Investment Boom: The Hidden Costs Behind Malaysia’s Most Ambitious Economic Surge
-

 Banks5 months ago
Best Investments in Pakistan 2026: Top 10 Low-Price Shares and Long-Term Picks for the PSX
-

 Investment6 months ago
Top 10 Mutual Fund Managers in Pakistan for Investment in 2026: A Comprehensive Guide for Optimal Returns
-

 Global Economy6 months ago
15 Most Lucrative Sectors for Investment in Pakistan: A 2025 Data-Driven Analysis
-

 Global Economy6 months ago
Pakistan’s Export Goldmine: 10 Game-Changing Markets Where Pakistani Businesses Are Winning Big in 2025