
Inflation
How to Control Rising Inflation Amid Hormuz Closure: A Case for South Asian States

The Strait of Hormuz closure has unleashed the largest oil supply shock in history. Here’s how India, Pakistan, and Bangladesh can control rising inflation—and why the crisis is a structural wake-up call.
Something shifted in the world economy on February 28, 2026—and it is not coming back anytime soon.
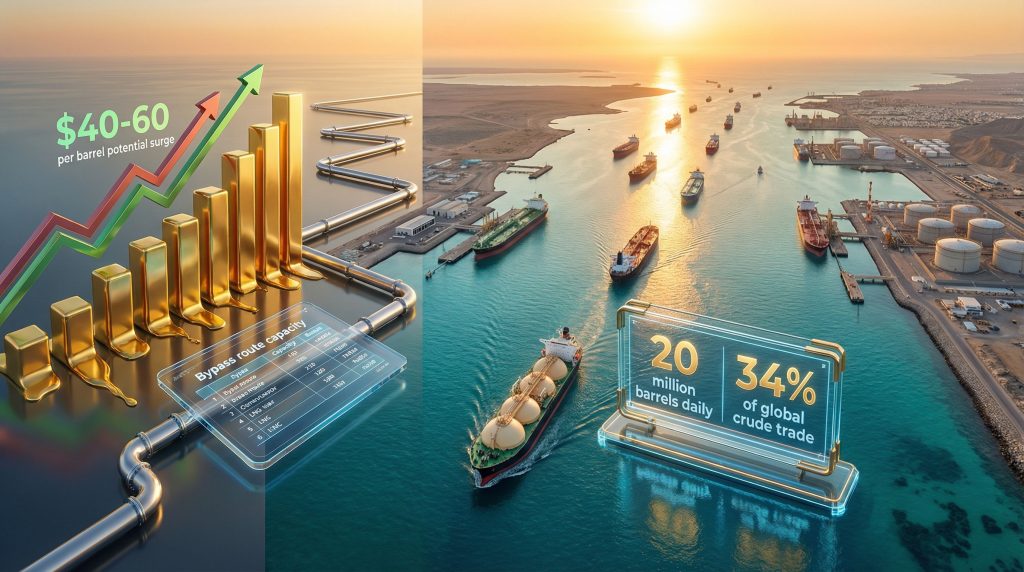
When U.S.-Israeli strikes on Iran triggered the closure of the Strait of Hormuz, the world did not merely lose a shipping lane. It lost the circulatory artery of the global energy system. Tanker traffic through the strait—which ordinarily handles roughly 20% of global seaborne oil and a quarter of global LNG—collapsed from approximately 130 vessels per day in February to a near-standstill of just 6 in March, a 95% plunge almost without historical precedent. The International Energy Agency called it “the largest supply disruption in the history of the global oil market.” That is not hyperbole. That is a policy emergency.
For South Asia, the shock arrived like a tax bill no one budgeted for. Fuel queues snaked around petrol stations from Karachi to Chittagong. LPG cylinders vanished from market shelves in Lahore and Dhaka. Transport operators in Mumbai began passing surcharges onto consumers already squeezed by food prices. Small manufacturers—the backbone of South Asian employment—watched input costs spike while their customers pulled back. And everywhere, the question was the same: How long can governments hold the line?
The answer depends entirely on whether South Asian leaders treat this crisis as a temporary weather event requiring familiar relief measures—or as a structural indictment of a chronic, self-inflicted energy vulnerability that has been deferred for too long.
The Transmission Mechanism: How Hormuz Disruption Fuels South Asian Inflation
Understanding the inflation problem requires mapping the transmission chain from a narrow waterway in the Persian Gulf to a vegetable vendor’s stall in Dhaka.
The first channel is direct energy costs. Physical Dated Brent crude—the price Asian importers actually pay for delivered cargoes—surged to $132 per barrel in early April, even as futures markets drifted back to the low-$90s on ceasefire speculation. The gap between the futures price and the physical price tells you everything: markets believe the crisis will eventually resolve, but the cargo sitting in a tanker outside the Gulf cannot wait for resolution. For every $10 sustained increase in oil prices, global inflation rises by approximately 0.2–0.25 percentage points—a rule of thumb that becomes brutally consequential when prices jump $40 or $50.
The second channel is fertilizer. Up to 30% of globally traded fertilizers—urea, ammonia, and phosphates—transit the Strait of Hormuz. The Persian Gulf accounts for roughly 30–35% of global urea exports. With the strait closed, fertilizer prices in South Asia have spiked sharply, arriving precisely when planting seasons begin. This is not merely an economic problem. It is a food security crisis in the making, as higher fertilizer costs translate directly into lower crop yields and higher food prices in societies where food already commands 40–50% of household expenditure.
The third channel is currency depreciation. As investors pulled capital from emerging markets, the Pakistani rupee, Bangladeshi taka, and Sri Lankan rupee all faced renewed downward pressure. A weaker currency means costlier imports—denominated in dollars—feeding exchange rate pass-through into domestic prices. For Pakistan, navigating an IMF programme with thin foreign exchange reserves, this is the most dangerous second-order effect.
The fourth channel is LNG and power generation. After Iran struck Qatar’s Ras Laffan LNG complex in March 2026, northeast Asian LNG spot prices more than doubled to $22.5 per MMBtu. Bangladesh—which pivoted aggressively toward LNG-fired power in recent years—found its generation economics upended overnight. Pakistan, already mired in circular debt in its energy sector, faces similar pressures.
The IMF’s April 2026 World Economic Outlook now anticipates global inflation rising to 4.4%—up 0.6 percentage points from January projections—while global growth is expected to slow to 2.6% in 2026 from 2.9% in 2025. UNCTAD warns that developing nations face the ‘dual whammy’ of higher prices and weakening currencies simultaneously constricting their capacity to respond.
South Asia’s Structural Vulnerability: The Price of Chronic Dependence
Compared with economies most insulated from this shock—the United States, which exports energy; or China, which held approximately 1.2 billion barrels of crude reserves as of early 2026, providing over 100 days of import cover even under a scenario of zero new inflows—South Asia stands nakedly exposed.
India sources 40–50% of its crude imports via the Strait of Hormuz under normal conditions. Japan and South Korea—commonly cited as the most structurally vulnerable large Asian economies—at least benefit from decades of investment in strategic petroleum reserves exceeding 100 days of import cover, IEA membership, and deep institutional frameworks for crisis response. South Asian states, broadly, have none of these advantages at scale.
Pakistan immediately requested that Saudi Arabia reroute crude shipments through the Red Sea port of Yanbu—a pragmatic emergency measure, but illustrative of just how thin Pakistan’s contingency infrastructure has become. Bangladesh, among the most price-sensitive importers in Asia, faces fuel shortages that threaten to cascade through its garment sector—the country’s principal export earner and employer.
What makes South Asia’s position particularly precarious is the coincidence of vulnerabilities: high energy import dependence, thin fiscal buffers, food systems reliant on fertilizer imports, large informal workforces with no safety nets, and governments facing political pressure to cushion consumers precisely when doing so most strains public finances.
The Subsidy Trap: Why the Obvious Answer Is the Wrong One
Let us be clear-eyed about one temptation that will prove costly: using broad-based fuel subsidies as the primary response to this crisis.
Subsidies are politically seductive. They provide immediate, visible relief. They suppress headline inflation statistics in the short run. But the record is damning. Pakistan’s history of energy subsidies has contributed materially to its recurring fiscal crises, its addiction to IMF programmes, and the circular debt spiral that has made its power sector a structural liability rather than an asset. India’s fertilizer and fuel subsidy bill already runs into the hundreds of billions of rupees annually; adding another layer during an oil shock without structural reform merely postpones pain while accumulating fiscal dry tinder.
Subsidies also suppress the price signals that tell businesses and consumers to adapt—to shift to public transport, to invest in more efficient machinery, to explore renewable alternatives. The right model is targeted, time-bound support for the genuinely vulnerable—low-income households, small farmers, critical transport workers—combined with demand management measures across the broader economy.
A Framework for Controlling Inflation Amid the Hormuz Closure
Short-Term Measures: Absorbing the Shock (0–6 months)
- Strategic reserve management. India, having diversified its crude sources to over 41 suppliers and pivoted to Russian crude since 2022, received a U.S. Treasury emergency waiver in March 2026 permitting purchases of stranded Russian oil cargoes—a pragmatic lifeline. Other South Asian states should immediately inventory available reserves and coordinate drawdowns with transparency to avoid hoarding.
- Emergency import diversification. Pakistan’s request for Saudi rerouting via Yanbu is the template, not the ceiling. Bangladesh, India, and Sri Lanka should activate emergency procurement with suppliers in West Africa (Nigeria, Angola), the Americas (Colombia, Brazil, Ecuador), and the United States, whose LNG export capacity is insulated from the Hormuz disruption.
- Demand-side management. The IEA’s crisis guidance recommends remote working, reduced highway speeds, carpooling mandates, and optimised public transport. The Philippines has moved to a temporary four-day work week. South Asian governments should adopt contextually adapted equivalents—calibrated demand reduction that cuts import bills without destroying economic activity.
- Targeted cash transfers over blanket subsidies. Channel relief directly to low-income households through digital payment infrastructure (India’s JAM Trinity, Bangladesh’s mobile money networks). Protect purchasing power without distorting price signals economy-wide.
Medium-Term Measures: Reducing Structural Dependence (6–24 months)
- Accelerated crude and LNG source diversification. No South Asian state should source more than 25–30% of any single energy commodity from a single supplier corridor. Long-term offtake agreements with U.S. LNG exporters, African crude suppliers, and Central Asian pipeline sources should be treated as national security imperatives.
- Regional energy cooperation. The BIMSTEC framework offers mechanisms for South Asian states to share strategic reserves in crisis conditions, coordinate procurement for scale advantages, and develop regional transmission infrastructure. Nepal and Bhutan’s hydropower potential remains dramatically underutilised as a clean regional resource.
- Fertilizer production localisation. India and Pakistan have domestic natural gas resources that could be more systematically directed toward domestic urea production, reducing the 30%+ import dependence on Gulf fertilizer. Bangladesh should explore accelerated investment in domestic blended fertilizer formulations.
Long-Term Measures: Achieving Energy Sovereignty (2–10 years)
- Aggressive renewable energy scaling. India already targets 500 gigawatts of renewable capacity by 2030. The Hormuz crisis makes this not merely an environmental imperative but an economic security imperative. Every gigawatt of domestic solar or wind capacity installed is a barrel of oil not imported, a dollar of foreign exchange not spent, an inflation point avoided in the next supply shock.
- Energy efficiency and building codes. Mandatory efficiency standards for appliances, commercial buildings, and industrial processes can materially reduce electricity demand growth without reducing welfare—and should be treated as a structural inflation-control mechanism.
- Fiscal buffers and sovereign energy funds. South Asian states should consider establishing dedicated Energy Security Funds—capitalised during periods of lower oil prices—to finance strategic reserve acquisitions and energy transition investments without straining general budgets during shock periods.
The Geopolitical Dimension: South Asia Needs a Seat at the Table
The Hormuz crisis is ultimately a geopolitical crisis. And South Asian states—which between them represent nearly two billion people and some of the most oil-import-dependent large economies on earth—have historically been bystanders in the geopolitical conversations that determine their energy fates.
India, as the region’s largest economy and a G20 member, should use every diplomatic channel to advocate for Hormuz stabilisation, including through its traditionally non-aligned posture and its relationships with Gulf states, Russia, and the United States. Delhi should also push for South Asian integration into IEA-style emergency response frameworks—a conversation that has inched forward in recent years but has yet to produce binding mechanisms.
Pakistan, Bangladesh, and Sri Lanka should coordinate through the UN, UNCTAD, and the Commonwealth to ensure the international community’s crisis response includes adequate support for vulnerable energy-importing developing nations. The IMF and World Bank have signalled awareness of this imperative; South Asian governments must turn awareness into concrete concessional financing for energy security investments.
The Crisis That Could Change Everything
The Strait of Hormuz has always been South Asia’s Achilles’ heel. What has changed in 2026 is that the vulnerability can no longer be politely deferred.
UNCTAD’s assessment is unambiguous: regions more dependent on Middle East energy imports, particularly South Asia and Europe, will be more exposed to prolonged inflationary pressure if disruptions persist. The SolAbility modelling estimates cumulative GDP losses of 3–4% or more under prolonged closure scenarios, with South Asia absorbing some of the heaviest hits. These are not tail risks. They are baseline scenarios under conditions that show no imminent resolution.
The history of structural economic reform tells a consistent story: the deepest, most durable reforms happen under crisis conditions, when the political economy of inertia is finally overwhelmed by the political economy of necessity. The 1991 Indian reforms came on the back of a balance-of-payments crisis. Bangladesh’s garment sector rise came out of disciplined liberalisation under pressure. Pakistan’s most consequential fiscal adjustments have invariably come under IMF conditionality.
The 2026 Hormuz closure can be South Asia’s next inflection point—but only if leaders resist the narcotic of temporary relief and reach instead for structural transformation.
The strait may reopen. The lesson must not close with it.
Key Sources & Citations
• IMF Blog: How the War in the Middle East Is Affecting Energy, Trade, and Finance (March 2026)
• UNCTAD Rapid Assessment: Hormuz Disruption Deepens Global Economic Strain
• Bloomberg Economics SHOK Model – Hormuz Oil Shock Analysis
• IMF Regional Economic Outlook: MENAP, April 2026
• World Economic Forum: 6 Ways Countries Are Responding to the Historic Energy Shock
• IG Markets: Strait of Hormuz Closure – Implications for Asia
• SolAbility: Hormuz Economic Impact Model – Day 42 Update
• Al Jazeera: IMF Cuts Global Growth Forecast During Hormuz Blockade
• Wikipedia: 2026 Strait of Hormuz Crisis
• Allianz Research: Economic Outlook 2026–27 – The Fog of War
Discover more from The Economy
Subscribe to get the latest posts sent to your email.


The numbers landed like a thunderclap across trading floors at 8:30 a.m. Eastern on June 10. Headline consumer prices in the United States had leapt 4.2% in the year through May, the Bureau of Labor Statistics reported, rocketing past every consensus forecast. The print — the highest since the inflationary inferno of 2022 — was powered by a 17.3% monthly surge in gasoline, itself the shockwave of a military blockade in the Strait of Hormuz that had throttled global crude flows for 37 days and counting. In Chicago, soybean futures halted limit-down. In Washington, the phones inside the Eccles Building began ringing before the data hit the wire.
The 4.2% figure ends a fragile, hard-won disinflation that had taken the consumer price index from 9.1% in June 2022 to 3.8% as recently as April 2026. For 22 months, the Federal Reserve had held the federal funds rate at 5.25%–5.50%, betting that restrictive policy could finish the job without cracking the labour market. May’s report — a 0.9% month-on-month jump in the headline index — suggests that bet has been overrun by events 6,200 nautical miles away. Core CPI, which strips out food and energy, rose 0.4% for the month and 3.7% year-on-year, a sobering reminder that underlying price pressures have not been vanquished. The energy shock is now bleeding into services, shelter, and transportation, the categories that determine whether inflation becomes embedded in the daily life of every American.
The catalyst is no mystery. On 3 May, Iran’s Revolutionary Guard Corps mined the western approaches of the Strait of Hormuz and deployed fast-attack craft after the collapse of the Vienna 3 nuclear talks. Within 48 hours, Brent crude had vaulted from $78 to $124 a barrel. The physical market seized up: 21 million barrels a day of crude and condensate transit the strait, and insurers declared most hulls uninsurable north of Fujairah. By the final week of May, the US national average retail price for regular gasoline touched $5.12 a gallon, [according to AAA](https://gasprices.aaa.com/), up $1.44 from the week before the blockade. Jet fuel and diesel rose even faster, compressing airline margins and adding a fresh layer of freight costs to an economy still scarred by the logistics snarls of 2021–22. The BLS energy index climbed 12.4% in May alone — the largest one-month increase since March 2022, when Russia’s invasion of Ukraine scrambled global hydrocarbons.
For motorist Carla Jefferson, filling the tank of her 2019 Honda CR-V at a Shell station on West Florissant Avenue in St. Louis, the arithmetic was brutal. “It was $91. I’ve never paid $91 for a tank of regular,” she said on the morning of the CPI release, studying the receipt as though it might contain a clerical error. “I manage a daycare. I can’t just not drive.” Her experience is the granular translation of an index number that, in Washington and New York, is traded and hedged and dissected in decimal points. For households earning under $60,000, energy and food together consume roughly 22% of post-tax income, more than double the share of the top quintile. When gasoline gallops, those households have no alternative: demand is inelastic, and the price is paid in forgone prescriptions, skipped credit-card payments, and cheap calories that often worsen health outcomes. The 4.2% headline is an average that conceals a regressive tax.
What caused the jump in US inflation to 4.2% in May 2026? The Strait of Hormuz disruption sent gasoline prices up 18.3% and overall energy costs up 12.4%, adding roughly 1.8 percentage points to headline CPI. Core services inflation stayed stubborn at 4.1%, driven by shelter, insurance, and medical care, confirming that even without the energy shock, price stability was not assured. The BLS release noted that shelter costs, the largest component of core CPI, rose 0.5% for the month and 5.2% year-on-year, propelled by a lagged pass-through of home prices and a multi-year insurance premium spiral in coastal states exposed to climate-linked disasters.
The bond market’s reaction was swift and brutal. The two-year Treasury yield, the most sensitive to Fed policy expectations, leapt 28 basis points to 4.89% within an hour of the release — the sharpest intraday move since March 2023, when regional banks were failing. The ten-year yield pierced 4.70% for the first time in 16 months, and the yield curve bear-steepened in a way that historically signals markets pricing a policy error. Fed funds futures, which as late as April implied two rate cuts in the second half of 2026, abruptly flipped to price a 62% probability of a quarter-point hike at the July meeting, according to CME FedWatch. Rate traders are now assigning a non-trivial chance — 14%, by one options-based model — that the terminal rate could breach 6% before year-end.
What follows, however, is not a straightforward replay of 2022. The American economy of June 2026 is more leveraged, more fiscally constrained, and more politically brittle than the one that absorbed the post-pandemic price surge. Federal debt held by the public has crossed $38 trillion, and net interest outlays are running at an annualised $1.4 trillion, exceeding the defence budget. Every additional 100 basis points of Fed tightening adds roughly $380 billion to annual interest costs within two years, a fiscal accelerator that the Congressional Budget Office has flagged as the single largest risk to long-term solvency. The political calendar compounds the arithmetic: midterm elections are five months away, and a Democratic president is defending a single-digit House majority. The White House released a statement at 9:12 a.m. pledging to “use every tool at our disposal,” including a new round of Strategic Petroleum Reserve releases, but the SPR holds just 19 days of net import cover after the drawdowns of 2022 and the replenishment delays of 2024–25. The powder is damp.
Fed Chair Jerome Powell, speaking at a European Central Bank forum in Sintra on 9 June, acknowledged the inflation spike as “a supply-driven shock that complicates the path to our 2% objective,” but his words were carefully hedged. “We will not overreact to a single print, however uncomfortable, when the source is clearly a geopolitical event whose duration we cannot forecast,” he said. “But we will not hesitate to act if expectations become unanchored.” The University of Michigan’s preliminary June survey of consumers, released on the same day as the CPI, offered an early warning: five-to-ten-year inflation expectations ticked up to 3.4%, the highest since 1995, from 3.0% in May. That metric, which the Fed’s own research identifies as a critical leading indicator of wage-price dynamics, will likely dominate the internal debate at the Federal Open Market Committee’s 17–18 June meeting.
The picture is more complicated than a mechanical pass-through from oil to inflation. The US economy is running hotter than most models recognised. Payrolls grew by 287,000 in May, and average hourly earnings accelerated to 4.4% year-on-year, a pace inconsistent with 2% inflation unless productivity growth has accelerated well beyond its current 1.6% trend. The Atlanta Fed’s GDPNow model was tracking 3.1% real growth for the second quarter as of 6 June, driven by a consumption binge that household balance sheets cannot sustain indefinitely. This is not stagflation; it’s an overheating economy absorbing a supply shock, a combination that leaves monetary policymakers with no clean choices. If they hike into the shock, they risk crushing demand at precisely the moment the economy needs flexibility to reallocate resources. If they wait, they risk letting the 1970s genie out of the bottle — and the 1970s genie, once freed, required a 20% funds rate and a double-dip recession to re-cork.
A competing view, articulated forcefully by Mohamed El-Erian, chief economic adviser at Allianz and president of Queens’ College, Cambridge, insists the Fed should hold steady and accept a temporarily higher inflation rate rather than compound the supply shock with demand destruction. “The central bank cannot print oil, it cannot reopen a strait, and it cannot unilaterally cool shelter inflation that is driven by a decade of underbuilding,” El-Erian wrote in a Bloomberg opinion column on 9 June. “Tightening now would be an unforced error — the equivalent of shooting the patient because the fever hasn’t broken.” The argument has intellectual heft: core goods inflation actually declined 0.2% in May, and the supply-chain pressures index maintained by the New York Fed remains below its long-run average. If the Strait of Hormuz reopens — and diplomatic backchannels between Oman and Tehran have intensified in recent days — energy prices could fall as fast as they rose, pulling headline inflation back toward 3.5% by September.
Yet that position assumes that the inflation expectations genie stays docile. The Michigan survey suggests it’s already stirring. And there is a deeper, more structural worry: the energy shock is not a one-off. It is the third major supply disruption in five years, following COVID-era factory closures and the Russia-Ukraine commodity crisis. Firms that spent the 2010s optimising for just-in-time efficiency are now aggressively reconfiguring for resilience — reshoring, dual-sourcing, building inventory buffers. That insurance carries a cost, and the cost is structurally higher prices. A working paper published by the Bank for International Settlements in April 2026 estimated that the shift from efficiency to resilience in global supply chains could add 0.8 to 1.2 percentage points to advanced-economy inflation over the medium term, independent of cyclical forces. If the BIS is even half right, the Fed’s 2% target may be incompatible with the geopolitical realities of the mid-2020s.
The second-order effects are already cascading. Mortgage rates, which had drifted down to 6.3% in April on hopes of Fed easing, shot back above 7% in the first week of June, freezing the spring housing market. The National Association of Realtors’ affordability index dropped to its lowest level since October 1985. In corporate credit markets, spreads on high-yield bonds widened 65 basis points in two weeks, and a major airline — already squeezed by jet fuel costs — postponed a $3.2 billion debt refinancing, citing “adverse market conditions.” Emerging-market currencies, from the Indonesian rupiah to the South African rand, sold off sharply as the dollar index climbed 2.7% in five trading sessions. A strong dollar, coupled with expensive energy, is a classic recipe for balance-of-payments stress in the developing world. The IMF’s managing director warned on 8 June that the institution is “preparing for a wave of emergency lending requests” if crude prices stay elevated beyond the third quarter.
For American businesses, the calculus is simple and unforgiving. The producer price index for May, released 24 hours after the CPI, showed a 0.9% monthly rise, with goods inputs up 1.6% — nearly all of it energy and energy-linked chemicals. Margins, which cushioned the early phase of the post-pandemic inflation, are now compressing. The S&P 500’s aggregate operating margin fell to 11.9% in the first quarter, the lowest since late 2020, and second-quarter guidance from consumer-discretionary CEOs has been laced with warnings about “elasticity exhaustion” — the point at which customers simply stop accepting price increases. Procter & Gamble, which has raised prices in 17 of the last 19 quarters, reported a 1.8% volume decline in its North American segment for the three months to March. If energy costs persist, the next round of earnings calls will be a stress test for the pricing power that Wall Street has taken for granted.
The disinflation that preceded May’s shock was real but fragile. It rested on three pillars: healing supply chains, a cooling labour market, and anchored expectations. The Middle East crisis has knocked out the first pillar. The second pillar is wobbling: the quits rate, a reliable predictor of wage pressure, rose to 2.6% in April from 2.3% in January, and the ratio of job openings to unemployed workers ticked back above 1.6. The third pillar — expectations — is now under direct assault. History suggests that once expectations begin to drift, the cost of restoring them rises nonlinearly. The Fed’s own 2022 Tealbook simulations showed that a one-percentage-point increase in expected inflation, if not countered quickly, adds 0.7 points to actual inflation within 12 months. The Michigan reading of 3.4% is not yet a one-point jump, but its trajectory is steeper than anything observed since 1991.
What makes this episode distinct is the speed with which the energy shock has transmitted into core services. In the 1973–74 oil embargo, it took roughly six quarters for higher crude prices to fully work their way into non-energy consumer prices. In 2026, that lag has compressed to what San Francisco Fed economists estimate as three to four months, owing to the prevalence of energy surcharges in service contracts, algorithmic pricing software that reprices airline seats and hotel rooms in real time, and indexed wage agreements in logistics and healthcare. The “stickier” the inflation becomes, the more painful the cure. Diane Swonk, chief economist at KPMG US, captured the anxiety in a client note on the morning of the release: “This is not 1973, but it is also not 2022. We are in a third regime — one where supply shocks are more frequent, pass-through is faster, and the Fed’s margin for patience is thinner than markets assume.”
The thin margin is evident in the options market. The Cboe Volatility Index, the VIX, closed at 29.8 on 10 June, its highest since the regional banking turmoil of March 2023. But more telling was the move in the MOVE index, which tracks Treasury volatility: it hit 158, a level that historically has preceded recessions. Bond traders are not merely pricing a rate hike; they are pricing a regime change in the structure of the economy. The term premium on the ten-year note — the compensation investors demand for bearing the risk that inflation and rates could deviate from expectations — turned positive in May for the first time since 2020 and has since widened to 42 basis points. That shift alone has added roughly $120 billion to the present value of the federal debt stock, a figure that will quietly appear in the Treasury’s next quarterly refunding announcement.
What comes next will hinge on three variables: the duration of the Strait of Hormuz closure, the reaction function of the FOMC, and the resilience of the American consumer. The first is unknowable. The second will be revealed on 18 June, when the committee releases its Summary of Economic Projections; traders will scrutinise the “dot plot” for any shift in the 2026 median. The third is measurable in real time. Real average hourly earnings, adjusted for the May CPI, fell 0.6% for the month and are now down 1.3% year-on-year. Households are drawing down the last of their pandemic-era savings buffers; the San Francisco Fed estimates that excess savings, which peaked at $2.3 trillion in mid-2021, fell below $150 billion in April. Credit card delinquencies at smaller banks have risen to 7.1%, the highest in data going back to 1991. The consumer is not broken, but the cracks are widening.
The afternoon of the CPI release, a modest two-paragraph statement from the Treasury Department confirmed that Secretary Wally Adeyemo had convened an emergency meeting of the President’s Working Group on Financial Markets. The statement named no date, no agenda. It didn’t need to. The silence was the message.
The US economy has absorbed energy shocks before, and it has absorbed inflation before. It has rarely absorbed both while sitting on a federal debt-to-GDP ratio above 120%, a housing market frozen by 7% mortgage rates, and a geopolitical map that grows more incendiary by the quarter. The 4.2% print is not a crisis. It is a warning, printed in the only language financial markets truly respect. Whether Washington and the Eccles Building heed it is a question that will be answered not in the coming weeks, but in the long, brittle months ahead. The only certainty is that the margin for error has vanished.
Discover more from The Economy
Subscribe to get the latest posts sent to your email.
The trading floor of the New York Federal Reserve contains few hiding places when macroeconomic variables diverge from consensus models. On March 12, 2026, the publication of the latest US consumer price index data sent a familiar shudder through fixed-income desks as core inflation printed at an annualized 3.4%, outstripping projections for the third consecutive month. For global asset allocators, the signal appeared clear: structural forces, from supply chain restructuring to structural fiscal deficits, are entrenching price pressures. Yet, the anticipated stampede into defensive assets never materialized. Instead, institutional capital actively drifted away from the primary vehicles designed to mitigate this exact risk, revealing a profound structural disconnect within modern capital markets.
The macro environment explains the deep anxiety among allocators, who recognize that old playbooks are failing. According to recent data from the Bureau of Labor Statistics inflation reports, price volatility has become structural rather than cyclical, driven by shifts in global trade architecture and green energy transitions. Ordinarily, this backdrop would trigger a historic capital reallocation into sovereign inflation-linked portfolios to preserve purchasing power. Data compiled from recent Federal Reserve economic databases indicates that secondary market trading volumes for inflation-linked instruments have dropped 18% over the past 12 months. This paradox leaves retail wealth managers and institutional pension funds exposed to the corrosive effects of currency depreciation, raising an uncomfortable question: why are the market’s premier inflation shields being left on the rack?
The Valuation Paradox of Inflation-Protected Bonds
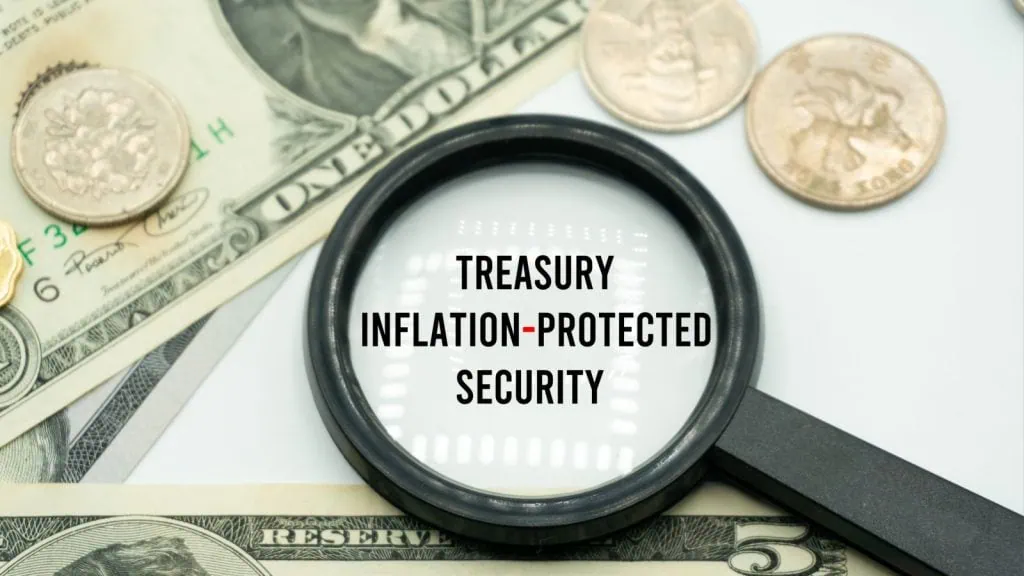
The core development anchoring this market anomaly lies in the fundamental mechanics of inflation-protected bonds, known formally in the US as Treasury Inflation-Protected Securities (TIPS). These instruments are designed to preserve purchasing power by adjusting their principal value upward in direct lockstep with changes in the Consumer Price Index for All Urban Consumers. When inflation climbs, the bond’s principal increases, which subsequently increases the coupon payment since the fixed rate is applied to a larger principal base.
[CPI Increases] ──> [Principal Value Adjusts Upward] ──> [Higher Nominal Coupon Payment]
Yet, despite structural anxieties regarding long-term price stability, net capital inflows into these funds have inverted. Analysis published via Bloomberg market analysis portals details how recent Treasury auctions for 10-year inflation-linked notes saw the lowest bid-to-cover ratio since the pandemic, dropping to a mere 2.15. This tepid demand stems from a stark reality: the market has already priced in an aggressive long-term inflation premium, rendering the entry point for new buyers exceptionally penal.
       10-Year Nominal Treasury Yield (4.50%)
                     │
                     ├─> Breakeven Inflation Rate (2.35%)
                     │
                     └─> Real Yield / TIPS Yield (2.15%)
To understand why capital is fleeing these securities, one must dissect the relationship between nominal yields, real yields, and the breakeven inflation rate. The breakeven rate represents the difference between the nominal yield on a standard Treasury and the real yield on an inflation-linked bond of the same maturity. If a nominal 10-year Treasury yields 4.50% and a 10-year inflation-protected bond yields 2.15%, the breakeven rate is exactly 2.35%.
For an investor, this means inflation-linked bonds will only outperform nominal Treasuries if the actual, realized inflation rate averages more than 2.35% over the next decade. If inflation averages 2.20%, the investor who bought the standard nominal bond wins.
Many institutional desks believe that while inflation will remain sticky, the current breakeven rates already reflect this reality, leaving no money on the table for new buyers. The market has transformed from an absolute hedge into a highly localized relative-value bet on whether the Federal Reserve will miss its long-term inflation target.
“The true risk in fixed income today isn’t just that inflation prints hot,” notes a senior rates strategist at a major primary dealer in New York. “The risk is that you pay such a high premium for inflation protection that the cure becomes more expensive than the disease.”
Anatomy of Duration Risk and the Pricing Mirage
Movements across the fixed-income landscape require a deep structural interpretation, particularly regarding how interest rate cycles distort the defensive characteristics of Treasury Inflation-Protected Securities. A common misconception among retail market participants is that because a bond protects against inflation, its market price is immune to monetary policy tightening. The reality is far more punishing.
Why do TIPS lose value when interest rates rise?
Treasury Inflation-Protected Securities carry duration risk, meaning their market prices fall when nominal interest rates rise. If the Federal Reserve raises interest rates aggressively to combat inflation, the discount rate applied to the bond’s future cash flows increases, causing the bond’s current market value to decline, which can easily outweigh the positive principal adjustments from inflation.
This structural vulnerability was vividly illustrated during the monetary tightening cycle, where investors who purchased long-duration inflation-linked vehicles suffered double-digit capital losses. While the principal value of their bonds did adjust upward alongside consumer prices, the concurrent surge in nominal interest rates caused the underlying bond prices to crater. This historical reality has left a scar on institutional balance sheets.
Data tracked by Reuters financial markets desk confirms that long-duration inflation funds experienced drawdowns exceeding 14% during peak tightening windows, completely undermining their status as a low-volatility portfolio anchor.
Federal Reserve Hikes Rates ──> Discount Rate Escalates ──> Bond Prices Decline (Duration Drag)
                                                                       │
                                 Consumer Price Index Rises ──> Principal Adjusts Upward (CPI Lift)
                                                                       │
                         [Net Portfolio Outcome: Duration Drag > CPI Lift = Net Capital Loss]
Furthermore, the structural liquidity of the fixed-income ecosystem creates another headwind. The market for nominal US Treasuries is the deepest and most liquid financial market in the world, facilitating seamless high-frequency execution with minimal transaction costs.
In contrast, the market for inflation-protected bonds is significantly smaller, accounting for less than 10% of total outstanding US sovereign debt. This smaller footprint creates a liquidity premium. During periods of broader market stress or rapid deleveraging, bid-ask spreads on inflation-linked debt can widen rapidly, making it expensive for large macro funds to alter their positions without moving the market against themselves.
The structural headwinds facing these instruments can be categorized across four distinct dimensions:
- Duration Sensitivity: Long maturities leave portfolios highly vulnerable to capital depreciation when the discount rate rises.
- The Phantom Tax Burden: Investors are liable for income tax on the principal adjustments of their bonds in the year they occur, even though they do not receive that cash until the bond reaches maturity.
- Liquidity Disparity: Higher transaction costs and wider bid-ask spreads during market drawdowns relative to nominal sovereign debt.
- Opportunity Costs: Elevated yields on cash and short-term commercial paper provide a compelling alternative for capital preservation without the lock-up period.
Portfolio Implications and Asset Allocation Shifts
The secular shift away from sovereign inflation-linked portfolios is triggering deep second-order effects across global wealth management and corporate balance sheets. For decades, traditional portfolio models relied on a predictable negative correlation between equities and fixed-income assets to balance risk.
When equities fell on growth fears, bonds rallied; when inflation rose, inflation-protected allocations stabilized the fixed-income portion of the book. Still, the current macroeconomic regime has altered this relationship, forcing institutional allocators to alter their approach to risk management.
What follows, however, is a clear rotation of capital into alternative, tangible expressions of inflation defense. Institutional mandates are increasingly bypassing the sovereign debt market entirely, choosing instead to express their inflation anxieties through direct allocations to private credit, physical infrastructure assets, and global commodities.
These asset classes offer direct revenue pass-through mechanisms—such as inflation-indexed commercial real estate leases or utility pricing models—that hedge against rising costs without exposing the investor to the severe duration risk inherent in a 10-year or 30-year sovereign bond.
This trend is reshaping the structural demand for government debt. If institutional investors structurally reduce their allocations to inflation-protected sovereign debt, the US Treasury will be forced to offer higher real yields at future auctions to attract capital. This development would inevitably increase the government’s debt-servicing costs, complicating fiscal policy and putting upward pressure on long-term borrowing costs across the entire consumer economy, from residential mortgages to corporate credit lines.
The Contrarian Case for Real Yields
To maintain journalistic rigor, it is essential to evaluate the counter-position held by a vocal minority of fixed-income purists. While the broader market has cooled on these vehicles, select long-horizon pools of capital—most notably large sovereign wealth funds and ultra-conservative European family offices—are quietly executing substantial accumulation strategies. Their thesis bypasses short-term price volatility, focusing instead on the historic absolute value of current real yields.
The rationale behind this contrarian stance rests on a simple historical comparison: for the better part of the decade following the global financial crisis, real yields on sovereign inflation-linked debt hovered firmly in negative territory, occasionally dropping below minus 1.0%. During that era, investors were effectively paying the government to protect their capital from inflation.
Today, with real yields on 10-year inflation-linked securities holding steady above 2.0%, investors can secure a guaranteed return that beats inflation over a 10-year horizon, backed by the full faith and credit of the sovereign issuer.
For an institution with multi-decade liabilities that must be met in real terms—such as a defined-benefit pension fund or an endowment supporting university research—a guaranteed real return above 2.0% is a highly compelling proposition. These allocators do not trade their portfolios on a weekly or quarterly basis; they intend to hold the securities to maturity.
By removing intermediate market price fluctuations from their calculation, they insulate their portfolios from duration risk while guaranteeing that their capital will outpace consumer price increases, regardless of how high inflation climbs or how disorderly the Federal Reserve’s policy path becomes.
Rethinking Fixed Income in a Higher-Value Regime
The structural disconnect in the inflation-protected bond market reveals a deeper evolution in how modern investors perceive risk. The traditional assumption that an asset’s nominal label dictates its real-world performance has been thoroughly dismantled by the realities of duration volatility and pre-priced inflation premiums. Investors are not ignoring the threat of rising prices; rather, they have recognized that the classical tools used to combat inflation often carry structural vulnerabilities that can worsen portfolio losses during periods of aggressive monetary tightening.
The market has entered a period where structural inflation coexists with elevated interest rates, a combination that fundamentally penalizes passive fixed-income strategies. Moving forward, the boundary line between effective capital preservation and structural wealth erosion will depend on an allocator’s ability to distinguish between absolute protection and relative value.
The era of relying on simple sovereign indexing to protect purchasing power has drawn to a close, leaving market participants with a clear lesson: when defending capital against structural inflation, the price paid for the shield determines whether you survive the battle.
Discover more from The Economy
Subscribe to get the latest posts sent to your email.
This 10-point personal finance checklist—grounded in real data—will actually protect your wealth.
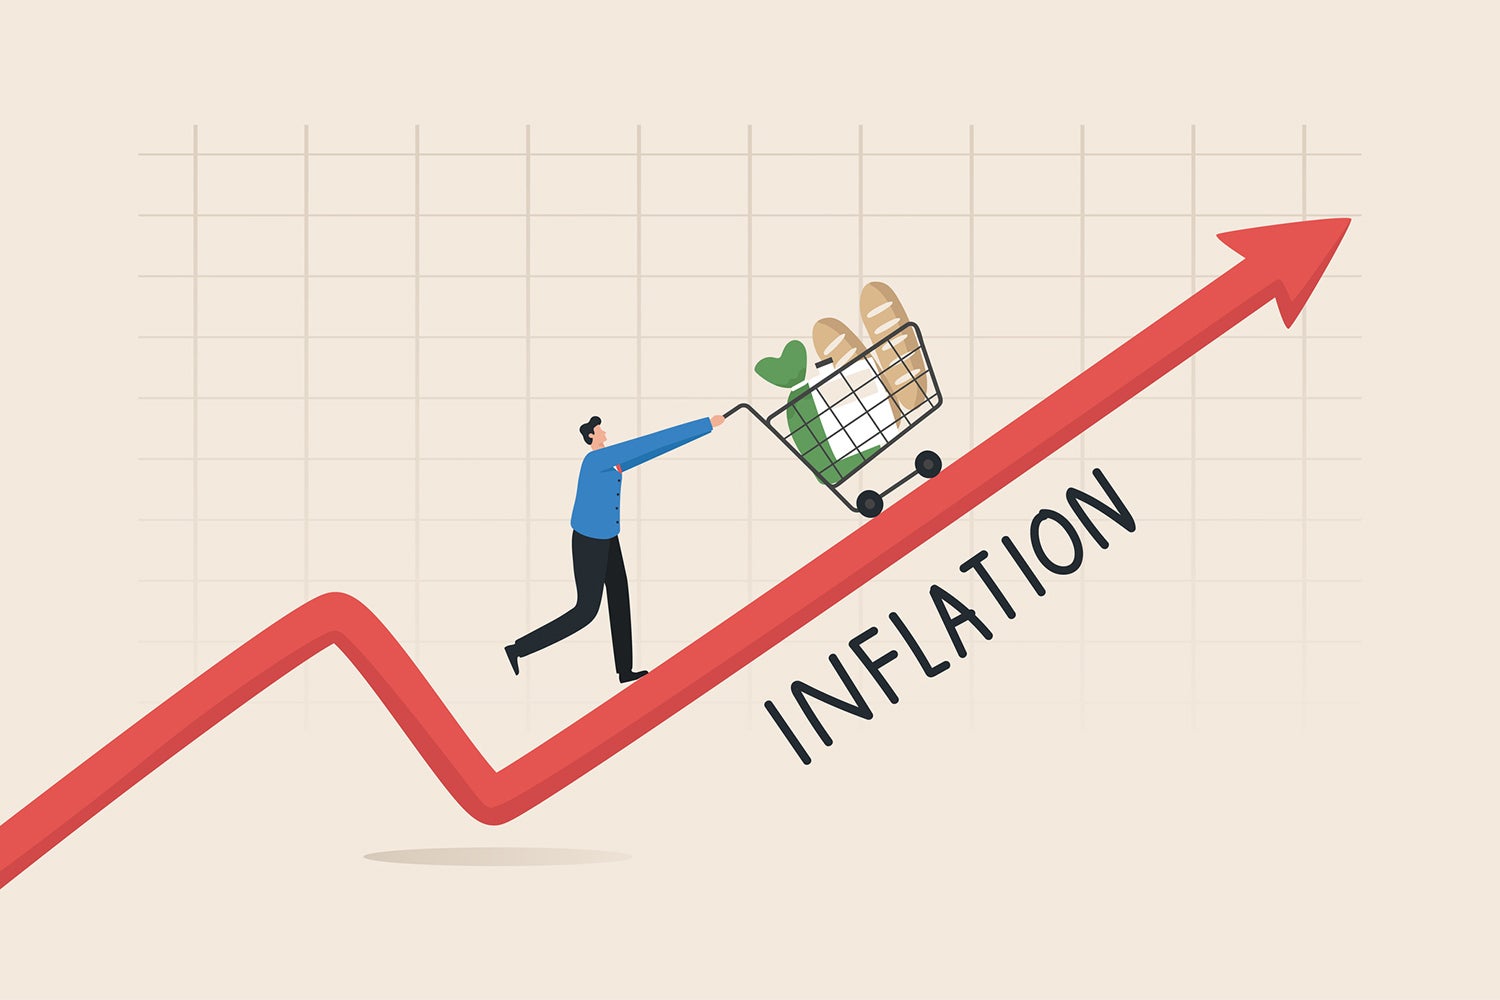
Here is the thing about inflation anxiety: it tends to peak at precisely the wrong moment. Markets lurch. Cable news fills its chyrons with the word “stagflation.” Your neighbour emails you a link to a gold dealer. And somewhere in Washington, a Federal Reserve official who has said “data-dependent” eleven times in the same press conference is being asked, again, whether 2026 will look like 1979.
It will not. But that does not mean you should do nothing.
The US Consumer Price Index for All Urban Consumers rose 2.4 percent over the 12 months to January 2026—a figure that sounds almost quaint after the bonfire years of 2022. Yet beneath that headline sits a persistent ember. Core Personal Consumption Expenditure inflation, the Federal Reserve’s preferred measure, remains above target, and tariffs continue to threaten further goods-price pressure in the months ahead. Meanwhile, oil prices jumped more than 15 percent in a single week in early March 2026 as geopolitical tensions escalated, pushing the 10-year Treasury yield to around 4.14 percent and sending the VIX intraday to 28.15—a sharp reminder that markets can go from “Goldilocks” to “gyrating” in 72 hours.
The good news? Being financially prepped for higher inflation is not complicated. It requires neither a bunker nor a Bitcoin wallet. It requires a clear-eyed checklist, worked through calmly, once. Here is that checklist.
Why Higher Inflation Remains the Base Case in 2026
The story of inflation in 2026 is not a simple repeat of 2021–22’s supply-shock spiral. It is something more structural and, in some ways, more durable.
The Federal Reserve’s own staff projections note that tariff increases are still expected to provide some upward pressure on inflation in 2026, with inflation only projected to reach 2 percent in 2027. The Congressional Budget Office echoes this view: PCE inflation is projected to soften slightly in 2026 to approximately 2.7 percent as the full tariff effect begins to wane, but the return to the Fed’s 2 percent target is not expected until 2030.
The transmission channels are multiple. Import tariffs are repricing goods that households buy every month—consumer electronics, clothing, vehicle parts. Rabobank’s analysis flags that while higher goods prices are being partly offset by lower housing costs, the full impact of import tariffs has yet to materialize, with a meaningful decline in core inflation likely only in the second half of 2026. Shelter, the single largest component of the CPI basket, is cooling—but slowly. And energy is back as a wildcard: Brent crude near $84 a barrel on a single day in March 2026 showed how quickly the inflation channel can re-open via geopolitical shocks.
The picture in Europe is more complex still. The European Central Bank held its key deposit rate at 2 percent in early 2026, acknowledging that the inflation trajectory and wider economic conditions did not warrant a move, but cautioning that the outlook remains unpredictable. In the United Kingdom, the Bank of England cut to 3.75 percent, navigating between four hawks concerned about persistent 3.6 percent inflation and four doves focused on deteriorating labour market conditions.
The net global read: central banks are not rushing to rescue your purchasing power. That job falls to you.
The 10-Point “Financially Prepped for Higher Inflation” Checklist
1. Audit Your Emergency Fund—and Reprice It for 2026 Inflation
The emergency fund calculus has changed. Three to six months of expenses is the conventional benchmark—but which expenses? Most people set their fund target based on what they spent in 2022 or 2023. With the CPI shelter index still rising month-over-month in January 2026 and food costs up modestly too, your monthly burn rate is almost certainly higher today. Recalculate using your last three months of actual bank statements, multiply by six, and hold the result in a high-yield savings account currently yielding 4.5–5.0 percent annually (many online banks remain competitive at this level). This single step ensures your emergency fund for inflation 2026 is calibrated to reality, not memory.
Action: Open a dedicated HYSA. Move any emergency cash earning less than 3.5 percent. Review the target figure every January.
2. Lock in Real Yield With I-Bonds and TIPS
US Treasury I-Bonds adjust their interest rate every six months based on CPI. The composite rate resets each May and November; with headline inflation running above 2.4 percent and a fixed-rate component, current I-Bonds offer a risk-free real return unavailable in cash. The annual purchase limit is $10,000 per person per year (plus $5,000 via tax refunds). Treasury Inflation-Protected Securities (TIPS), available via TreasuryDirect.gov or a brokerage, adjust their principal with CPI and are ideal for amounts exceeding the I-Bond cap. With 10-year Treasury yields stabilising in the 4.10–4.20 percent range, a short-duration TIPS ladder running one to five years provides inflation protection without significant interest-rate risk.
Action: Maximise this year’s I-Bond purchase for every adult in your household. Add a TIPS allocation of 5–10 percent of your fixed-income sleeve.
3. Pressure-Test Your Mortgage or Rent Exposure
Homeowners with fixed-rate mortgages are, structurally, among the few winners in an inflationary environment: their debt shrinks in real terms while their asset appreciates. Mortgage rates stabilised near 6.2 percent in early 2026, creating a significant divide between those locked in below 4 percent and those refinancing or renting today. If you are renting, your landlord’s cost base is rising too—budget for a rental increase of 4–7 percent at your next renewal and build the contingency into your annual plan. Variable-rate mortgage holders should model a 100-basis-point shock to their monthly payment and ensure they can absorb it from savings alone, without touching investments.
Action: Model three mortgage-rate scenarios (flat, +100bp, +200bp) in a simple spreadsheet. Know your break-even point before you need it.
4. Review Your Equity Allocation for Inflation-Resilient Sectors
Not all equities perform equally when prices rise. Historically, energy, materials, consumer staples, and healthcare tend to outperform in inflationary periods because they can pass costs to customers. Utilities and highly leveraged growth stocks tend to underperform when real rates rise. The S&P 500 was up over 1.9 percent year-to-date in early 2026 after gaining 17.9 percent in 2025, but that index-level calm masks significant sector dispersion. Rebalancing into a modest tilt toward value and commodity-linked equities—perhaps 10–15 percent of your equity sleeve—is not a market-timing bet. It is a deliberate hedge against the inflation scenario that remains in play.
Action: Check your current sector weights. If financials, tech, and discretionary collectively exceed 60 percent of your equity exposure, consider a rebalancing conversation with your adviser. [Internal link placeholder: “Best inflation-resistant ETFs for 2026”]
5. Trim Floating-Rate Consumer Debt Immediately
This is the most urgent point on any personal finance checklist inflation 2026 should carry. With the Fed holding the funds rate at 3.50–3.75 percent in January 2026 and markets still pricing only two cuts this year, credit card rates—which track the prime rate—remain north of 20 percent at most US issuers. Carrying a $5,000 balance at 22 percent APR costs you $1,100 per year in interest alone. No investment strategy can reliably beat a guaranteed 22 percent return from eliminating that liability. Prioritise: credit cards, personal loans, then home equity lines of credit. Do it now, before any further tariff-driven price shocks widen the gap between what you earn and what you owe.
Action: Use the avalanche method—pay minimum on all debts, direct every extra dollar to the highest-rate balance first. Set a 90-day target to eliminate credit card balances entirely.
6. Renegotiate Discretionary Subscriptions and Insurance Premiums
Tariffs are feeding into goods prices, and insurance costs—auto, home, and health—have proved particularly sticky, rising faster than headline CPI in recent years. Most households have not reviewed their insurance premiums in 18 months or more. A 30-minute comparison exercise on auto and home insurance could realistically save $400–$800 annually—the equivalent of a half-point raise. Similarly, subscription services have quietly layered on price increases: the average American household now carries 12 active subscriptions, according to C+R Research. Audit your statement, cancel two or three, and redirect the savings to your HYSA.
Action: Set a calendar reminder for this weekend: compare home and auto insurance quotes online. Cancel any subscription not used in 30 days.
7. Negotiate Your Salary—With Inflation Data in Hand
Real wages—earnings adjusted for inflation—have only recently turned positive after being negative for much of 2022–24. The window to recapture lost ground is now. With the CPI running at 2.4 percent over the year to January 2026, asking for a 5–6 percent raise is both defensible and, in a tight labour market, increasingly achievable. The Bureau of Labor Statistics’ own wage tracker and sector-specific salary surveys (LinkedIn Salary, Glassdoor) arm you with the numbers. Walk into the conversation not with emotion but with data: “CPI is X, my sector median is Y, I am at Z—let’s close that gap.”
Action: Research your sector’s current median salary before your next performance review. Frame any ask in real terms, not nominal ones. Every 1 percent of annual salary left on the table compounds significantly over a career.
8. Diversify Into Real Assets—Modestly and Deliberately
Real assets—commodities, timberland, farmland, listed infrastructure—have a historical tendency to maintain or grow in value as prices rise. Gold is the most discussed: spot gold was trading near $5,150 per ounce on March 6, 2026, having reached an all-time high of $5,595 in late January before correcting. A 5–10 percent portfolio allocation to gold via a physically-backed ETF (iShares Gold Trust, SPDR Gold Shares) or commodity-linked fund is a reasonable hedge—not a speculation. Avoid leveraged commodity ETFs, which decay in value over time regardless of the underlying asset’s direction.
Action: Check whether your portfolio holds any real assets. If not, consider a modest gold or broad commodity allocation during the next rebalancing. Hold in a tax-advantaged account if possible.
9. Stress-Test Your Retirement Contributions Against Real Return
The insidious damage of persistent inflation is not what it does to your monthly grocery bill. It is what it does to your retirement projection. A 2.7 percent annual inflation rate over 20 years reduces the real value of a £100,000 or $100,000 nominal sum by more than 40 percent. If your pension or 401(k) statements still project returns in nominal terms without inflation adjustment, you may be significantly overestimating your retirement readiness. Maximise contributions to tax-advantaged accounts—401(k), IRA, ISA, SIPP—where compounding works hardest because taxes are deferred. The 2026 401(k) contribution limit is $23,500 (plus $7,500 catch-up for over-50s), per the IRS.
Action: Ask your pension provider or brokerage to model your projected balance in real, inflation-adjusted terms. Increase your contribution by at least one percentage point this year.
10. Build a “Prices-Paid” Baseline—Know Your Actual Inflation Rate
The CPI is a national average across a diverse population. Your personal inflation rate—shaped by your city, housing tenure, diet, commuting habits, and healthcare consumption—could be meaningfully higher or lower. A Londoner who rents, cycles to work, and eats plant-based food faces a very different price environment from a suburban American who drives, owns a home, and carries private health insurance. Tracking your spending by category for 60 days using a budgeting app (YNAB, Copilot, Emma) reveals your actual exposure. Once you know your personal inflation rate, every item on this checklist becomes more precisely targeted.
Action: Download a budgeting app this weekend. Tag every transaction for 60 days. Calculate your personal CPI. Revisit this checklist with your real number.
The Global Traveller’s Angle—Currency Hedging and the Beat Rising Inflation 2026 Strategy for International Readers
For internationally mobile readers—and for anyone who travels frequently for business or leisure—inflation has a second dimension: currency exposure.
The euro has appreciated nearly 14 percent against the dollar over the last 12 months amid rising concerns over the unpredictability of US economic policy, a shift that has both depressed returns on US-denominated assets held by European investors and made American holidays more affordable for Eurozone travellers. Conversely, the ECB is keeping rates at 2 percent while the Fed continues cutting toward 3 percent by year-end—a narrowing rate differential that many strategists believe will continue to support a stronger euro into the second half of 2026.
Practical tips for the internationally mobile reader:
- Multi-currency accounts. Services like Wise, Revolut, or Charles Schwab’s brokerage account (which refunds all foreign ATM fees) eliminate punitive currency conversion charges. If you travel or pay bills in more than one currency, holding balances in USD, EUR, and GBP simultaneously shields you from conversion-rate timing risk.
- Book flights and hotels in local currency. When booking internationally via platforms like Expedia, always pay in the destination currency rather than accepting dynamic currency conversion—the latter typically embeds a 3–5 percent markup. [Internal link placeholder: “How to avoid hidden FX fees when booking travel in 2026”]
- TIPS and gilts as currency hedges. UK readers holding inflation-linked gilts benefit not only from CPI protection but also from potential sterling appreciation as the Bank of England’s relatively higher rates attract capital inflows.
- Dollar-cost average into foreign equities. Rather than making a single large conversion at today’s rate, systematic monthly purchases of an international equity ETF spread your currency entry points over 12 months, reducing the risk of buying at a EUR/USD peak.
What NOT to Do—The Four Mistakes Most People Make When Inflation Rises
1. Panic-selling equities for cash. Cash appears safe when markets gyrate, but it is the one asset class guaranteed to lose real value when inflation runs above your savings rate. Bonds delivered positive performance in 2025 with most traditional bond categories returning 6–8 percent—far ahead of cash—demonstrating that patience within a diversified portfolio outperforms reactionary moves.
2. Overloading on commodities. Gold at $5,150 is not cheap. A 5–10 percent portfolio allocation is prudent. Forty percent is a bet. The same logic applies to oil futures, agricultural commodities, and Bitcoin—all of which are significantly more volatile than inflation itself and can inflict real losses at precisely the moment you cannot afford them.
3. Ignoring the denominator. Focusing exclusively on investment returns while ignoring spending inflation is a common mistake. A portfolio growing at 7 percent nominally while your personal cost of living rises 5 percent produces only a 2 percent real gain. The checklist above deliberately addresses both sides of that equation.
4. Waiting for certainty. The Fed’s own policymakers acknowledged that rising tariff revenue could push goods inflation higher in coming months while simultaneously signalling a data-driven approach to rate decisions. There is no clarity coming soon. The households who navigate this environment best will be those who act on incomplete information—systematically, unemotionally, and early.
Conclusion
The most dangerous response to an inflationary environment is paralysis—scrolling through market data, refreshing portfolio apps, waiting for the Federal Reserve to solve a problem that monetary policy alone cannot fully address. The households that will emerge from this period financially stronger are not the ones who predicted the next CPI print correctly. They are the ones who quietly built up their emergency buffers, locked in real yields, eliminated high-cost debt, and understood their own spending well enough to know where they were genuinely exposed.
Higher inflation is not an emergency. It is a context. Work through this list, one item per weekend if you prefer, and you will arrive at the end of 2026 in materially better financial shape—regardless of what the central banks decide to do.
Because the best hedge against an uncertain price level is a clear-eyed personal balance sheet.
Discover more from The Economy
Subscribe to get the latest posts sent to your email.

Kevin Warsh Wants the Fed to Stop Explaining Everything

UK Japan Investment Agreement: Inside the £18bn Deal

AI Fundraising Trends: Wall Street’s Record Capital Influx

China Tungsten Export Curbs: Is Japan’s AI Chip Supply at Risk?

Pakistan Textile Body Welcomes FY27 Budget, Seeks FTR

US Economic Resilience: Why the Economy Keeps Defying the Odds

Global Strategic Oil Reserves Depletion: The Empty Vaults

Dubai Consumer Protection: 155,000+ Inspections Secure Price Stability

18% Shipping Sales Tax Abolition Sparks Maritime Economy Growth

Bank Indonesia Rate Hike 2026: New Mandate’s First Market Test

The Silicon Silk Road: How Memory Chips Rewrote the Retail Map

France opposes ‘anglicisation’ of EU trade talks

Anthropic Suspends Latest AI Models After US Blocks Foreign Access

Goldman and JPMorgan Ease Office Working Rules to Counter World Cup Disruption

China Overhauls the World’s Biggest Surveillance Network with Advanced AI

Kevin Warsh Takes the Fed’s Helm — and Walks Straight Into a Rate-Hike Storm

S&P 500 Slips Back to 7,408 as Oil Storms Past $109, Bond Yields Clock 19-Year Highs

SpaceX IPO: Inside the $2 Trillion Market Debut

SpaceX, OpenAI & Anthropic IPOs: Wall Street’s $200B AI Test

How AI Is Forcing McKinsey and Its Peers to Rethink Pricing

KPMG Australia CEO Resigns After Whistleblower Claims Exposed Investigation Failures

Pakistan Budget FY 2026-27: Relief, Prospects, and the Tightrope Walk

Broadcom Market Value Loss: Revenue Forecast Disappoints

The Guardrails Are Down: How Meta and Google’s AI Models Fold Under Pressure

Is AI Already Putting Graduates Out of Work? The Grim Reality Facing the Class of 2026

Stock Market Correction Risk Mounts as Bond Yields Defy the Bull Case

Five PSX Stocks Worth Owning Before the Second Quarter Ends

Benefitbay Raises $18M to Build the Plumbing for America’s ICHRA Shift
-

 Markets & Finance5 months ago
Top 15 Stocks for Investment in 2026 in PSX: Your Complete Guide to Pakistan’s Best Investment Opportunities
-

 Analysis4 months ago
Top 10 Stocks for Investment in PSX for Quick Returns in 2026
-

 Analysis4 months ago
Brazil’s Rare Earth Race: US, EU, and China Compete for Critical Minerals as Tensions Rise
-

 Banks5 months ago
Best Investments in Pakistan 2026: Top 10 Low-Price Shares and Long-Term Picks for the PSX
-

 Investment5 months ago
Top 10 Mutual Fund Managers in Pakistan for Investment in 2026: A Comprehensive Guide for Optimal Returns
-

 Analysis4 months ago
Johor’s Investment Boom: The Hidden Costs Behind Malaysia’s Most Ambitious Economic Surge
-

 Global Economy6 months ago
15 Most Lucrative Sectors for Investment in Pakistan: A 2025 Data-Driven Analysis
-

 Global Economy6 months ago
Pakistan’s Export Goldmine: 10 Game-Changing Markets Where Pakistani Businesses Are Winning Big in 2025