
Analysis
Full Planes, Empty Margins

How Asia-Pacific Airlines Are Riding Iran War Reroutes into a Fuel-Cost Storm
Imagine booking a flight from Sydney to London in early March 2026. Your usual routing through Dubai — once among the world’s most seamless long-haul connections — is no longer available. Qatar Airways has suspended half its operations. Emirates is flying at reduced capacity on a skeleton schedule. A travel agent, barely keeping pace with rerouting requests, books you instead through Singapore. The seat costs 22% more than it would have a year ago and the journey takes three hours longer. And yet the plane is completely full.
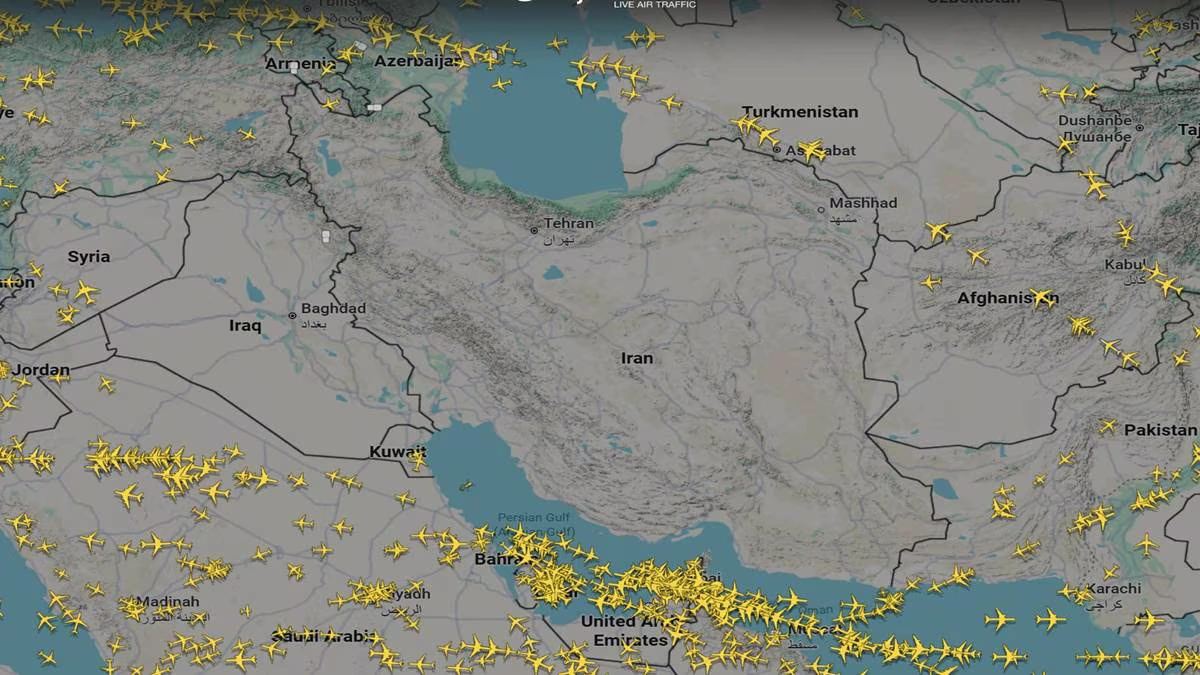
That traveller’s inconvenience is, for the moment, Asia-Pacific aviation’s unexpected windfall. The outbreak of hostilities between the United States, Israel and Iran in late February 2026 — and the near-total disruption it wrought across Gulf airspace — has delivered APAC carriers their highest international passenger load factors on record. But beneath the optics of full aircraft lies a far more precarious financial reality: jet fuel prices have roughly doubled since the conflict began, eroding the very margins that record seat occupancy was supposed to protect.
This is the paradox now confronting Singapore Airlines, Cathay Pacific, Korean Air, Qantas, and their regional peers. They are, by any surface measure, thriving. In fact, they are doing so under conditions that could quietly hollow out their profitability — and reshape the global aviation hierarchy in ways that outlast the war itself.
The Load Factor Windfall from Rerouted Skies
The numbers are striking. According to preliminary March 2026 data released by the Association of Asia Pacific Airlines (AAPA), the region’s carriers carried 33.9 million international passengers in March — an 8.5% increase year on year. More significantly, revenue passenger kilometres surged 11.3%, dramatically outpacing a mere 1.9% rise in available capacity. The result was an average international passenger load factor that climbed by approximately 7.4 percentage points to a record-breaking 87.6%.
To contextualise that figure: in January 2026, the load factor stood at 82.8%. In February — already buoyed by post-Lunar New Year travel — it reached 83.4%. The leap to 87.6% in March represents an acceleration without modern peacetime precedent in APAC aviation history, and it is almost entirely attributable to geopolitical displacement.
“Asia Pacific airlines responded swiftly by making network adjustments, including adding flights on key Asia–Europe routes, and trimming unprofitable routes in the face of higher fuel and operating costs.” — Wong Hong, AAPA Director General
Wong Hong, the association’s incoming Director General — a former Delta Air Lines executive who assumed the role on 1 April — noted that carriers moved quickly to fill the capacity gap left by disrupted Gulf operators. The AAPA statement acknowledged that while the data reflected strong travel demand, “the duration of the Middle East conflict is going to add uncertainty to the global economic outlook and air travel demand” — a notably measured phrasing for what is, in traffic terms, an extraordinary performance.
The carrier-level data is even more telling. Singapore Airlines Group — comprising mainline SIA and low-cost unit Scoot — carried 3.8 million passengers in March, a 14.9% year-on-year increase and the highest monthly volume in the group’s history. Group traffic rose 14.7%, against capacity growth of just 7.2%, lifting the group load factor to 90.6%. On European routes specifically, Singapore Airlines’ seat occupancy surged to 93.5% from 79.7% the prior year — a near-fourteen-percentage-point leap that speaks to the structural demand now flowing through Changi Airport.
Cathay Pacific mounted additional flights to London and boosted frequencies to Zurich. Korean Air reported a 47.3% rise in first-quarter operating income to 517 billion won (approximately $349 million), with passenger revenue on European routes climbing 18% year-on-year. Qantas reallocated capacity toward Paris and Rome. According to Airservices Australia, traffic between Australia and the Middle East collapsed by 77% year-on-year in March as routes were increasingly diverted through Singapore, Kuala Lumpur, Hong Kong, Tokyo and Seoul.
Before the conflict, Gulf carriers — Emirates, Qatar Airways and Etihad — collectively accounted for roughly one-third of Asia-Europe passenger traffic, according to aviation analytics firm Cirium, and facilitated more than half of travellers flying onward to Australia, New Zealand and Pacific destinations. That structural reality has, in the space of weeks, been upended.
When Full Planes Don’t Mean Fat Profits
The fuel reckoning arrived almost simultaneously with the demand surge, and it is brutal. Since the outbreak of hostilities on approximately 28 February 2026, jet fuel prices have roughly doubled, driven by the near-total closure of the Strait of Hormuz — the chokepoint through which approximately 20% of global oil flows, including the refined petroleum products that power the world’s aircraft. Spot prices moved from roughly $96 per barrel before the conflict to as high as $197.
The damage extends well beyond the headline crude price. In Asian markets, the refining margin — the differential between crude oil and jet fuel — surged from approximately $21 per barrel before the conflict to as high as $144 per barrel before easing to around $65, still far above historic norms. This, as analysts at Aerotime noted, has created a particularly acute problem: most airline hedging programmes are tied to crude oil benchmarks — not jet fuel specifically. When refining margins spike independently of crude, even well-hedged carriers find their protection partially ineffective.
Cathay Pacific’s Chief Financial Officer Rebecca Sharpe acknowledged the mismatch directly, noting that while the airline hedges crude oil, those contracts cannot fully offset the spike in jet fuel costs. Cathay responded by announcing a fuel surcharge increase, noting that the price of jet fuel had “approximately doubled since March amid the latest developments in the Middle East.” Air India introduced surcharges of up to $50 on tickets to Europe, North America and Australia. Air France-KLM signalled economy fare increases of approximately 50 euros on long-haul routes.
For the Asia-Pacific carriers specifically, the compounding factor is geographic. Long-haul routes between Asia and Europe already consume extraordinary volumes of fuel per sector. When airlines are simultaneously required to reroute around closed airspace — adding two to four hours of flight time on the Central Asia and Azerbaijan corridors that have replaced the Middle East overflights — the fuel penalty per departure escalates sharply. Payload restrictions sometimes follow, reducing cargo revenue that partially offsets passenger economics.
Fuel typically accounts for 20–35% of an airline’s operating costs. At current prices, many flights booked before the conflict are now losing money on every departure.
In the United States, Delta Air Lines — which owns a downstream refinery and is therefore more insulated than most — still estimated an additional $2 billion in fuel costs for the current quarter alone. For APAC carriers without Delta’s refinery buffer, and many without any meaningful hedging programme, the arithmetic of a full plane at double fuel cost is deeply uncomfortable. A seat sold three months ago at pre-conflict fare levels may now represent a loss when the fuel bill is settled.
Qantas, which hedged 81% of fuel for the second half of its financial year ending June 2026, sits in a comparatively protected position. As the Aviation Week Q2 overview noted, one low-cost carrier in the region disclosed that fuel costs had “more than doubled” compared with 2025 averages — a stark signal of what the unhedged, thin-margin end of the industry is absorbing.
Geopolitical Shocks and Aviation’s New Normal
The European Union Aviation Safety Agency extended its airspace avoidance warning in late March 2026, maintaining advisories against overflying Iran, Israel and parts of the Gulf through at least early April. Whether that advisory becomes the operational template for summer 2026 is the central question facing network planners from Seoul to Sydney.
The Gulf carriers — Emirates, Qatar Airways, Etihad — have begun restoring operations, reaching approximately 60% of pre-conflict flight levels according to Flightradar24 data. But travel advisories, including Australian government warnings against transiting through parts of the Middle East, have dented passenger confidence in ways that may outlast physical restoration of capacity. Perception, once recalibrated, is slow to revert.
This opens a genuinely structural question. Singapore, Hong Kong, Seoul, Kuala Lumpur and Tokyo are consolidating positions as alternative transit hubs, capturing displaced demand with infrastructure — Changi’s terminal capacity, Incheon’s connectivity, Hong Kong’s historical Europe network — that can absorb diverted traffic at scale. If this redirection persists for even one additional season, the competitive topology of Asia-Europe aviation will be materially altered.
The AAPA’s Wong Hong was measured but direct in his warning: the war has “begun to weigh on what had been an encouraging start to the year.” Airlines were already navigating persistent supply chain disruptions — engine delivery delays from Pratt & Whitney and Rolls-Royce, ongoing Boeing production shortfalls — before fuel doubled. The stacking of these headwinds is not merely additive; it is multiplicative in its pressure on operational decision-making.
There is also a dimension that rarely surfaces in traffic reports: the accelerating decarbonisation agenda. Sustainable aviation fuel, already expensive, has become even more relatively accessible as conventional jet fuel prices spike — a perverse incentive structure that could hasten SAF adoption among carriers with the balance sheet to experiment. But for airlines already squeezed by fuel costs, capital for SAF investment is harder to justify quarter-by-quarter.
Broader Implications: Passengers, Industry, and the Geopolitics of Connectivity
For passengers, the near-term arithmetic is straightforward and unwelcome. Fares on Asia-Europe routes are rising — whether through explicit fuel surcharges or through the quiet disappearance of discounted inventory. Routes that bypassed Middle Eastern hubs were already premium-priced before the conflict; they are more so now. Leisure travellers willing to absorb longer routings and higher prices will find seats. Those who cannot will simply defer or cancel, and there are early signals — particularly in budget leisure travel — that demand is beginning to soften at the margin.
For the industry, the episode is a stress test of differentiation. Carriers with fuel hedging programmes, efficient long-range fleets — the Airbus A350 and Boeing 787 families dominate the Asia-Europe long-haul landscape — and robust cargo revenue streams are absorbing the shock better than those without. Carriers with strong premium cabin economics are better placed to pass costs through to travellers. Low-cost carriers, particularly those operating thinner international routes without hedging cover, face the most acute pressure.
The concentration of winners is instructive. Singapore Airlines, Cathay Pacific, Korean Air and Qantas have structural advantages: established Europe networks, strong brand positioning in premium cabins, and — particularly for SIA and Cathay — hub airports that sit geographically advantaged relative to the new routing corridors. That advantage is not unlimited. Fleet availability and airport slot constraints cap how rapidly additional European capacity can be deployed, even when demand is willing to pay for it.
At the geopolitical level, this moment exposes the fragility of just-in-time global connectivity. The Asia-Europe air corridor — roughly 70% of which transited or overflew Middle Eastern airspace before the conflict — was never meaningfully stress-tested against a scenario of sustained Gulf disruption. The pandemic revealed vulnerabilities in supply chains; this conflict is revealing vulnerabilities in the physical geography of long-haul aviation networks. A more distributed set of transit hubs — Singapore, Kuala Lumpur, Istanbul, Tokyo — may be the industry’s unplanned but rational response.
Strategic Outlook: Resilience with Eyes Open
For airlines: the priority must be margin discipline over market share. Adding capacity to Europe to capture displaced demand is rational only if the fuel economics are stress-tested at current price levels — not pre-conflict assumptions. Airlines with natural hedging advantages (geographic fuel sourcing, owned refining, diversified revenue) should lean into them. Those without must rebuild hedging programmes that cover jet fuel specifically, not merely crude benchmarks. The crack spread risk exposed by this crisis is not going away.
For policymakers: the AAPA has already called on governments to consider support measures for airlines facing “additional strain.” The more durable policy intervention, however, is strategic fuel reserve infrastructure — particularly in Asia, where import dependence on Gulf-origin crude is a systemic vulnerability. Australia, which imports approximately 90% of its refined fuel, is the most exposed in the region. The conflict has made visible a supply chain risk that policymakers tolerated for years because the probability felt remote.
For investors: the current load factor surge is real and should not be dismissed — record seat occupancy, particularly on premium-weighted Asia-Europe routes, does support near-term revenue. But margin expansion is a different story. Watch hedging disclosures in upcoming Q1 and Q2 earnings reports carefully; the gap between carriers with meaningful fuel protection and those without will widen if the conflict persists through the summer peak season. Carriers with strong cargo businesses — Singapore Airlines, Cathay Pacific — have an additional margin buffer worth pricing in.
Asia-Pacific aviation’s current moment is not a triumph of strategy. It is a beneficiary of someone else’s disruption — and the fuel bill has already arrived.
Conclusion: The Uncertain Altitude of a Structural Moment
March 2026 will be recorded as a month of extraordinary performance for Asia-Pacific carriers. The traffic figures are genuine, the demand was real, and the pivoting of global travel patterns toward Singapore, Hong Kong and Seoul reflected authentic competitive strengths — not simply good fortune.
But the moment is suspended between two realities. On one side: the structural opportunity that a sustained Middle East disruption creates for APAC hubs, with implications for network architecture, bilateral traffic rights, and global aviation hierarchies that could persist long after the Strait of Hormuz reopens. On the other: a fuel cost environment that, if it persists at or near current levels through summer, will convert record load factors into deeply disappointing profit statements.
Aviation has always been a business in which the best-managed carriers survive geopolitical shocks by being prepared for them in advance — through hedging, fleet efficiency, network diversification, and balance sheet discipline. The Iran war has applied those tests simultaneously. The results, when full earnings are disclosed, will reveal which of Asia-Pacific’s carriers have genuinely built resilient enterprises — and which were merely, as the metaphor goes, flying on fumes.
Discover more from The Economy
Subscribe to get the latest posts sent to your email.



Navigating Mortgage and Loan Refinancing in a High-Yield Environment
Global public debt crossing critical thresholds has kept central bank policies volatile, resulting in fluctuating US Treasury yields throughout 2026. For homeowners and commercial property holders burdened by previous high-interest borrowing cycles, finding optimal refinance windows has become a high-stakes financial puzzle. Stalled disinflation and stubborn employment numbers mean rate cuts are incremental, requiring borrowers to act with precision.
Timing your mortgage or commercial loan refinance in this environment requires a deep understanding of yield curve movements and lender risk appetites.
Decoding 2026 Refinance Dynamics
The 10-Year Treasury Yield Benchmark
Mortgage rates continue to track closely with the 10-year US Treasury yield. When macroeconomic anxiety spikes debt issuance, yields rise, tightening consumer borrowing capacity. Savvy borrowers monitor weekly Treasury auctions to lock in rates during brief dip windows.
Hybrid ARMs and Alternative Structures
With fixed rates remaining elevated, 7/1 and 10/1 adjustable-rate mortgages (ARMs) have surged in popularity. These products offer lower initial monthly payments, giving borrowers breathing room until central bank easing cycles fully materialize.
| Loan Product | Current Rate Range | Best For | Key Risk Factor |
| 30-Year Fixed Mortgage | 6.2% – 6.8% | Long-term predictability | Higher initial monthly outlay |
| 7/1 Hybrid ARM | 5.5% – 5.9% | Short-term ownership / flipping | Rate reset risk after year 7 |
| Commercial Refinance | 7.0% – 8.2% | Corporate asset restructuring | Strict DSCR lender covenants |
Actionable Steps for Successful Refinancing
To maximize your chances of securing favorable refinance terms in a volatile market, follow a disciplined preparation strategy.
Boost Your Credit Score Immediately: Lenders in 2026 are applying stringent credit tiering; a 20-point increase can drop your APR by a crucial quarter-point.
Shop Regional Credit Unions: Smaller financial institutions often offer portfolio loans with more flexible underwriting than major national banks.
Calculate the Break-Even Point: Ensure your total closing costs are recouped through monthly savings within 24 months of closing.
“Market Strategist View: Refinancing in 2026 is an exercise in opportunistic timing. Borrowers must maintain immaculate financial profiles ready to strike the moment Treasury yields dip.”
Mastering the complexities of today’s debt environment ensures you can successfully lower your debt service costs and protect your long-term financial stability.
Discover more from The Economy
Subscribe to get the latest posts sent to your email.

The days of pulling generic auto insurance quotes based purely on your zip code and age are officially over. In 2026, insurance comparison engines are powered entirely by generative AI and real-time telematics. These platforms digest thousands of live data points—ranging from your driving smoothness via connected vehicle sensors to real-time traffic congestion patterns—to generate hyper-personalized premiums instantly.
For consumers, this evolution represents both a massive opportunity for savings and a hidden trap for penalty pricing. Understanding how AI algorithms evaluate risk is essential for anyone looking to lower their monthly auto insurance premiums.
How AI Comparison Engines Evaluate Your Risk Profile
Behavioral Telematics and Connected Cars
Modern cars stream performance data directly to insurance aggregators. Generative AI models analyze braking sharpness, acceleration curves, cornering G-forces, and phone distraction metrics. Drivers who maintain smooth, defensive habits are rewarded with dynamic rate cuts of up to 40% compared to traditional rating tiers.
Predictive Traffic and Weather Modeling
AI tools now cross-reference your daily commute route with predictive weather and accident probability models. If your standard parking location or driving corridor has a statistically higher incidence of uninsured motorist claims, your quotes will reflect that hyper-local risk assessment.
| Comparison Factor | Traditional Rating Model | 2026 Generative AI Model | Impact on Premium |
| Mileage & Usage | Annual estimated odometer reading | GPS tracking & live trip duration | High (up to 35% savings) |
| Driving Behavior | MVR driving record & accidents | Real-time braking, speed, & G-force | Critical (determines tier) |
| Vehicle Tech | Make, model, and safety rating | ADAS calibration & repair cost data | Moderate |
Strategies to Lower Your AI-Driven Insurance Quote
To outsmart the algorithm and secure the lowest possible premium in 2026, drivers must proactively manage their digital footprint on insurance platforms.
Opt-In for Telematics Trial Periods: Many insurers offer immediate 15% discounts just for installing their driving app; let it track safe habits for 30 days to lock in permanent savings.
Scrub Unverified Public Records: Ensure your motor vehicle report is free of clerical errors that AI risk models misinterpret as reckless behavior.
Compare AI Aggregators: Use platforms that integrate multi-carrier API feeds rather than single-brand comparison sites to find the best risk-adjusted rate.
“Industry Note: AI-driven pricing rewards transparency and precision. Drivers who actively manage their telematics data consistently out-save those relying on legacy quote calculators.”
Embracing AI comparison tools allows savvy policyholders to customize coverage limits precisely to their driving habits, eliminating wasted premium spend while ensuring robust protection.
Discover more from The Economy
Subscribe to get the latest posts sent to your email.

Despite decades of bans and strict handling mandates, asbestos remains a silent killer across legacy manufacturing plants, shipyards, and modern green-energy infrastructure retrofits. In 2026, regulatory changes by the EPA and tightened occupational health standards have triggered a fresh wave of mesothelioma litigation. Manufacturers attempting to fast-track industrial transitions are encountering catastrophic oversight, exposing workers to legacy toxins and opening corporate parent companies to unprecedented liability.
Navigating a mesothelioma claim in 2026 requires understanding how modern industrial supply chains intersect with historical exposure. Trusts established decades ago are being audited under stricter transparency laws, altering payout ratios and accelerating fast-track settlements for terminally ill plaintiffs.
Modern Industrial Exposure Hotspots
Green Retrofitting and Renewable Energy Infrastructure
A primary source of 2026 asbestos exposure occurs during the decommissioning and retrofitting of older industrial facilities for renewable energy production. Workers insulating electrical grids, modernizing HVAC systems, or upgrading manufacturing floors frequently disturb encapsulated asbestos materials that were improperly documented or ignored during facility audits.
Automotive and Aerospace Supply Chains
With advanced manufacturing booming, workers handling specialized friction materials, gaskets, and heat shields face ongoing risks. Supply chain tracing has become more sophisticated, allowing legal teams to pinpoint exact corporate entities responsible for raw material distribution across multinational borders.
| Industry Sector | Primary Exposure Risk | Legal Venue / Trust | Avg. Claim Value Range |
| Green Energy Retrofit | Disturbed insulation, pipe lagging | Federal Tort / Manufacturer Trust | $1.2M – $3.5M |
| Shipbuilding & Marine | Boiler insulation, structural seals | Asbestos Bankruptcy Trusts | $800K – $2.4M |
| Automotive Manufacturing | Brake components, high-heat gaskets | Third-Party Product Liability | $600K – $1.8M |
Securing Maximum Compensation: Steps for Plaintiffs
Time is of the essence in mesothelioma cases. Plaintiffs and their families must act decisively to secure financial recovery before statutes of limitations expire.
Retain Specialized Counsel: Work exclusively with national mesothelioma law firms possessing deep historical databases of asbestos-containing products.
Audit Employment History: Document every job site, supervisor name, and equipment brand encountered throughout your career.
Expedite Medical Filings: Secure a formal pathological diagnosis quickly to qualify for expedited trust fund distribution and priority trial settings.
“Expert Insight: Modern asbestos litigation is no longer just about historical tracking; it is about holding modern corporations accountable for failing to conduct rigorous environmental safety audits before initiating industrial retrofits.”
By combining meticulous work history reconstruction with aggressive multi-trust filings, victims can secure substantial financial relief to cover specialized immunotherapy and family support.
Discover more from The Economy
Subscribe to get the latest posts sent to your email.

Balance of Payments (BOP)

The Falkland Islands Dispute: Sovereign Wealth, Offshore Drilling, and Market Impacts

Gross Domestic Product (GDP): Nominal vs. Real

What is Inflation and the Consumer Price Index (CPI)?

US-China Trade Competition 2026: Supply Chain Relocation Guide

Oil Prices Break $100 in 2026: Middle East Conflict & Energy Markets

South-South Trade Expansion: Digital Integration and Emerging Market Growth

$166B Tariff Refund Tapering Fast: Is Your Business Missing Out?

Stock Market Today: Dow Climbs 500 Points as Markets Shake Off Inflation Jitters

14th WTO Conference 2026: Tariffs & Global Supply Chain Impact

Swish Secures $24M Funding to Disrupt India’s $100B Food Market

Physical AI and Driverless Tech: The Next Trillion-Dollar Industrial Revolution

Enterprise AI Platforms Disrupting B2B SaaS in 2026: Full Analysis

Crypto vs. Safe Haven Assets 2026: Where Institutions Are Hedging

State Farm’s $5B Dividend 2026: Who Qualifies & Payout Dates

US-China Relations in Q3 2026: Trade Tariffs and Supply Chain Risks

Gold’s Wild 2026: From a Record $5,600 Peak to a 24% Crash and Back Toward $4,500

Oil Surges as Strait of Hormuz Traffic Collapses Again

The Rocket That Won’t Quit: Inside SpaceX’s Falcon 9 Launch Machine

Bank of England Set to Hold Rates Through Year-End, Reuters Poll Shows

SpaceX Starship Flight 14: First Orbital Attempt & Starlink V3 Launch Explained

The 2026 Crypto Regulatory Shift: What It Means for Institutional Investors

AI Chip Stocks 2026: The Best Semiconductor Investments Beyond Marvell

Retail Earnings Week: What Home Depot, Target & Walmart Reveal

AI-Powered Training: The Next Multi-Billion Dollar Ecosystem in Fitness

Russia’s Black Sea Oil Exports Fall for a Fifth Straight Week

Global Chip Selloff Deepens: What’s Driving the Aug. 19 Semiconductor Rout

Tween Back-to-School Trends 2026: What’s Driving the $85B Season
-

 Markets & Finance8 months ago
Top 15 Stocks for Investment in 2026 in PSX: Your Complete Guide to Pakistan’s Best Investment Opportunities
-

 Analysis7 months ago
Johor’s Investment Boom: The Hidden Costs Behind Malaysia’s Most Ambitious Economic Surge
-

 Analysis7 months ago
Top 10 Stocks for Investment in PSX for Quick Returns in 2026
-

 Analysis7 months ago
Brazil’s Rare Earth Race: US, EU, and China Compete for Critical Minerals as Tensions Rise
-

 Banks8 months ago
Best Investments in Pakistan 2026: Top 10 Low-Price Shares and Long-Term Picks for the PSX
-

 Investment8 months ago
Top 10 Mutual Fund Managers in Pakistan for Investment in 2026: A Comprehensive Guide for Optimal Returns
-

 Global Economy9 months ago
15 Most Lucrative Sectors for Investment in Pakistan: A 2025 Data-Driven Analysis
-

 Global Economy9 months ago
Pakistan’s Export Goldmine: 10 Game-Changing Markets Where Pakistani Businesses Are Winning Big in 2025