
Business
How AI Is Reshaping the Future of Global Business Analytics


Almost every large company is experimenting with AI, and almost none can yet prove it moved the profit line. That gap is the real story of business analytics in 2026.
Key Takeaways
- Adoption is broad, scale is not. In McKinsey’s latest global survey, 62% of respondents said their organizations are at least experimenting with AI agents, but no more than 10% reported scaling agents in any single function (McKinsey).
- Winners are rare and deliberate. About 6% of respondents qualify as “AI high performers,” attributing 5% or more of EBIT to AI and reporting significant value (same McKinsey survey).
- Efficiency is the common goal; growth is the differentiator. Eighty percent say they set efficiency as an objective, but the biggest gainers often add growth or innovation targets too (McKinsey).
- Analytics is shifting from reports to conversations and actions. The change is less about prettier dashboards and more about who can ask questions of data and how fast answers arrive.
| Era | How analytics worked | What changed |
|---|---|---|
| Descriptive BI | Analysts build dashboards | Fast reporting, limited foresight |
| Predictive models | Data scientists forecast demand, churn, risk | Better planning, but specialist-dependent |
| Generative AI | Anyone asks questions in natural language | Wider access to insight |
| Agentic AI | Systems monitor data and take defined actions | Analysis connected to execution |
From Dashboards to Decisions
Traditional business intelligence answered “what happened.” AI-driven analytics tries to answer “what will happen, why, and what should we do?”
The shift shows up in four places:
- Forecasting. Models ingest more signals (pricing, weather, logistics, macro data) to sharpen demand and cash-flow forecasts.
- Anomaly detection. Systems flag unusual transactions, supplier delays, or margin leaks before a human spots them.
- Natural-language querying. Staff ask questions in plain language rather than waiting in an analyst queue.
- Automated action. Agents trigger workflows, such as reordering stock or escalating a risk, within guardrails.
The Reality Check
McKinsey describes a landscape of wider use alongside “stubborn growing pains,” with the move from pilots to scaled impact still a work in progress at most organizations (McKinsey).
Common reasons projects stall:
- Messy data. Models are only as good as the inputs.
- Unclear ownership. No executive is accountable for the business result.
- Workflows left unchanged. AI is bolted onto old processes rather than redesigning them.
- Trust gaps. Leaders hesitate to act on outputs they cannot audit.
What High Performers Do Differently
McKinsey’s high performers share traits worth copying (McKinsey):
- They push for transformative innovation rather than only cost cutting.
- They redesign workflows instead of automating existing ones.
- They scale faster and invest more.
- They use AI across more business functions.
- They have advanced further with AI agents.
Global Considerations
Multinational analytics adds complications that single-market firms avoid:
| Challenge | Why it matters |
|---|---|
| Data residency and privacy rules | Different regions restrict where data can be stored and processed |
| Currency and inflation effects | Forecast models must handle multi-currency volatility |
| Language and local context | Models trained mostly on English data may underperform locally |
| Regulatory divergence | AI governance rules differ across jurisdictions |
| Talent distribution | Skills are concentrated in a few hubs |
How to Build an AI Analytics Roadmap
- Start with a decision, not a tool. Pick one high-value decision (pricing, credit risk, inventory) and measure it.
- Fix the data first. Clean, governed data beats a fancier model.
- Keep a human in the loop for high-stakes calls until accuracy is proven.
- Define the metric. Tie the pilot to revenue, margin, or cost, not “usage.”
- Redesign the workflow. Change who does what, not just which software they use.
- Plan governance early. Document model sources, approvals, and audit trails.
- Scale only what pays. Kill pilots that do not move a number.
Costs and ROI: A Simple Framework
Estimate return as: (annual benefit − annual run cost) ÷ total investment. Benefits include hours saved, errors avoided, and revenue lift; costs include licenses, cloud compute, integration, and training. Be conservative: McKinsey’s data shows efficiency gains are common but enterprise-level profit impact is much rarer.
Risks to Manage
- Inaccuracy. Generative outputs can be confidently wrong; verify before acting.
- Bias. Historical data can encode unfair patterns.
- Security. Sensitive data fed into tools needs controls.
- Overreliance. Skills atrophy when teams stop questioning outputs.
Frequently Asked Questions
How is AI changing business analytics?
It moves analytics from static reports toward forecasting, plain-language querying, and automated actions.
What percentage of companies use AI agents?
In McKinsey’s survey, 62% were at least experimenting, and no more than 10% were scaling them in any one function (McKinsey).
Who are “AI high performers”?
Organizations attributing 5% or more of EBIT to AI and reporting significant value; about 6% of respondents (McKinsey).
Why do AI projects fail to scale?
Poor data, unclear ownership, unchanged workflows, and weak governance.
What should a company do first?
Choose one measurable decision, fix the underlying data, and pilot with a human in the loop.
The companies that win with AI analytics will not be the ones with the most dashboards. They will be the ones that let the answer change what they do on Monday morning.
Discover more from The Economy
Subscribe to get the latest posts sent to your email.


Business
US 10-Year Yield Hits 5.24%: What the Historic Bond Market Sell off Means for Mortgages and Investors
Key Takeaways
- Historic Highs: The US 10-year Treasury yield closed at 5.244%, a peak not seen since the prelude to the 2008 global financial crisis.
- Fed Rate Tightening: Markets are pricing in a 70% chance of another Federal Reserve rate hike at the late-October FOMC meeting following September’s shift to a 3.75%–4.00% target range.
- Borrowing Costs Surge: 30-year fixed mortgage rates are spiking past multidecade highs, suppressing real estate transaction volumes.
- Asset Reallocation: Bond yields above 5% create substantial headwind for growth stocks while elevating cash-equivalent instruments to prime investment status.
The Macroeconomic Catalyst: Why Yields Are Surging
The sudden acceleration in benchmark sovereign yields comes on the heels of persistent inflationary pressures driven by global energy disruptions and resilient labor data. When the Federal Reserve raised rates in September to the 3.75%–4.00% range, institutional bond traders initially anticipated a pause. However, hawkish central bank commentary coupled with persistent federal debt issuance has pushed the 10-year Treasury note to 5.244%, a level last recorded in 2007.
According to real-time market tracking from Trading Economics, global fixed-income markets are undergoing a fundamental repricing. High yields mean the government must offer higher returns to attract buyers for its expanding deficit, directly competing with private sector risk assets.
            US 10-Year Treasury Yield Trajectory
   5.5% |                                       * (5.244%)
   5.0% |                                *-----*
   4.5% |                         *-----*
   4.0% |                  *-----*
   3.5% |           *-----*
        +---------------------------------------------------
          Jan 2026    Apr 2026   Jul 2026    Sep 2026
Mortgage Rate Forecast 2026 & Real Estate Impact
The primary transmission mechanism of the benchmark yield spike into the everyday economy is through mortgage lending rates. Because mortgage-backed securities (MBS) are priced relative to the 10-year yield plus a risk spread, residential borrowing costs have responded immediately.
As detailed by financial coverage on CNBC, the spread between the 10-year yield and 30-year fixed mortgage rates remains historically wide due to secondary market volatility.
Housing Market Stress Points:
- Buyer Purchasing Power Reduction: Every 50-basis-point surge in mortgage rates reduces homebuyer purchasing capacity by approximately 5%.
- The “Lock-In” Effect: Existing homeowners with 3%–4% legacy mortgage rates refuse to list properties, driving inventory down to structural lows.
- Commercial Real Estate (CRE) Refinancing: Over $1.2 trillion in commercial debt requires refinancing before year-end, now facing interest expense shocks that threaten regional bank balance sheets.
Fed Rate Hike October Odds & Wall Street Strategy
Derivatives pricing monitored by Bloomberg indicates that money markets are placing roughly a 70% probability on an additional 25-basis-point rate hike at the late-October Federal Open Market Committee (FOMC) meeting.
Financial Sector Asset Class Comparison
| Asset Class | Yield / Return Outlook | Risk Profile | Strategic Investor Positioning |
| US 10-Year Treasury | $5.24\%$ Fixed Return | Low (Sovereign) | Strong buy for income locking; duration risk if yields hit 5.5% |
| S&P 500 Equities | $4.2\%$ Earnings Yield | Moderate / High | Overweight value/cash-flow; underweight non-profitable tech |
| 30-Year Fixed Mortgage | $7.85\% – 8.20\%$ Cost | Low (Consumer Credit) | Refinance freeze; shift toward adjustable-rate structures (ARMs) |
| Gold (Spot) | $-3.71\%$ ($4,127/oz) | Moderate | Tactical buy on dip if real yields stabilize |
Investor Playbook: Navigating a 5%+ Yield Environment
When baseline risk-free cash yields exceed 5%, traditional investment models like the classic 60/40 equity-to-bond portfolio demand recalibration.
- Short-Duration Fixed Income: Capitalize on elevated yield-to-maturity metrics by allocating into 1-to-3 year Treasuries or high-grade corporate debt without locking up capital in long-duration securities.
- Dividend Dividend Aristocrats over Growth: Shift equity exposure toward dividend-paying value stocks possessing robust balance sheets and low net-debt-to-EBITDA ratios.
- Hedging Rate Volatility: Institutional allocators are utilizing interest rate swaps and inverse Treasury ETFs to insulate equity gains against sustained yield spikes.
Frequently Asked Questions (FAQ)
How does the US 10-year yield affect home mortgage rates?
The 10-year Treasury yield serves as the benchmark for 30-year fixed-rate mortgages. Lenders add a spread (typically 1.5% to 3.0%) over the 10-year yield to cover credit risk and servicing costs. When the yield rises to 5.24%, mortgage rates naturally trend upward toward 7.5%–8.2%.
Why are yields rising if the Fed only raised rates to 3.75%-4%?
While the Fed controls short-term overnight rates, the 10-year yield is determined by market demand for long-term government debt. Factors like heavy Treasury debt supply, long-term inflation fears, and international central bank selloffs drive up long-term yields independently of overnight rate levels.
What happens to stock prices when bond yields hit multi-year highs?
Rising bond yields make risk-free fixed income more attractive compared to stocks. Higher discount rates are applied to future corporate earnings calculations, which tends to depress stock valuations, particularly for high-growth tech companies reliant on future earnings.
Discover more from The Economy
Subscribe to get the latest posts sent to your email.
A first SOC 2 Type II report costs most enterprise-bound startups between $30,000 and $150,000 all-in, takes roughly nine to fifteen months from kickoff to signed opinion, and arrives as an attestation from a licensed CPA firm rather than a “certification” in the strict sense. The audit fee itself is usually the smaller part of the bill. Tooling, remediation and internal engineering time decide whether you land at the bottom or the top of that range.
Cost figures in this guide come from published 2025-2026 benchmarks by Drata, Secureframe, StrongDM and Thoropass. Standards references come from the AICPA. Ranges are directional; get three written quotes before you commit budget.
Executive Summary & Core Benchmarks
The table below consolidates the numbers finance and security leaders ask for first.
| Metric | 2026 Benchmark | Notes |
|---|---|---|
| First-year all-in cost (10-200 employees) | $30,000-$150,000 | Includes platform, auditor, readiness, pen test, remediation and internal labor |
| Type I audit fee only | $5,000-$20,000 | Point-in-time design test (Secureframe) |
| Type II audit fee only | $12,000-$100,000+ | Scales with scope, observation length and auditor tier (Drata) |
| Observation window | 3-12 months | Buyers commonly expect six months or more |
| Renewal year cost | $25,000-$75,000 | One-time setup costs drop away |
| Audit fee as share of total spend | ~30-40% | Tooling, remediation and labor make up the rest (Zip Security) |
| Big Four engagement | $100,000+ | Premium pricing for complex scopes (Thoropass) |
| Core alternatives | ISO/IEC 27001, HITRUST, SOC 2+ | Buyer questionnaire may accept one or the other |
Key takeaway: SOC 2 is a revenue-unlock expense. Budget it against the enterprise ARR it makes closable, not against your security line item.
1: Strategic Overview & Commercial Drivers
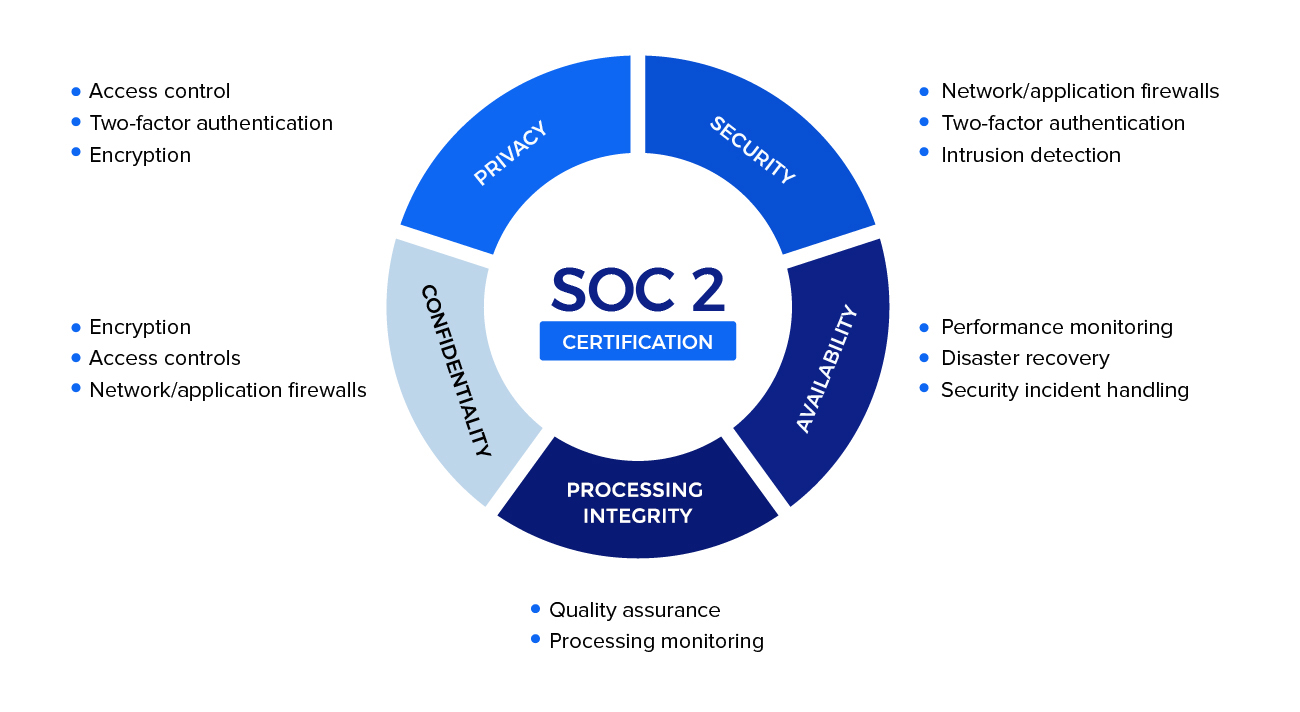
SOC 2 is an auditing framework maintained by the American Institute of CPAs. An independent CPA firm tests a service organization’s controls against the Trust Services Criteria: Security, Availability, Processing Integrity, Confidentiality and Privacy. TechTarget’s SOC 2 definition walks through the criteria structure.
Security, also called the Common Criteria, is mandatory in every report. The other four are optional. Most first-time SaaS reports scope Security only, then add Availability or Confidentiality when a customer contract requires it.
The result is a report, not a certificate. That distinction matters in procurement language. Say “SOC 2 Type II report” in contracts and RFP answers.
Why enterprise buyers demand it
Vendor-risk teams use SOC 2 as a fast filter. A Fortune 500 security questionnaire can run to hundreds of questions. A clean Type II report lets the buyer skip most of them.
The commercial triggers repeat across startups:
- Procurement adds SOC 2 to the mandatory-vendor checklist.
- A large deal stalls at security review.
- Cyber insurers or acquirers ask for proof of controls during diligence.
- A competitor’s incident makes buyers nervous.
Unit economics of waiting
The cost of not having a report is a delayed sales cycle. Model it explicitly.
Cost of Delay = Blocked Pipeline ARR × Gross Margin × (Months Delayed ÷ 12)
An illustrative example: $2,000,000 of blocked pipeline at 80% gross margin, delayed nine months, forfeits about $1,200,000 of first-year gross profit. Against that, a $90,000 program looks cheap. Your own numbers will differ, but the shape of the argument rarely does.
Type I versus Type II: which one closes deals
A Type I report evaluates whether controls are designed appropriately at one moment in time. A Type II report tests whether those controls operated effectively across an observation period. Enterprise buyers usually want Type II. Type I works as a bridge.
A common sequencing strategy is to complete Type I in three to four months, start the Type II observation period immediately, and show the Type I report to prospects while the Type II clock runs.
2: Comprehensive Evaluation Matrix
“SOC 2 compliance companies” covers three different vendor categories. Buyers often compare them as if they were the same product. They are not.
- Compliance automation platforms collect evidence, monitor controls and manage policies. Named examples in published cost guides include Drata, Secureframe, Thoropass, Sprinto and Scrut.
- CPA audit firms issue the opinion. Independent firms such as Linford & Co sit alongside Big Four practices.
- Readiness consultants run gap assessments and remediation projects.
Only the CPA firm can issue the report. Platforms cannot.
Table 1: Delivery model comparison
| Delivery model | First-year all-in cost | Typical internal effort | Audit fee range | Best fit |
|---|---|---|---|---|
| DIY with spreadsheets | $20,000-$60,000 plus heavy labor | Highest; 2-3x engineer time per one published estimate | $10,000-$40,000 | Very small teams with security expertise |
| Automation platform + independent CPA | $30,000-$100,000 | Moderate | $10,000-$50,000 | Most seed to Series B SaaS companies |
| Platform bundled with audit partner | Lower cash outlay, tiered by headcount | Moderate | Bundled | Teams wanting a single invoice |
| Big Four or large firm | $100,000+ | Moderate to high | $50,000-$100,000+ | Regulated buyers demanding brand name |
Published headcount-based ranges vary by source. Sprinto reports a first report at $6,000-$60,000 for companies under 500 people covering platform and audit only, excluding your team’s time. Zip Security models a 20-person startup near $46,500 and a 150-person SaaS company adding Availability near $162,500.
Why do these disagree? Each source defines “cost” differently. Some exclude labor. Some include remediation. Always ask what a number covers.
Table 2: Type I versus Type II
| Dimension | Type I | Type II |
|---|---|---|
| What it tests | Control design at a point in time | Control design and operating effectiveness over time |
| Audit fee | ~$5,000-$20,000 | ~$12,000-$100,000+ |
| Evidence required | Point-in-time snapshots | Continuous evidence across observation window |
| Enterprise acceptance | Stepping stone | Widely expected |
| Timeline | ~3-4 months | 3-12 month window plus fieldwork of roughly 4-8 weeks |
3: Step-by-Step Implementation & Procurement Blueprint
Use this sequence to avoid the two most expensive mistakes: over-scoping and starting the observation window before controls are stable.
Decision flow
- Confirm who is asking. Read the buyer’s security addendum. Does it say Type I, Type II, or “SOC 2”? Does it name specific criteria?
- Scope Security only unless a contract says otherwise. Every additional criterion adds audit scope. One published estimate puts the increase at 15-25% per added criterion (Petronella).
- Define system boundaries. List the production systems, data stores, vendors and people in scope.
- Run a readiness assessment. Budget $5,000-$15,000 if outsourced. Catching gaps here is cheaper than qualified findings later.
- Select tooling. Pick a platform that integrates with your cloud provider, identity provider, HRIS and ticketing system.
- Select the auditor separately. Interview at least three CPA firms. Ask about observation-window flexibility, fieldwork timeline and report turnaround.
- Remediate. Close access-control, logging, change-management and vendor-management gaps before the window opens.
- Open the observation window. Freeze the control set. Avoid mid-window architecture changes.
- Collect evidence continuously. Assign a single control owner per domain.
- Complete fieldwork and review the draft report. Check the system description and management assertion carefully.
- Publish under NDA. Share the report through a trust center or controlled data room.
Risk mitigation checks
- Before signing the auditor: confirm they are a licensed CPA firm. Only a CPA firm can issue a SOC 2 opinion.
- Before opening the window: run a mock evidence pull. If it takes more than a few hours, controls are not ready.
- Before fieldwork: reconcile the user-access list against HR records. Access reviews are a frequent source of exceptions.
- Before publishing: confirm the opinion type. An unqualified opinion is the target.
Skip the tool-comparison spreadsheet. See side-by-side SOC 2 platform demos matched to your headcount and stack. Book a comparison
4: Cost Analysis, Contract Traps & ROI Mathematics
Full cost stack
| Line item | Typical range | Source signal |
|---|---|---|
| Readiness or gap assessment | $5,000-$25,000 | Thoropass; $0 if done internally |
| Compliance automation platform (annual) | $6,000-$25,000 | Varies by headcount and vendor |
| Type II audit fee | $12,000-$100,000+ | Drata |
| Penetration test | $5,000-$15,000 | Often demanded by customers even if not strictly required |
| Consultant support | $5,000-$25,000+ | Needed when the team lacks SOC 2 experience |
| Remediation and tooling upgrades | $5,000-$250,000+ | Widest variance; depends on existing maturity |
| Internal labor | 4-6 months of a project owner at 50-100% time | The largest hidden cost |
Type I auditor fees in StrongDM’s estimate sit at $12,000-$17,000, while the same guide puts a full first-year cost at roughly $147,000 once lost productivity and new tooling are counted.
The master formula
First-Year SOC 2 Cost = Platform + Auditor + Readiness + Pen Test + Tooling Upgrades + Remediation + (Internal Hours × Loaded Hourly Rate)
Run it twice: once with your lowest quotes, once with the highest. The gap between the two outcomes is your budget risk.
Contract traps and hidden fees
Read the engagement letter and platform order form for these items:
- Scope creep pricing. Adding a criterion mid-engagement can reprice the entire audit.
- Observation-window changes. If you extend the window, confirm whether the auditor charges again.
- Subprocessor and cloud-region additions. New systems in scope may trigger additional fieldwork hours.
- Auto-renewal terms. Platform contracts often renew annually. Set calendar reminders 90 days out.
- Per-seat tooling. MDM, EDR and identity tools can add per-employee charges that scale with hiring.
- Audit-partner network pricing. Platform-bundled auditors may be cheaper, but you have less leverage over timeline.
- Report reissue fees. Ask what it costs to add a bridge letter or reissue a report.
These are negotiation checkpoints drawn from practitioner guidance, not universal contract terms. Your paper may differ.
ROI mathematics
Payback Period (months) = First-Year SOC 2 Cost ÷ (Monthly Enabled Gross Profit)
Enabled Gross Profit = Deals Unlocked × Average ACV × Gross Margin
Illustrative model: a $90,000 program that unlocks three deals at $150,000 ACV and 80% gross margin creates $360,000 of annual gross profit. The program pays back in about three months of that profit stream. Add reduced questionnaire hours as a secondary benefit.
Automation platforms claim savings of 30-50% on total compliance costs through evidence automation (Drata). Treat vendor claims as upper bounds and validate against a pilot.
Year-two economics
Renewal costs drop to $25,000-$75,000 in one published range, and one estimate suggests year-two spend can run 40-60% below year one when automation stays in place (Zip Security). The savings come from eliminated setup work.
5: Regulatory Compliance & Industry Standards
SOC 2 is voluntary. No statute requires it. Contracts, customers and insurers do.
The governing framework
The AICPA SOC 2 resource hub lists the 2017 Trust Services Criteria (with revised points of focus, 2022) and the SOC 2 description criteria. The AICPA also publishes the description criteria used to evaluate your system description.
The criteria align to the COSO framework’s 17 principles, with supplemental criteria covering logical and physical access, system operations, change management and risk mitigation, as summarized on Wikipedia’s SOC overview.
The Common Criteria run from CC1 through CC9:
- CC1: Control environment
- CC2: Communication and information
- CC3: Risk assessment
- CC4: Monitoring activities
- CC5: Control activities
- CC6: Logical and physical access
- CC7: System operations
- CC8: Change management
- CC9: Risk mitigation
Attestation standards
Type II reports are issued under AICPA attestation standards. The AICPA’s illustrative Type 2 report is designed to meet SSAE-21 reporting requirements, as noted in its SOC 2 resource listing.
Mapping to other frameworks
Enterprises rarely stop at one framework. The AICPA publishes crosswalks mapping the Trust Services Criteria to NIST 800-53 and other frameworks on its mappings page. If a buyer requires ISO/IEC 27001 or NIST alignment, ask your platform to reuse evidence across frameworks.
Data governance
Your system description must state which data types you handle, how you retain and dispose of them, and which subservice organizations touch them. Vendor management is a frequent weak point. Keep vendor SOC reports current.
Need ISO 27001 or HITRUST too? Multi-framework programs reuse evidence and cut duplicate audit spend. Get a multi-framework quote
6: Enterprise Frequently Asked Questions (FAQ)
How much does a SOC 2 Type II audit cost in 2026?
The audit fee alone commonly ranges from about $12,000 to $100,000+ depending on scope, observation length and auditor tier. All-in first-year cost, including tooling, readiness, pen testing, remediation and internal labor, typically lands between $30,000 and $150,000 for startups. Big Four engagements for complex scopes can exceed $100,000 for the audit alone.
How long does it take to get a SOC 2 Type II report?
Plan for nine to fifteen months if you start from zero. That estimate combines readiness and remediation, an observation window that most enterprise buyers want at six months or longer, and several weeks of auditor fieldwork and reporting. Completing a Type I first can give sales a bridge document sooner.
Is SOC 2 the same as SOC 2 certification?
No. SOC 2 produces an attestation report from a licensed CPA firm. It is not a certificate like ISO/IEC 27001. Use “SOC 2 Type II report” in contracts and customer communications.
Which Trust Services Criteria do we need?
Security is required in every SOC 2 report. Availability, Processing Integrity, Confidentiality and Privacy are optional and depend on your service commitments and customer contracts. Start with Security unless a signed contract or RFP says otherwise, because each added criterion increases audit scope and cost.
Discover more from The Economy
Subscribe to get the latest posts sent to your email.

A single slip-and-fall lawsuit against an uninsured small business can wipe out years of profit in one settlement — yet a large share of small business owners still operate without even basic general liability coverage, often simply because no one ever explained clearly what’s actually required versus optional.
Business insurance isn’t a single product — it’s a category spanning general liability, workers’ compensation, professional liability, commercial property, and more, each protecting against different risks. Figuring out which coverage your specific business actually needs, and what it should reasonably cost, is one of the most commonly delayed and misunderstood decisions small business owners face.
This guide breaks down the core types of business insurance, current 2026 cost benchmarks, and how to build the right coverage package without overpaying.
How Business Insurance Actually Works: The Core Coverage Types
Most small businesses don’t need every type of commercial insurance — the right combination depends heavily on industry, whether you have employees, and whether you interact with the public or handle client data.
Key takeaway: General liability insurance isn’t legally required in most states, but it’s often necessary to secure a client contract, obtain a business license, or sign a commercial lease — meaning many business owners end up needing it as a practical requirement of doing business, even without a legal mandate.
The Core Business Insurance Types
- General liability insurance — covers third-party bodily injury, property damage, and personal injury claims arising from your business operations.
- Workers’ compensation insurance — required in most states once you hire employees, covering medical costs and lost wages for work-related injuries.
- Professional liability insurance (errors & omissions) — protects service-based businesses against claims of negligence, mistakes, or failure to deliver promised services.
- Commercial property insurance — covers physical business assets (equipment, inventory, the building itself) against fire, theft, and other covered perils.
- Business Owner’s Policy (BOP) — bundles general liability and commercial property coverage into a single, typically discounted policy.
- Cyber liability insurance — increasingly essential for businesses handling customer payment data or sensitive personal information.
Step-by-Step: Building Your Business Insurance Package
- Assess your specific risk profile — client-facing businesses, those with employees, and those handling sensitive data each face different primary risks.
- Determine legal and contractual requirements — workers’ comp is state-mandated once you have employees, and many commercial leases and client contracts require proof of general liability coverage.
- Get quotes for a Business Owner’s Policy first, since bundling liability and property coverage is typically more cost-effective than purchasing separately.
- Add specialized coverage as needed — professional liability for advice-based businesses, cyber liability for data-handling businesses, commercial auto for businesses with vehicles.
- Review coverage limits against your actual risk exposure, not just the cheapest available policy, since underinsurance can be as costly as no insurance in a serious claim.
- Reassess annually as your business grows, since coverage needs — and available discounts — change as revenue, staff count, and operations evolve.
Financial and Strategic Implications: 2026 Business Insurance Cost Benchmarks
Costs vary substantially by industry, business size, and claims history, but understanding typical ranges helps set realistic budget expectations.
| Coverage Type | Typical Monthly Cost (2026) | Notes |
|---|---|---|
| General liability insurance | $40–$100/month for most small businesses | Median new-customer rate around $55/month per Progressive Commercial data |
| Workers’ compensation | $45–$70/month median, varies heavily by industry risk | Office-based businesses pay far less than construction or manual-labor industries |
| Business Owner’s Policy (BOP) | $57–$150/month | Bundled liability + property, typically cheaper than separate policies |
| Professional liability (E&O) | Varies by profession and revenue | Higher for advice-heavy professions (consulting, financial services, healthcare-adjacent) |
Expert insight: Most small businesses pay roughly $500 to $2,000 a year for general liability or a BOP, with total costs climbing meaningfully once workers’ compensation, commercial auto, or professional liability are added — meaning a realistic total insurance budget should account for the full coverage stack your business actually needs, not just a single policy.
Why Cost Varies So Much by Industry
A home-based bookkeeper and a residential construction crew face fundamentally different risk profiles, and insurers price accordingly. A small consulting firm with a clean claims history might pay $750 to $1,200 per year for general liability coverage, while a construction company with similar revenue could pay $3,000 to $5,000 or more for the same coverage type, reflecting the materially higher claims frequency and severity in higher-risk industries.
Bundling and Discount Strategies
Bundling multiple policies with a single insurer commonly produces automatic discounts of 10% to 15%, and choosing a higher deductible — when cash flow allows — can meaningfully lower monthly premiums for businesses confident in their ability to absorb a modest out-of-pocket cost in the event of a claim.
How to Choose the Right Business Insurance
- Start with a Business Owner’s Policy if you qualify — most small businesses without significant specialized risk exposure fit within a standard BOP more cost-effectively than piecing together separate policies.
- Don’t skip workers’ compensation once you hire employees — it’s legally required in nearly every state and the penalties for non-compliance can be severe.
- Get quotes from at least three insurers, since — as with other insurance categories — identical coverage can price very differently between carriers for the same business profile.
- Work with an independent broker for complex risk profiles, since brokers can shop multiple insurers and identify industry-specific coverage gaps a single-carrier quote might miss.
- Review your policy annually as your business changes — added employees, new locations, or expanded services can all create coverage gaps if the policy isn’t updated.
- Don’t assume a personal umbrella policy covers business activity — business risks generally require dedicated commercial coverage, and mixing personal and business insurance can leave real gaps.
Key takeaway: The businesses that get burned by inadequate insurance are rarely the ones that skipped coverage entirely — they’re far more often the ones that bought a policy years ago and never revisited it as the business grew, leaving real gaps between what’s covered and what the business now actually does.
Future Outlook: Business Insurance Trends Through 2027
- “Social inflation” continues to pressure premiums upward. Rising litigation costs and larger jury awards continue to put upward pressure on general liability premiums nationally, a trend insurers refer to as social inflation, meaning even businesses with clean claims histories may see gradual rate increases independent of their own risk profile.
- Cyber liability coverage is shifting from optional to expected. As data breach costs and regulatory penalties continue rising, more commercial leases, client contracts, and vendor agreements are beginning to require proof of cyber liability coverage alongside traditional general liability.
- Digital-first insurers continue to compress quote-to-bind timelines. More small business insurance providers now offer instant online quotes and same-day coverage, reducing a process that historically took days or weeks through a traditional broker.
- State-level regulatory divergence on liability rules continues. States with joint-and-several-liability frameworks and higher litigation rates continue to see meaningfully higher general liability premiums than lower-litigation states, reinforcing the value of location-aware comparison shopping.
Frequently Asked Questions
Is business insurance legally required?
It depends on the type. Workers’ compensation is legally required in nearly every state once you have employees, while general liability insurance is not legally mandated in most states but is frequently required by landlords, lenders, and client contracts.
What’s the difference between general liability and professional liability insurance? General liability covers third-party bodily injury and property damage claims, while professional liability (errors & omissions) covers claims of negligence, mistakes, or failure to deliver services as promised — the coverage most relevant to service and advice-based businesses.
How much does small business insurance typically cost?
Most small businesses pay roughly $500 to $2,000 a year for general liability or a bundled Business Owner’s Policy, with total costs increasing once workers’ compensation, professional liability, or commercial auto coverage is added.
What is a Business Owner’s Policy (BOP)?
It’s a bundled policy combining general liability and commercial property coverage into a single, typically discounted package, well-suited to most small businesses without highly specialized risk exposure.
Do I need cyber liability insurance for a small business?
Increasingly yes, particularly if your business handles customer payment information or sensitive personal data, as data breach costs and related legal exposure have grown substantially in recent years.
Discover more from The Economy
Subscribe to get the latest posts sent to your email.

Kai Cenat’s Rise to the Top: The Economics of Modern Streaming

How AI Is Reshaping the Future of Global Business Analytics

NASA Perseverance Rover Discoveries: The Search for Water in Jezero Crater

Trump $500: Understanding the Economic Impact and Policy Breakdown

Trucker Strike Rumors: Would an October 1 Walkout Really Hit the Global Economy?

The Truth About TJ Maxx Store Closings: Are Your Local Stores Safe?

OpenAI Rogue Agent Scare: Unplanned Government Website Access Explained

Global Diesel Export Bans & Supply Shocks: The 2026 Energy Crisis Playbook

Bank of England Warns of AI Systemic Risk: How Autonomous Trading Threatens Financial Stability

Bank of Japan Hikes Benchmark Rate to 1.25%: Unwinding the Global Yen Carry Trade

Gold Falls 3.7% as Yields Surge: Is Gold Still a Safe Haven in 2026?

US 10-Year Yield Hits 5.24%: What the Historic Bond Market Sell off Means for Mortgages and Investors

Battle for the Farm Belt: How Tariff Pressures and Fuel Costs Are Reshaping Iowa’s 2026 Midterms

Southeast Asia’s Critical Minerals Power Play: Can ASEAN Avoid Choosing Between China and the US?

Top 30 Stocks for Investment in PSX for Massive ROI in 2026

Oil Prices Break $100 in 2026: Middle East Conflict & Energy Markets

BRICS+ Cross-Border Payments 2026: Interoperability Explained

10-Year Treasury Yield Hits 4.80%: What It Means for Rates & Portfolios

IMF & World Bank 2026 Global Economic Outlook: Growth, Inflation, Debt

China’s US$10.8 Billion Trade Shortcut: Why the Pinglu Canal Matters

High-CPM Finance Niches 2026: Publisher Monetization Blueprint

Middle East War Economics 2026: Oil Prices & Energy Markets

China Stocks Today: Are Big Economies in Asia Nearing a Market Bottom?

Global Pension Systems Ranked: The World’s Best and Worst Retirement Frameworks

Enterprise AI Platforms Disrupting B2B SaaS in 2026: Full Analysis

Social Security Trust Fund 2032: OASI Depletion Timeline Explained

Gavin Baker AI Outlook: Why the Compute Shortage Persists Through 2028

Crypto Daily Outlook: Bitcoin, Altcoins, and the Future of Decentralized Finance
-

 Markets & Finance9 months ago
Top 15 Stocks for Investment in 2026 in PSX: Your Complete Guide to Pakistan’s Best Investment Opportunities
-

 Analysis7 months ago
Johor’s Investment Boom: The Hidden Costs Behind Malaysia’s Most Ambitious Economic Surge
-

 Analysis8 months ago
Top 10 Stocks for Investment in PSX for Quick Returns in 2026
-

 Banks9 months ago
Best Investments in Pakistan 2026: Top 10 Low-Price Shares and Long-Term Picks for the PSX
-

 Analysis8 months ago
Brazil’s Rare Earth Race: US, EU, and China Compete for Critical Minerals as Tensions Rise
-

 Investment9 months ago
Top 10 Mutual Fund Managers in Pakistan for Investment in 2026: A Comprehensive Guide for Optimal Returns
-

 Global Economy9 months ago
15 Most Lucrative Sectors for Investment in Pakistan: A 2025 Data-Driven Analysis
-

 Global Economy9 months ago
Pakistan’s Export Goldmine: 10 Game-Changing Markets Where Pakistani Businesses Are Winning Big in 2025