
Analysis
Gold and Silver Slump Deepens: Why the Precious Metals Crash is Rattling Global Equities After a Record Rally

The glittering ascent of gold and silver—metals that for millennia have served as humanity’s ultimate stores of value—has come crashing down with a ferocity not seen in generations. As of February 2, 2026, spot gold has plummeted approximately 5-10% from last week’s record high of $5,600 per ounce, now trading in the $4,500-$4,700 range. Silver’s collapse has been even more dramatic: down 10-16% to $78-$82 per ounce after Friday’s catastrophic 30%+ single-day drop from $120 highs—the steepest decline since the Hunt Brothers’ silver manipulation collapse in 1980.
This isn’t merely a correction in commodity markets. The precious metals sell-off has sent shockwaves through global equity markets, with the S&P 500 shedding 2-3% and the Nasdaq experiencing heightened volatility as investors recalibrate risk across asset classes. The question now consuming trading floors from New York to Hong Kong: Is this a temporary unwinding of overcrowded positions, or does it signal something more profound about the global economic landscape?
The Anatomy of a Precious Metals Crash
To understand the current gold and silver price crash, we must first acknowledge the extraordinary rally that preceded it. Gold’s climb to $5,600 represented a 40%+ gain from 2024 levels, driven by persistent inflation fears, geopolitical tensions, and central bank accumulation. Silver, with its dual identity as both precious metal and industrial commodity, surged even more dramatically on manufacturing demand and speculation around green energy transitions.
But every parabolic rise contains the seeds of its own reversal. The gold price slump reasons for 2026 are multifaceted, reflecting a perfect storm of technical, monetary, and psychological factors:
Dollar Resurgence and Hawkish Fed Signals
The U.S. dollar has strengthened considerably against major currencies, making dollar-denominated commodities more expensive for foreign buyers. More significantly, President Trump’s nomination of Kevin Warsh as Federal Reserve chair has injected hawkish expectations into monetary policy discourse. Warsh, known for his inflation-fighting credentials and skepticism of prolonged easy money, represents a potential shift toward tighter monetary conditions—anathema to precious metals that thrive in low-rate, high-liquidity environments.
Market participants are reassessing their assumptions about the Fed’s trajectory, with Treasury yields climbing and real interest rates—gold’s traditional nemesis—moving higher. When bonds offer attractive risk-adjusted returns, gold’s appeal as a zero-yield asset diminishes rapidly.
Margin Requirements and Forced Liquidation
The Chicago Mercantile Exchange’s decision to raise margin requirements on precious metals futures contracts has amplified the sell-off. This technical adjustment, designed to reduce systemic risk during periods of extreme volatility, had the perverse effect of forcing leveraged speculators to liquidate positions to meet capital calls. In markets where momentum traders had piled in during the rally’s final stages, these forced sales created a cascade effect.
Silver, with its smaller market size and higher volatility, proved particularly susceptible. The metal’s Friday collapse wasn’t driven by fundamental deterioration in industrial demand or supply disruptions—it was a liquidity crisis within the futures market itself, reminiscent of the 1983 gold market dislocation when prices fell 12% in a single session.
Profit-Taking After Historic Gains
Sometimes the simplest explanation holds the most truth: investors are locking in profits after extraordinary gains. Portfolio managers who rode gold from $2,000 to $5,600 have compelling reasons to trim positions, particularly as quarterly reporting deadlines approach. The precious metals decline after rally reflects rational risk management as much as any fundamental shift in the investment thesis.
According to commodity strategists, the “smart money” began rotating out of precious metals into equities and credit in late January, anticipating that the speculative fervor had reached unsustainable levels. Retail investors, often the last to enter and first to panic, have since followed suit.
Silver’s Unique Vulnerability: Industrial Demand Meets Speculative Excess
While gold’s primary function remains as a monetary metal and store of value, silver straddles two worlds—and this duality has intensified its volatility. Approximately 50% of silver demand comes from industrial applications, particularly in solar panels, electronics, and emerging battery technologies. The other half comprises investment demand and jewelry.
The silver price crash impact on stocks has been particularly pronounced in mining equities and related ETFs. Companies like First Majestic Silver and Pan American Silver have seen their shares decline 15-20% in sympathy with the underlying metal, while broader materials sector indices have underperformed.
Yet beneath the panic lies an interesting contradiction: industrial fundamentals for silver remain robust. Green energy initiatives across Europe and Asia continue to drive structural demand for solar installations, which consume significant quantities of silver for photovoltaic cells. The disconnect between futures market pricing and physical market tightness suggests this sell-off may be creating opportunities for long-term investors willing to weather near-term volatility.
Equity Market Contagion: How the Precious Metals Rout Spreads
The ripple effects of the gold and silver slump extend far beyond mining stocks. Here’s how the sell-off is rattling broader equity markets:
| Market Segment | Impact | Primary Mechanism |
|---|---|---|
| S&P 500 | -2.3% (week-to-date) | Risk-off sentiment, correlation breakdown |
| Nasdaq 100 | -3.1% (volatile) | Tech liquidation to cover commodity losses |
| Mining Equities | -15 to -25% | Direct exposure to metal prices |
| Emerging Markets | -4.2% | Commodity-exporter currencies weaken |
| Treasury Bonds | +0.8% (yields down) | Flight to quality amid uncertainty |
The correlation mechanics are subtle but powerful. Many hedge funds and institutional investors maintain diversified portfolios where precious metals serve as inflation hedges and equity diversifiers. When these positions require sudden unwinding—either due to margin calls or risk reduction mandates—managers often sell their most liquid assets first. That typically means large-cap technology and growth stocks, explaining the Nasdaq’s outsized reaction.
According to market microstructure analysis, cross-asset correlations that typically hover near zero or negative during stable periods can spike toward +0.7 or higher during stress events. We’re witnessing this phenomenon now: assets that should theoretically move in opposite directions are instead falling in tandem as indiscriminate selling dominates thoughtful allocation.
Historical Context: Echoes of 1980 and 1983
For younger market participants, the current precious metals sell-off analysis may seem unprecedented. But history offers instructive parallels:
The 1980 Silver Collapse: After the Hunt Brothers attempted to corner the silver market, prices spiked to $50/oz before crashing 50% in four days when regulators intervened and exchanges changed margin rules. The parallels to today’s CME margin hikes and speculative positioning are striking.
The 1983 Gold Crash: Following Paul Volcker’s aggressive interest rate hikes to combat inflation, gold fell from $850 to $300 over two years. A single-session 12% drop in February 1983 shocked markets and presaged a multi-year bear market for precious metals.
Both episodes shared common features with 2026: speculative excess, rapid monetary policy shifts, and technical market structures that amplified volatility. Yet in both cases, gold and silver eventually found floors and resumed long-term uptrends as fundamental drivers reasserted themselves.
Why Gold and Silver Prices Are Falling Now: The Full Picture
Synthesizing the factors driving the current downturn reveals a complex interplay:
- Monetary Policy Expectations: The shift toward perceived hawkishness under potential Fed Chair Warsh raises real interest rates, gold’s kryptonite.
- Dollar Strength: A resurgent greenback makes commodities less attractive to international buyers and reduces inflation hedging urgency for U.S. investors.
- Technical Factors: Margin requirement increases forced liquidation among leveraged speculators, creating a self-reinforcing sell spiral.
- Profit Realization: After 40%+ gains, portfolio managers are locking in returns, particularly ahead of quarterly reporting periods.
- Sentiment Shift: The psychological transition from “fear of missing out” during the rally to “fear of holding” during the decline has accelerated capital outflows.
- Equity Competition: Improving corporate earnings and equity valuations are drawing capital that might otherwise remain in defensive precious metals positions.
The Road Ahead: Correction or Paradigm Shift?
The critical question for investors: Does this represent a healthy correction within a secular bull market for precious metals, or a fundamental reversal of the forces that drove prices to record highs?
Several factors suggest this is more correction than paradigm shift:
Central Bank Demand Remains Robust: According to World Gold Council data, central banks purchased over 1,000 tonnes of gold in 2025, continuing a multi-year diversification away from dollar reserves. This institutional bid provides a floor beneath prices.
Structural Inflation Pressures Persist: Despite near-term rate expectations, long-term inflation drivers—deglobalization, energy transition costs, fiscal deficits—remain intact. These favor hard assets over the medium term.
Industrial Silver Fundamentals: The green energy transition isn’t reversing. Solar panel installations, electric vehicle adoption, and 5G infrastructure deployment all require significant silver inputs.
Geopolitical Uncertainty: From U.S.-China tensions to Middle East instability, the global risk landscape continues to support safe-haven demand.
However, genuine risks exist. If Kevin Warsh’s Fed pursues aggressive tightening and the dollar extends gains, precious metals could face sustained headwinds. A recession scenario might initially hurt industrial silver demand while benefiting gold’s safe-haven appeal—but severely constricted credit conditions could pressure both metals as investors scramble for cash.
Investment Implications and Strategic Considerations
For sophisticated investors, the current volatility presents both challenges and opportunities:
Short-term traders should remain cautious. The technical damage to both gold and silver charts suggests further downside risk if key support levels fail. The $4,400 level for gold and $75 for silver represent critical thresholds.
Long-term allocators might view significant weakness as an opportunity to establish or add to positions at more attractive valuations. Few credible scenarios eliminate the case for modest precious metals exposure (5-10% of portfolios) as diversification and inflation insurance.
Mining equity investors face a unique situation where stocks have sold off more aggressively than underlying metals, potentially creating value. However, companies with high leverage or production challenges could face severe stress if metal prices remain depressed.
Options strategies such as selling volatility through covered calls or establishing protective collars may be appropriate for those maintaining positions through this turbulent period.
Conclusion: Navigating Uncertainty with Historical Perspective
The gold and silver slump of early 2026, while dramatic and unsettling, fits a recognizable pattern of boom, excess, and correction that has characterized precious metals for centuries. The speed and severity of the decline—particularly in silver—reflects modern market structures where leverage, algorithmic trading, and interconnected risk systems can amplify movements in both directions.
Yet beneath the volatility, the fundamental case for precious metals allocation hasn’t disappeared. Inflation risks, geopolitical tensions, currency debasement concerns, and portfolio diversification needs all persist. The question isn’t whether gold and silver have a role in modern portfolios, but at what price that role becomes compelling.
For investors, the wisest course may be the most difficult: patience. Let the forced liquidation run its course, allow technical indicators to stabilize, and reassess positioning once panic gives way to rational price discovery. History suggests that markets overshoot in both directions—and that the deepest values often emerge when sentiment is darkest.
The precious metals crash of 2026 will eventually be seen as either a painful but temporary correction in an ongoing bull market, or as the beginning of a multi-year bear phase. That determination won’t come from headlines or single-day price movements, but from careful analysis of monetary policy, inflation trajectories, and global economic evolution over months and years ahead.
In the meantime, as trading desks absorb the shock and portfolio managers recalibrate, one truth remains constant: in times of uncertainty, the ancient appeal of tangible assets continues to echo through modern financial markets—even when those assets themselves are experiencing extraordinary turbulence.
Discover more from The Economy
Subscribe to get the latest posts sent to your email.


A global memory chip shortage is hitting AI hyperscalers, tanking Nvidia and Apple shares, and triggering a Wall Street rotation. Here’s what the AI sector’s supply crisis means for investors.The artificial intelligence boom that has driven Wall Street’s most extraordinary bull run in a generation is running headlong into a physical constraint: the world cannot produce memory chips fast enough to feed it.
On Friday, June 26, 2026, technology stocks extended a brutal weekly decline even as the broader market stabilized and advancing shares outnumbered declining ones. Nvidia slipped another 1% in early trading and was on pace for an 8% weekly loss—its worst five-day stretch in more than a year. Apple dived after announcing price increases for several iPad and Mac models, citing higher costs from memory chip shortages. Oracle and CoreWeave fell after the New York Times reported that OpenAI was considering delaying its initial public offering to as late as 2027.
What the headlines share is a single underlying cause: the cost of the memory chips that power AI infrastructure is rising faster than even the most aggressive hyperscaler budgets assumed, and the shortage driving that cost increase is not expected to ease before 2028.
The Architecture of the Crisis
Memory chips—specifically the high-bandwidth memory, or HBM, used in AI accelerators—are produced by a small number of manufacturers: SK Hynix, Micron, and Samsung. Demand for HBM has exploded because each new generation of Nvidia’s AI chips requires substantially more of it. As Nvidia pushes its product cycle faster to maintain competitive advantage, each cycle pulls forward enormous new demand for chips that take 18 to 24 months to ramp in production.
Micron reported strong quarterly earnings—its results have been spectacular—but the very strength of those results is the problem for the rest of the tech sector. Micron’s margins are rising because memory is scarce and expensive. The companies buying that memory—Microsoft, Amazon, Alphabet, Meta, and the rest of the hyperscaler complex—are absorbing higher input costs on a scale that is beginning to show up in margin guidance.
Analysts at Charles Schwab noted a “growing wedge” in the technology sector between memory producers like Micron—which is posting massive gains—and the hyperscaler stocks that are watching their AI infrastructure economics deteriorate. The latter group includes names like Microsoft, Amazon, and Alphabet, which are collectively projected to spend between $660 billion and $700 billion on AI infrastructure in 2026, according to research from Fair Observer.
Nvidia’s Problem Is a Market Concentration Problem
Nvidia entered 2026 having crossed a $5 trillion market capitalization—larger by GDP comparison than all but four national economies. That concentration made the stock not merely a bet on AI but a systemic weight in the S&P 500. Nvidia and its mega-cap technology peers now account for roughly 30% of the entire index—the highest concentration in half a century.
When Nvidia corrects, it does not correct in isolation. It reprices the risk premium of every fund manager with an S&P 500 benchmark, which is nearly every institutional investor in the world. The 8% weekly decline in late June—attributed to a combination of rising memory costs, margin anxiety among hyperscaler customers, and a broader rotation away from high-multiple AI stocks—had ripple effects across semiconductor infrastructure names including Lumentum, Marvell Technology, and Corning.
Apple Raises Prices—and Reveals the Exposure
Apple’s announcement of price increases for iPad and Mac models was notable for two reasons. First, Apple’s supply chain is among the most sophisticated on earth; if Apple could not absorb memory cost increases without raising consumer prices, the margin pressure is acute. Second, Apple’s pricing decision revealed an exposure that consumer electronics companies had managed to keep largely invisible through inventory buffers.
Those buffers, built up when memory was cheap, are now depleted. The shortage is forecast to persist through 2027 and potentially into 2028, driven by Nvidia’s accelerated chip release cadence and the insatiable demand of AI data centers for high-bandwidth memory. Analysts at Briefing.com noted that higher memory costs are seen “persisting throughout 2027 and perhaps into 2028, driven by increasing data center demand and Nvidia’s rapid introduction of updated AI chips.”
OpenAI Delays Its IPO—Absorbing the Lesson From SpaceX
The reported delay in OpenAI’s public offering is a direct consequence of two market developments: the broader tech weakness driven by the memory supply crisis, and the troubled IPO debut of SpaceX earlier in June, whose shares suffered heavy losses in the days following listing as global markets repriced risk.
OpenAI executives, who had targeted 2026 for a public offering, are now said to be evaluating a 2027 launch—giving markets time to stabilize and giving the company time to demonstrate that its AI infrastructure economics are sustainable at the scale that a public market valuation would demand.
The Rotation That May Define the Rest of 2026
The most significant market dynamic emerging from the memory chip crisis is not the decline in any single stock but the rotation it is enabling. As the mega-cap AI trade faces margin headwinds, investors are moving into financial and industrial companies, healthcare, and energy—sectors that had been overshadowed for years by the AI growth narrative. The Dow, weighted toward those steadier names, was holding up even as the Nasdaq declined through the final week of June.
That divergence—Dow up, Nasdaq down—is a familiar pattern in sector rotation cycles. It does not necessarily signal a bear market. It may signal the beginning of a more broadly distributed bull market, one less concentrated in five or seven names. The memory supply crisis, in that reading, is not the end of the AI boom—it is the first serious test of whether the boom’s economics are durable enough to survive contact with physical constraints.
Discover more from The Economy
Subscribe to get the latest posts sent to your email.
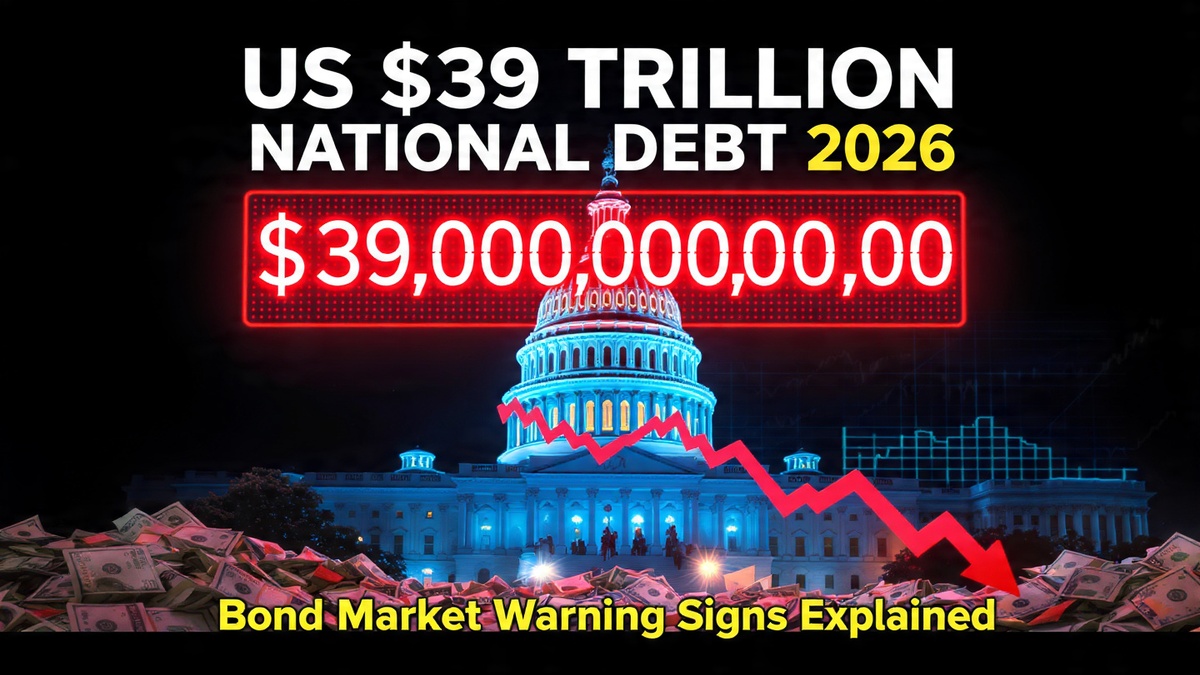
US national debt has crossed $39 trillion, bond yields are spiking, and Treasury auctions are showing soft demand. Here is what the bond market knows that Washington refuses to acknowledge.The United States crossed a number this year that no country in history has ever reached: $39 trillion in total federal debt. Not in inflation-adjusted terms. Not as a percentage of GDP. In raw dollars, the figure that sits on the public ledger of the world’s largest economy grew by $1 trillion in five months and $2 trillion in seven and a half months—and it is not slowing down.
What makes the velocity of that accumulation remarkable is the context in which it occurred. The Iran war added direct military expenditure at a pace that budget analysts said was accelerating. The 2025 tax cuts continued to erode revenue. And rising interest rates—the same rates the Federal Reserve is now signaling it may push higher still—are compounding the cost of servicing all that outstanding debt in a feedback loop that the bond market has quietly begun to price.
What the Auctions Are Saying
The most direct readout of market confidence in U.S. fiscal sustainability is the Treasury auction market, where the government sells new debt every week. Recent auctions have produced signals that bond investors usually describe in muted, technical language—but the direction is consistent.
A recent three-year Treasury auction cleared at 4.192%, well above the 3.965% at the prior auction. Yields rise when demand is soft. Soft demand at U.S. Treasury auctions is not a crisis signal—these are still among the most liquid securities in the world—but the trend line is one that fixed-income analysts at institutions ranging from J.P. Morgan to the Council on Foreign Relations have flagged as requiring close attention.
Foreign investors currently hold just above 30% of the Treasury market. Alarm bells rang briefly after April 2025’s Liberation Day tariffs—when U.S. bonds, equities, and the dollar all sold off together, the rarest of Wall Street trifectas—but subsequent data showed no dramatic reallocation away from Treasuries by foreign holders. That relative stability, however, depends on the continuation of conditions (a strong dollar, a functioning petrodollar system, geopolitical faith in U.S. institutions) that several of those conditions’ own architects now question.
The Interest Payment Problem
Of that $39 trillion, roughly $31.4 trillion is held by the public—the portion traded in financial markets globally. At current yields, the annual interest cost the U.S. government pays is on track to exceed $1 trillion for the first time in the country’s history. That figure is not a forecast. It is an arithmetic consequence of the debt level and the rate environment.
For context: U.S. defense spending in 2026 is approximately $900 billion. The federal government will spend more on interest payments than on the entire military. More than on Medicaid. More than on all discretionary non-defense programs combined. That structural reality constrains fiscal policy in ways that economists at the Deloitte Center for Financial Services have described as the most significant long-term challenge facing the U.S. economy.
“Higher bond yields affect U.S. fiscal dynamics in a number of ways,” analysts at the Council on Foreign Relations noted in their examination of tariff and Treasury interactions. “As interest payments on debt increase and use a greater share of available government funds, policymakers become more constrained around other fiscal priorities. They also can be more challenged when they need to respond to economic shocks.”
Three Credit Downgrades, Zero Course Correction
The United States has now been downgraded by all three major credit ratings agencies: S&P in 2011, Fitch in 2023, and Moody’s in May 2025. Each downgrade arrived with similar language—concerns about fiscal trajectory, political dysfunction over the debt ceiling, and a structural unwillingness to match revenues with spending. Each was followed by a brief market convulsion and then, effectively, nothing. Congress did not respond. The debt continued growing.
That pattern—of consequences being absorbed rather than heeded—is what makes the current moment structurally different from prior debt discussions, according to analysts who study sovereign fiscal crises. In those prior episodes, the U.S. still had room to maneuver: rates were low, the global appetite for dollar-denominated safe assets was rising, and alternative reserve currencies were even less credible than they are today. The margin for error has narrowed on all three dimensions.
The Political Ceiling on Solutions
The challenge is not primarily economic—it is political. Addressing a $39 trillion debt requires some combination of higher revenues, lower spending, or both. In the current Washington environment, tax increases are politically radioactive for one party and spending cuts face equivalent resistance from the other—particularly for the entitlement programs (Social Security, Medicare, Medicaid) that account for the largest share of mandatory outlays.
Markets have not yet priced the national debt as an immediate crisis, as analysts at U.S. Bank noted in their midyear market review: investors continue to watch whether rising debt eventually requires higher interest rates to attract enough Treasury buyers. The passive construction of that sentence—”continue to watch”—captures the market’s posture precisely. It is waiting. It is not yet acting.
The bond market’s message, in the language of Treasury yields and auction results, is being sent in increments rather than in a single shock. Washington is not listening. The question is not whether the message will eventually become impossible to ignore—it is how high rates must rise, and how much growth must slow, before the political system treats the ledger as a constraint rather than an abstraction.
Discover more from The Economy
Subscribe to get the latest posts sent to your email.
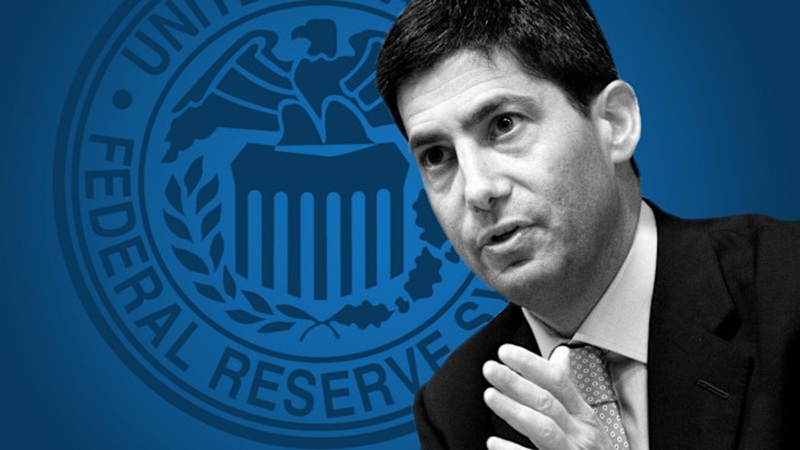
New Fed Chair Kevin Warsh surprised markets with a hawkish stance at his first FOMC press conference. Here’s how his rate-hike signals are rippling through stocks, bonds, mortgages, and gold. The Federal Reserve’s first policy meeting under new Chair Kevin Warsh sent shockwaves through global financial markets on June 17, 2026—not because policymakers moved rates, but because of what nine of them signaled they might do next.
Warsh, appointed by President Trump after months of public attacks on his predecessor Jerome Powell, arrived in Washington carrying expectations of a dovish turn. He had championed rate reductions while angling for the chairmanship, and the White House broadly supported looser monetary conditions. What markets got instead was a coldly hawkish institution that spent the better part of two hours dismantling those assumptions in real time.
The Meeting That Changed the Calculus
The Federal Open Market Committee held the federal funds rate unchanged at its existing range, but nine of 18 committee members penciled in at least one rate hike before year-end in the central bank’s updated Summary of Economic Projections—the dot plot. Six of those nine indicated support for two quarter-point increases. The shift represented a dramatic departure from the March projections, in which no policymaker had envisioned a hike, and the committee as a whole had forecast one cut.
The Dow Jones Industrial Average fell 507 points, or 0.98%, in the session. The S&P 500 lost 1.21% and the Nasdaq Composite dropped 1.34%. Two-year Treasury yields—the instrument most sensitive to near-term rate expectations—jumped 16 basis points to 4.21%, their highest reading in more than a year. Traders scrambled to reprice Fed futures, with CME FedWatch data showing the probability of a September hike jumping to 49% from 27% the previous session.
Warsh’s Statement Was Deliberately Brief—and Deliberately Alarming
The published FOMC statement was unusually short. Warsh stripped language that had previously signaled the Fed’s next move would be a cut and replaced it with a blunt acknowledgment that inflation remains “elevated”—a legacy partly of energy “supply shocks” stemming from the conflict in the Middle East.
“We’ve missed on inflation for five years and we’re going to fix that,” Warsh told reporters. “When we deliver on our price stability objectives—which we will—the American people will feel as though the hardships they’ve been living through are in the rear-view mirror.”
U.S. inflation hit 4.2%—double the Fed’s 2% target and its highest level in three years—leaving the committee little political room to stay passive. Warsh declined to submit a personal rate forecast to the dot plot, an unusual act of institutional reticence that some analysts read as an attempt to preserve maximum flexibility.
Bank of America Changes Its Forecast
Within days, Bank of America overhauled its rate outlook. Analysts at the bank predicted the Fed would raise the benchmark rate by a quarter point three times in 2026, lifting it from the current 3.5%–3.75% range to 4.25%–4.5%. The bank’s prior base case had been for rates to hold steady all year.
“The risk that they might need to raise rates has clearly risen,” said Matthew Luzzetti, chief U.S. economist at Deutsche Bank. BofA analysts acknowledged that Warsh could still be “strategically hawkish”—gaining anti-inflation credibility while actually buying time to cut later—but said the door to that interpretation was closing as incoming data showed persistent price pressure.
The hawkish turn unfolded against an unusual institutional backdrop. Warsh became the first new Fed chairman in more than 70 years to inherit an active predecessor on the governing board. Powell, whose term as chair Warsh replaced, remained as a board governor and voted at the June meeting—a fact that gives every subsequent public utterance from the former chair a level of market weight that Warsh’s team cannot easily ignore.
The Housing Market Reads a New Era
The rate signals carried immediate consequences for American homebuyers. Chen Zhao, head of economics research at Redfin, called it “a new era” and warned that mortgage rates were unlikely to retreat significantly in the near term. Bill Banfield of Rocket Mortgage noted that home sales were responding more to labor market strength than to rate movements and that determined buyers would continue entering the market—though the affordability calculus had shifted.
Vishal Garg, CEO of AI mortgage platform Better, cut to the practical point: “The Fed doesn’t set mortgage rates, but mortgage rates track long-term Treasury yields, which move based on investor expectations for inflation, growth, and the Fed’s next step.”
Warsh has separately announced five internal task forces to examine the Fed’s communication practices, data sources, and inflation-analysis frameworks—a structural reform effort that signals he intends a longer-term overhaul of the institution rather than a cosmetic change of tone.
What Comes Next
The path forward for markets hinges on three variables: whether consumer prices moderate fast enough to make hikes unnecessary, whether the labor market stays strong enough to absorb higher borrowing costs, and whether Warsh can maintain independence from a White House that publicly installed him to cut.
Kristina Hooper, chief market strategist at Man Group, summed up the market’s posture after the meeting: “Markets were holding out hope that Chair Warsh would throw them some kernels of real dovishness that they obviously felt they didn’t get.”
With BofA now projecting a rate corridor that would be the highest since 2007, and with inflation stubbornly running at twice the Fed’s target, the calculation Warsh faces is one no new Fed chair has confronted in a generation: tighten into a White House headwind or validate exactly the critics who warned his appointment was political.
Discover more from The Economy
Subscribe to get the latest posts sent to your email.

Male Labor Force Participation Rate 2026: Why Men Are Leaving & Economic Impact

Trump Tariffs 2026: Economic Impact, Household Costs & Trade War Outlook

China Economy 2026: Export Boom Masks Property Crisis & Investment Slump

US Inflation 4% May 2026: Is the Worst Over? Fed, Oil Prices

AI Memory Chip Shortage 2026: Nvidia, Apple & What Comes Next

US $39 Trillion National Debt 2026: Bond Market Warning Signs Explained

Ray Dalio US Suez Moment 2026: Dollar Decline, $39 Trillion Debt & Empire’s End

Kevin Warsh Fed Rate Hike 2026: What His Hawkish Pivot Means for Markets

Gold Price 2026: Will Gold Hit $6,000? JPMorgan Forecast, Drivers & Investment Guide

US Recession 2026: Four Key Threats, Warning Signs & How to Protect Your Portfolio

AI Energy Demand 2026: Data Centres, Power Grids & the $725B Infrastructure Boom

AI Semiconductor Selloff 2026: Micron Crash, Nasdaq Pullback & What Comes Next

US Tariffs 2026: How Trump’s 11.7% Effective Rate Is Reshaping Global Trade & Inflation

Global Stock Markets 2026: S&P 500 at Record Highs Amid War, Inflation & Rate Risk

KPMG Australia CEO Resigns After Whistleblower Claims Exposed Investigation Failures

PwC China Partner Payouts Cut Amid Evergrande Audit Fraud

Broadcom Market Value Loss: Revenue Forecast Disappoints

Investors Pile Into Bullish Dollar Bets as ‘US Exceptionalism’ Trade Returns

Here’s How Much It’ll Cost You to Be Part of SpaceX’s Record-Breaking $75 Billion IPO

Nasdaq Tumbles 4% as Chip and Memory Stocks Sink: A $1.2 Trillion Wipeout

How to Fix Pakistan’s Debt Economy: A Structural Blueprint

Smash Capital Leads $200M Funding for Allen Control Systems

Democrats Draw a Red Line Around Military AI — And the Pentagon Is Already Pushing Back

New Investment Super-Cycle: AI, Green Energy & Re-Shoring

Russia Overspends on Putin’s War in Ukraine by $28bn

Xponential Fitness Franchise Lawsuit: The $3.97M Judgment

Middle East Conflict Oil Prices: The $4 Surge Explained

The End of the Chatbot: Why OpenAI is Tearing Up Its Most Successful Product
-

 Markets & Finance6 months ago
Top 15 Stocks for Investment in 2026 in PSX: Your Complete Guide to Pakistan’s Best Investment Opportunities
-

 Analysis4 months ago
Top 10 Stocks for Investment in PSX for Quick Returns in 2026
-

 Analysis5 months ago
Brazil’s Rare Earth Race: US, EU, and China Compete for Critical Minerals as Tensions Rise
-

 Analysis4 months ago
Johor’s Investment Boom: The Hidden Costs Behind Malaysia’s Most Ambitious Economic Surge
-

 Banks5 months ago
Best Investments in Pakistan 2026: Top 10 Low-Price Shares and Long-Term Picks for the PSX
-

 Investment6 months ago
Top 10 Mutual Fund Managers in Pakistan for Investment in 2026: A Comprehensive Guide for Optimal Returns
-

 Global Economy6 months ago
15 Most Lucrative Sectors for Investment in Pakistan: A 2025 Data-Driven Analysis
-

 Global Economy6 months ago
Pakistan’s Export Goldmine: 10 Game-Changing Markets Where Pakistani Businesses Are Winning Big in 2025