
Analysis
Strait of Hormuz Oil Flows Grind to a Halt Amid Escalating Israel-Iran Missile Barrage: Death Toll Mounts and Global Energy Markets Teeter
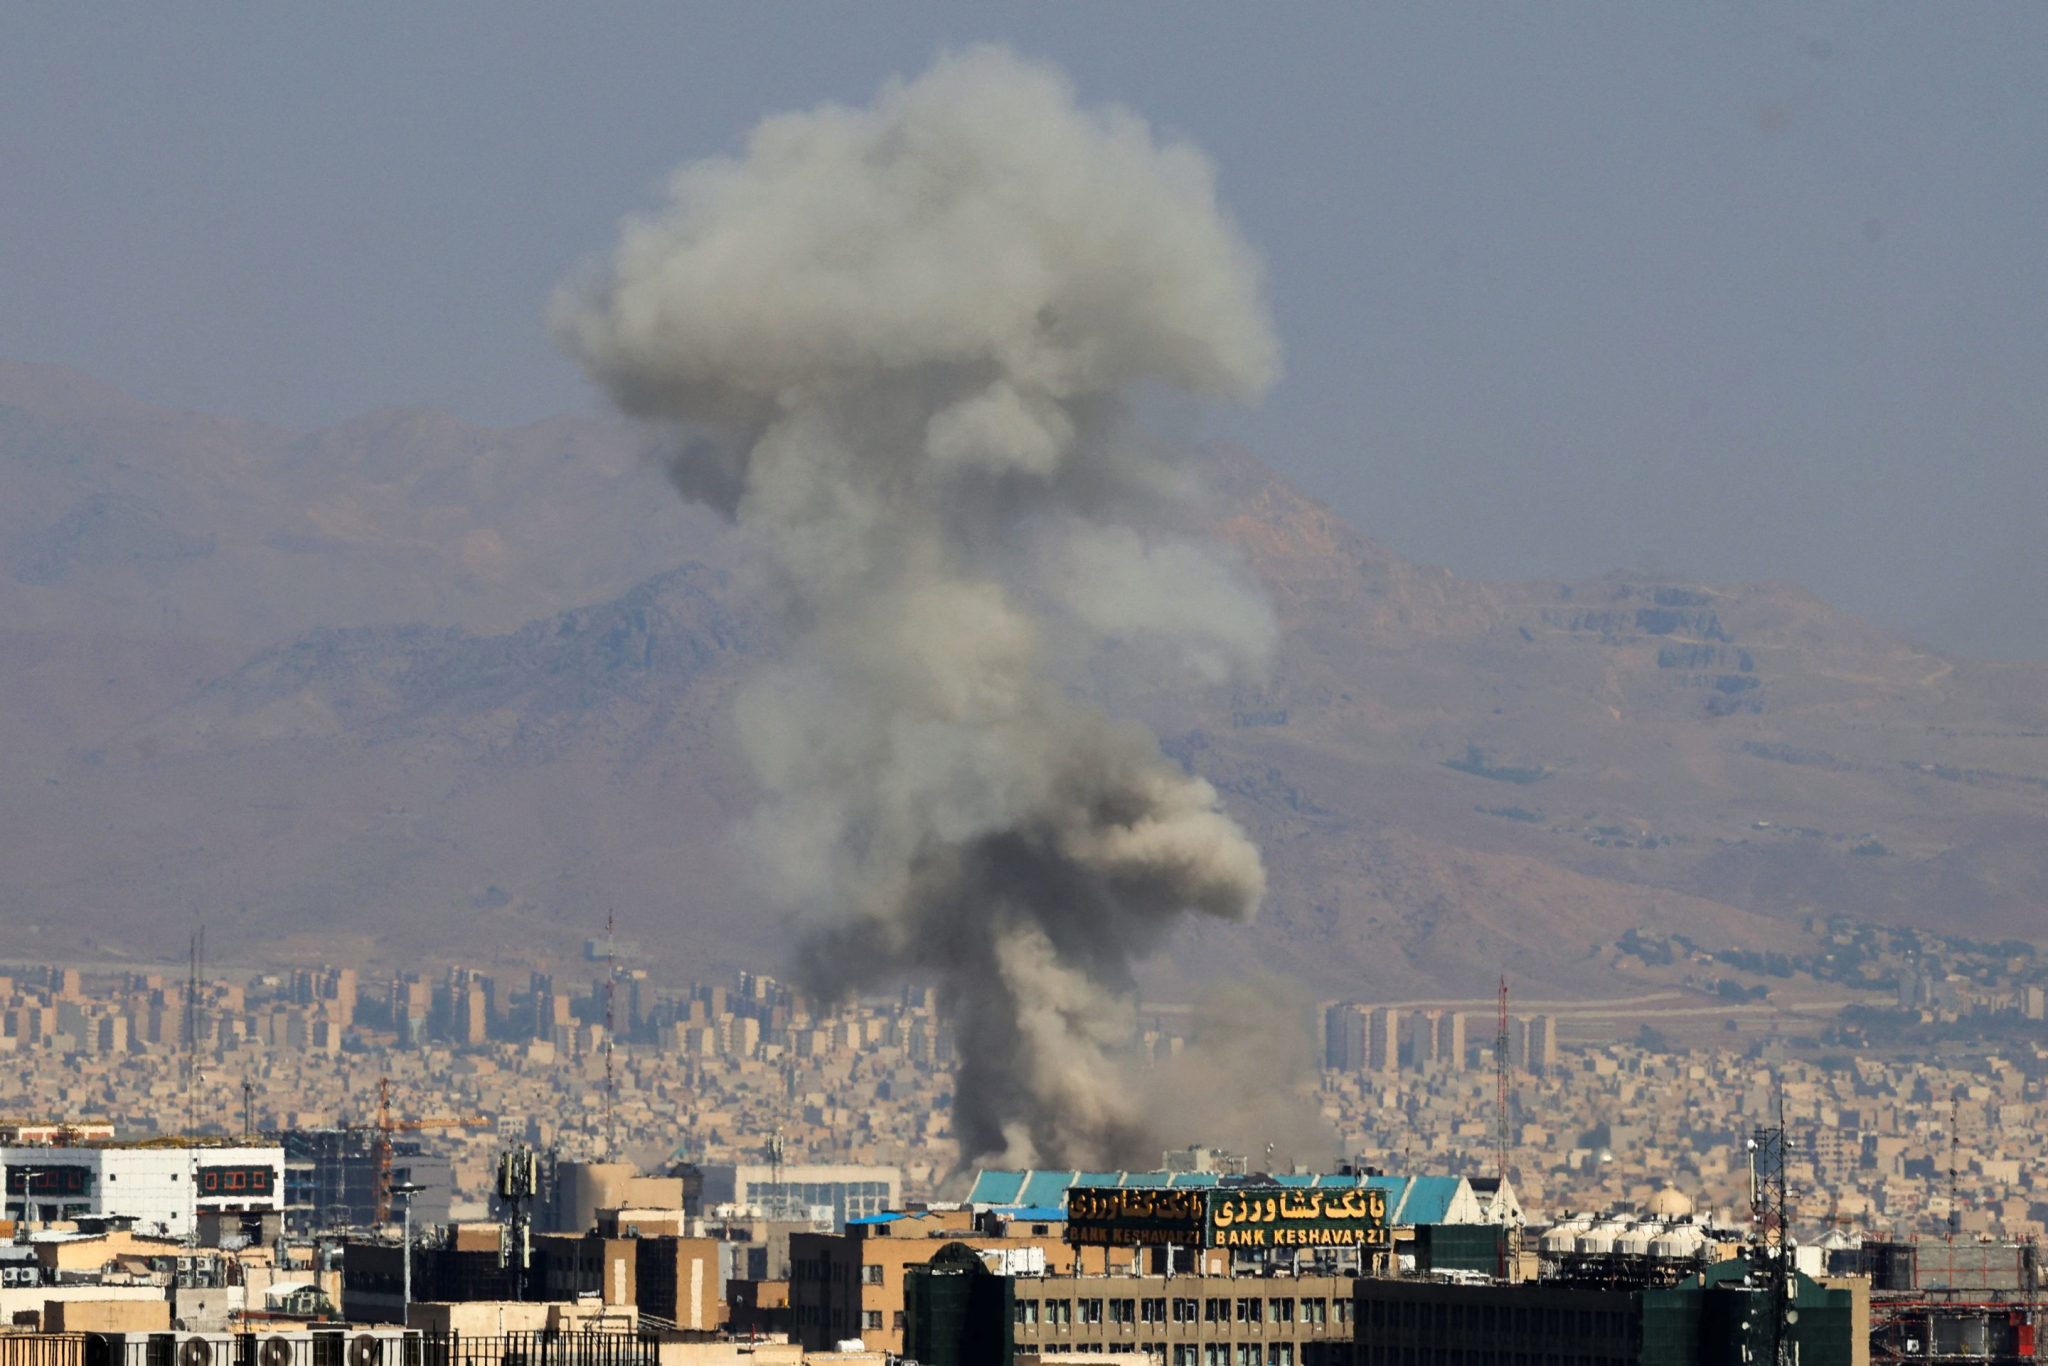
Twenty million barrels of daily oil flow hang in the balance as Iran and Israel exchange their most intensive missile salvos in the conflict’s history—threatening to transform a regional war into a global economic catastrophe.
By Staff Senior Correspondent, Global Energy Desk · With reporting from Tehran, Tel Aviv, Riyadh, and Washington Updated 2 March 2026, 14:32 GMT · 12 min read
📊 Key Metrics at a Glance
| Indicator | Value | Note |
|---|---|---|
| Brent Crude | $80.40 | ▲ +9.8% (24hr) · Eyeing $100 target |
| Flow at Risk | 20M bpd | 20% of global supply |
| Death Toll | 211+ | Iran: ~201 · Israel: ~9–10 · US: 3 |
| Tankers Halted | 47 | Major operators suspended transit |
On the morning of 2 March 2026, the Strait of Hormuz—a twenty-one-mile-wide channel that functions like a clogged artery in the global economy—fell quieter than it had in four decades of recorded maritime history. Tanker traffic had plummeted by an estimated 60 percent in forty-eight hours, according to shipping analytics firm Vortexa, as the world’s most consequential chokepoint absorbed the shockwaves of the most intensive Israel-Iran missile exchange since hostilities sharply escalated in February 2026. The human and economic costs are mounting with alarming symmetry: Iran’s Civil Defense Authority confirmed approximately 201 fatalities across Khuzestan and Bushehr provinces, while Israeli emergency services reported nine to ten civilian and military deaths in strikes on Haifa and the Negev. Three United States service members stationed in the region were also killed in rocket fire attributed to Iranian-backed proxies. The world is watching a regional war threaten to become a genuinely global energy crisis.
The Chokepoint Crisis: Why the Hormuz Strait Matters
To understand the severity of the current disruption, one must first appreciate the almost absurd concentration of risk that geography has bequeathed to the global oil trade. The Strait of Hormuz, nestled between Iran to the north and Oman to the south, carries roughly 20 million barrels of crude oil and petroleum products every single day—approximately one-fifth of total global supply, and fully 30 percent of seaborne oil trade, according to the U.S. Energy Information Administration. Critically, Al Jazeera‘s analysis of Hormuz shipping data confirms that Asia absorbs approximately 84 percent of all oil flowing through the strait—meaning that the economies of China, India, Japan, and South Korea are disproportionately exposed to any disruption of the corridor.
For the past 72 hours, that corridor has been, in practical terms, a war zone. Shell, TotalEnergies, BP, and Trafigura have all suspended new tanker transits, according to Reuters, mirroring the flight responses of shipping insurers who have invoked war-risk clauses and suspended coverage for Hormuz passages. The Lloyd’s of London Market Association placed the strait in its “Listed Areas” classification—a designation that effectively doubles or triples insurance premiums—within hours of the first confirmed missile strike on a vessel in Iranian territorial waters on 1 March.
“This is not a price spike. This is a structural rupture. The question is no longer whether markets will be disrupted, but for how long the world can absorb the shock before second-order crises begin cascading through Asian manufacturing chains.”
— Senior Energy Economist, HSBC Global Research, March 2026
Oil Flow Disruptions: A Country-by-Country Breakdown
| Country / Region | Pre-Crisis Daily Flow | Estimated Disrupted | % Exports via Hormuz | Alternate Route Available? |
|---|---|---|---|---|
| Saudi Arabia | 6.2 million bpd | ~4.8 million bpd | 77% | East-West Pipeline (max 2.0M bpd) |
| Iran | 1.8 million bpd | ~1.8 million bpd | 100% | None |
| UAE | 3.1 million bpd | ~2.1 million bpd | 68% | Habshan-Fujairah (1.5M bpd) |
| Iraq | 3.5 million bpd | ~3.3 million bpd | 94% | Kirkuk-Ceyhan (limited, conflict-damaged) |
| Kuwait | 2.3 million bpd | ~2.3 million bpd | 100% | None |
| Qatar (LNG) | 1.8M bpd equiv. | ~1.8 million bpd | 100% | None |
| ⚠ TOTAL | ~20 million bpd | ~16–18 million bpd | — | Bypass capacity: max 3.5–4M bpd |
The mathematics are brutal. Even with full utilization of alternate pipeline infrastructure—Saudi Arabia’s East-West Pipeline, capable of carrying up to 2 million barrels daily, and the UAE’s Habshan-to-Fujairah link at 1.5 million barrels daily—the bypass capacity barely scratches the surface of what is at stake. CNN‘s oil flow tracking data, corroborated by independent monitors at Kpler, suggests that even best-case rerouting through these corridors replaces only 3.5 to 4 million of the roughly 20 million barrels in jeopardy, leaving the global market to absorb a net shortfall of 8 to 10 million barrels per day in any sustained closure scenario.
Markets in Freefall: The Price Mechanics of Catastrophe
Brent crude opened the March 2 session at $80.40 per barrel—a 9.8 percent surge from Friday’s close, its steepest single-day gain since the Russian invasion of Ukraine in 2022, per Reuters. WTI followed at $78.10. Gasoline futures on NYMEX spiked 12 percent. But those numbers, dramatic as they are, almost certainly understate the trajectory if hostilities persist.
Rystad Energy’s crisis modeling, circulated to clients on the morning of 2 March, outlines three scenarios:
| Scenario | Duration | Brent Target | Probability |
|---|---|---|---|
| Base Case | 3–7 days, diplomatic resolution | ~$90 | ~60% |
| Adverse | 2–4 week strait closure | $100+ | ~25% |
| Severe | 1+ month military blockade | $115–$130 | ~15% |
⚡ Key Economic Pressure Points — March 2026
- UBS estimates a $10 rise in oil sustained for 12 months adds approximately 0.4–0.6 percentage points to global headline inflation.
- Goldman Sachs flags Asian central banks—already at the limits of rate flexibility—as most exposed to renewed imported inflation.
- Japan imports 87% of its crude via Hormuz; South Korea, 76%; India, approximately 60%—creating an acute shared vulnerability.
- OPEC’s 3.5 million bpd spare capacity, concentrated in Saudi Arabia and UAE, is itself partially bottlenecked by the Hormuz transit constraints.
- Global strategic petroleum reserves (SPR) total roughly 1.4 billion barrels—enough to cover approximately 40 days of the disrupted volume.
- LNG spot prices for Asian delivery jumped 18% in 48 hours, according to S&P Global Commodity Insights.
The Human Arithmetic of War: Casualties and Communities Under Fire
Behind every barrel figure lies a far more urgent accounting. In Iran’s southwestern Khuzestan province—home to the country’s most productive oil fields and a population of roughly 4.7 million—the strikes of 1 March left at least 143 confirmed dead, with dozens more missing beneath the rubble of residential blocks in Ahvaz and industrial facilities near Abadan, according to Iranian state media and corroborating reports from The Guardian. A further 58 fatalities were reported across Bushehr, where the presence of Iran’s nuclear power plant added an acute layer of geopolitical anxiety to the grief. The International Committee of the Red Cross issued an emergency statement calling for immediate humanitarian corridors.
In Israel, the strikes on Haifa’s industrial port district killed seven civilians and wounded thirty-four, while two Israeli Defense Forces soldiers died in a ballistic missile impact near Dimona in the Negev Desert, per Israeli emergency services and confirmed by The New York Times. Three U.S. service members—assigned to a joint logistics facility in northern Saudi Arabia—were killed in a drone strike attributed by Washington to Iranian-linked militia group Kataib Hezbollah. The Pentagon’s statement was carefully worded, stopping short of direct attribution to Tehran, but the White House’s subsequent communication to Iranian back-channels, reported by the Washington Post, left little ambiguity about American red lines.
The humanitarian dimensions of this conflict resist reduction to strategic calculation. In the port city of Bandar Abbas—Iran’s principal gateway to the Hormuz Strait—fishing families who have lived by the sea for generations are now sheltering in schools, their boats moored and their livelihoods suspended alongside the supertankers. The texture of suffering in a war like this is never captured by death tolls alone.
Geopolitical Architecture: How We Arrived at the Brink
The immediate trigger for the current escalation was a series of Israeli precision strikes on what Jerusalem characterized as advanced missile production facilities in Parchin and a Revolutionary Guard naval base near Bandar Abbas—strikes that Iran’s Supreme National Security Council described as “acts of open war” requiring a proportionate and “asymmetric” response. That response came in the form of a salvo of over 200 ballistic missiles and drones launched between the evening of 28 February and the early hours of 1 March, the largest such exchange since the October 2023 escalation cycle.
The United States, which has maintained an elevated naval presence in the Gulf through Carrier Strike Group 11, shot down an estimated 60 percent of the incoming Iranian projectiles in coordination with Israeli air defenses. But the political and symbolic damage of the exchange transcended its military outcomes: for the first time, Iran explicitly threatened to “exercise sovereign rights” over Hormuz transit—language that international maritime lawyers and energy strategists immediately recognized as the rhetorical prelude to a potential strait blockade.
Expert Analysis: Forecasts from Rystad, EIA, HSBC, and UBS
The analytical community is operating in rare unanimity about the severity of the situation, if not its precise trajectory. Arne Lohmann Rasmussen, Chief Analyst at Global Risk Management, described the crisis as “the most consequential threat to Hormuz transit since the Tanker War of 1984–88.” The EIA, in an emergency market note issued late on 1 March, revised its Q2 2026 Brent price band upward by $18 to a range of $88–$105, citing the compounding effect of already-tightened OPEC+ production schedules and limited SPR drawdown capacity.
HSBC’s Global Energy Research team flagged an underappreciated second-order risk: the impact on petrochemical feedstocks. “Asia’s refining complex is not configured to pivot rapidly to alternative crude slates,” the note read. “An eight-to-ten-million-barrel daily shortfall, even for two weeks, creates bottlenecks that resonate through plastics, fertilizers, and pharmaceutical precursors—sectors that global supply chains have never stress-tested against a Hormuz closure of this magnitude.” UBS, meanwhile, estimated that a six-week disruption would reduce Asian GDP growth by 0.8–1.2 percentage points in 2026, with India absorbing the deepest structural hit.
“OPEC’s spare capacity is not a magic lever. Most of it sits behind the same geographic bottleneck it is supposed to compensate for. The world has built a system where the cure and the disease share the same address.”
— Energy Policy Analyst, Oxford Institute for Energy Studies, 2 March 2026
The Bypass Illusion: Saudi and UAE Alternate Routes
Policymakers and market participants have repeatedly invoked alternate pipeline infrastructure as a potential pressure valve. The reality is considerably more constrained:
| Pipeline | Owner | Max Capacity | Current Est. Throughput | Terminus |
|---|---|---|---|---|
| East-West Pipeline | Saudi Aramco | 5.0M bpd | ~2.0M bpd | Yanbu, Red Sea |
| Habshan-Fujairah | ADNOC | 1.5M bpd | ~1.3M bpd | Fujairah, Gulf of Oman |
| Kirkuk-Ceyhan | Iraq/Turkey | 1.6M bpd | ~0.4M bpd (conflict-damaged) | Ceyhan, Mediterranean |
| Combined Realistic Bypass | — | — | ~3.5–4.0M bpd | — |
These corridors can divert at most 3.5 to 4 million barrels of the 20 million at risk—a bypass ratio that The Guardian‘s shipping correspondent characterized as “the equivalent of detouring a superhighway through a country lane.”
Asian Vulnerabilities: The 84 Percent Problem
For Asian economies, the Hormuz crisis is existential in a way it simply is not for Europe or North America:
| Economy | Hormuz Crude Dependency | Strategic Reserve Coverage | Emergency Response |
|---|---|---|---|
| Japan | ~87% | ~180 days | IEA coordinated release activated |
| South Korea | ~76% | ~130 days | Emergency cabinet convened 2 March |
| India | ~60% | ~90 days | Diplomatic missions to Riyadh, Moscow, Washington |
| China | ~55% | ~95–100 days (est.) | Aggressive spot buying, West Africa & Americas |
The asymmetry of exposure between East and West is not merely an economic footnote—it is a geopolitical faultline. If the crisis deepens, the divergent energy security interests of Asian importers and Western allies could complicate the construction of any unified diplomatic response, providing Iran with precisely the leverage its strategic doctrine has long sought to exploit.
Forward Implications: Scenarios, Diplomacy, and the Long Game
The most credible near-term diplomatic pathway runs through Oman, which has historically served as the back-channel of choice for U.S.-Iran communications. Omani Foreign Minister Badr Albusaidi was reportedly in contact with Iranian and American counterparts as of 1 March, but sources familiar with the talks described the atmosphere as “deeply unpromising.” A ceasefire framework, if it emerges, will almost certainly require verifiable Israeli pauses in airstrikes and reciprocal Iranian commitments on strait transit guarantees—conditions that current domestic political pressures in both Jerusalem and Tehran make extraordinarily difficult to operationalize.
In the medium term, the crisis will accelerate three structural trends already underway:
- Supply chain diversification — Asian oil importers pivoting toward the Americas and West Africa to reduce Hormuz dependency.
- LNG infrastructure acceleration — Qatar, Australia, and the United States will see renewed urgency in building strait-independent gas supply capacity.
- Energy transition momentum — The fragility of fossil fuel logistics chains, now viscerally apparent to policymakers from Tokyo to New Delhi to Berlin, strengthens the political economy of renewables investment.
The irony is almost Shakespearean—a war fought partly over the tools of the old energy order may ultimately hasten its unraveling.
But those are medium-term consolations. In the immediate term, the world must contend with the fact that twenty million barrels of daily supply—the lifeblood of the modern industrial economy—flows through a channel that is, right now, a battlefield. The Strait of Hormuz has always been humanity’s most consequential geographic gamble. That gamble, this week, is being called.
📬 Stay ahead of the crisis with real-time Energy & Geopolitics briefings—trusted by analysts at Goldman Sachs, Rystad Energy, and the IEA. Subscribe to the Global Energy Desk.
Related Analysis from the Global Energy Desk
- The Tanker War Playbook: How Iran Has Weaponized the Strait Before—and What It Cost the World · Energy & Geopolitics · February 2026
- Asia’s Hormuz Dependency: Why China, India, and Japan Have No Good Options If the Strait Closes · Energy Security · January 2026
- OPEC’s Spare Capacity Mirage: Why the World’s Emergency Oil Buffer Is Less Reassuring Than It Looks · Markets & Commodities · December 2025
- Beyond Brent: How an Israel-Iran War Would Cascade Into Fertilizers, Plastics, and Food Prices · Global Economy · November 2025
- The $100 Threshold: What History Tells Us About Oil Price Shocks and Recessionary Risk · Economic Modeling · October 2025
Discover more from The Economy
Subscribe to get the latest posts sent to your email.


Federal Reserve Chair Kevin Warsh is expected to break with recent central bank tradition by withholding the so-called “dot plot” from the Fed’s upcoming rate outlook, according to market reporting. The move, if it happens, would mark a meaningful shift in how the Fed communicates its policy intentions to markets — and investors are already trying to read between the lines.
What the Dot Plot Actually Does
The Fed’s dot plot is a closely watched chart in which individual policymakers anonymously indicate where they expect interest rates to be at various points in the future. It has become one of the most scrutinized pieces of Fed communication, often moving markets within seconds of release as traders parse shifts in the median projection.
Withholding it — even temporarily — would strip markets of a tool they’ve relied on for years to gauge the Fed’s collective thinking on the path of rates.
Why Warsh Might Make This Call
Central bank watchers see a few possible explanations. One is that policymakers themselves are deeply divided on the path forward, given competing pressures: inflation risk tied to energy markets and geopolitical tension, against a backdrop of economic data that has sent mixed signals. Publishing a dot plot under those conditions risks creating a misleading sense of consensus — or worse, an overly wide dispersion of dots that itself becomes a market-moving story.
Another possibility is a deliberate strategic choice by Warsh to reduce the market’s reliance on point-in-time projections that have a track record of being revised significantly as conditions change.
Markets Don’t Like a Vacuum
Whatever the reasoning, removing a key piece of forward guidance tends to inject uncertainty rather than calm it. Traders who have built models and positioning around anticipated dot-plot signals will need to rely more heavily on the Fed’s statement language and the chair’s press conference comments to infer policy intentions — a less precise exercise that could increase volatility around the announcement itself.
What to Watch Next
The real test will come at the actual policy meeting. If Warsh does withhold the dot plot, attention will shift to whether this becomes a one-time decision tied to unusual circumstances, or a more lasting change in how the Powell-era tool is used going forward.
Discover more from The Economy
Subscribe to get the latest posts sent to your email.

Michael Burry, the investor who rose to fame for correctly predicting the 2008 housing market collapse, has revealed he considered betting against Elon Musk’s SpaceX — but ultimately decided against it. The admission, surfacing just as SpaceX moves toward a long-anticipated public listing, has quickly become one of the most talked-about lines in markets this week.
Why Burry’s Words Carry Weight
Few investors generate headlines the way Burry does. His reputation as a contrarian who isn’t afraid to bet against popular narratives means that even a passing comment about being “tempted” to short a company is enough to move conversation across trading desks and social media alike. The fact that he chose not to follow through only adds intrigue, leaving observers to speculate about what gave him pause.
The SpaceX Backdrop
The comments land at a notable moment for SpaceX, which has been the subject of growing market attention as talk of an eventual IPO continues to build. SpaceX has become one of the most closely watched private companies in the world, with a valuation that has climbed steadily on the back of its dominance in commercial launch services and its expanding satellite internet business.
A short bet against a company of SpaceX’s scale and momentum would be a high-risk, high-conviction move — exactly the kind of trade Burry has built his reputation on, which is part of why his decision to pass is drawing as much attention as the idea itself would have.
Reading Between the Lines
Without elaborating on his specific reasoning, Burry’s comment leaves room for interpretation. It could reflect genuine respect for SpaceX’s fundamentals and growth trajectory, or simply an acknowledgment that shorting a company with no current public listing — and significant insider control — is a structurally difficult trade to execute profitably.
The Takeaway
Whether or not Burry ever acts on the instinct, the episode is a reminder of how much weight markets still place on the views of investors with a track record of contrarian calls — even when, as in this case, the headline is really about a bet that didn’t happen.
Discover more from The Economy
Subscribe to get the latest posts sent to your email.

Global financial markets are fixated on a single question this week: will the US-Iran ceasefire hold? The answer carries outsized consequences for oil prices, inflation expectations, and the Federal Reserve’s next move — and investors are already repositioning in anticipation of either outcome.
Why the Ceasefire Matters to Your Portfolio
The logic is straightforward but high-stakes. A breakdown in the truce and renewed military strikes would almost certainly push oil prices sharply higher, reigniting an inflation problem the Federal Reserve is still working to contain. That scenario would complicate the central bank’s policy path just as it appeared to be gaining clarity.
In response, investors have already begun shifting capital out of richly valued technology shares and into steadier, more defensive sectors — a classic risk-off rotation that reflects caution rather than panic.
A Familiar Market Split
That caution showed up clearly in recent trading. A bounce in chip stocks early in the week faded quickly, dragging the technology-heavy Nasdaq down nearly 1%, while financial and industrial names that dominate the Dow Jones Industrial Average held their ground. The Nasdaq slipped 0.97% to 25,678.82 as the chip-stock recovery lost steam, while the S&P 500 dropped 0.26%, with technology and energy the only two sectors finishing in negative territory. The Dow, by contrast, edged up 0.17%.
The Dollar’s Role in the Deal
Beyond the immediate market mechanics, the ceasefire arrangement reportedly carries broader implications for the US dollar’s standing in global trade and reserve systems, with reporting suggesting the deal includes provisions aimed at protecting the dollar’s international role even as the geopolitical landscape shifts.
Treasury Demand Adds to the Unease
The geopolitical uncertainty is landing at an awkward moment for US debt markets. A recent three-year Treasury note auction cleared at a yield of 4.192%, up from 3.965% at the prior auction — the latest in a string of weaker-than-expected demand signals. When the Treasury has to offer higher yields to attract buyers, it typically signals softening appetite for US government debt, adding another layer of complexity for policymakers already juggling geopolitical risk and inflation concerns.
The Bottom Line
For now, markets are in a holding pattern — repositioning rather than panicking, but clearly pricing in the possibility that the ceasefire could unravel. Energy markets, the bond market, and Federal Reserve policy all sit downstream of how the situation develops in the coming days.
Discover more from The Economy
Subscribe to get the latest posts sent to your email.

Fed Chair Warsh Expected to Withhold the ‘Dot Plot’ — Here’s Why That’s a Big Deal

Michael Burry Says He’s Tempted to Short SpaceX — But He’s Passing, For Now

Weak Demand at Treasury Auctions Is Quietly Rattling Bond Investors

Markets Hold Their Breath as US-Iran Ceasefire Faces Its First Real Test

Fiserv Names New CEO as Industry Veteran Takis Georgakopoulos Takes the Helm

Japan’s Property Sector Looks Strong. So Why Are Investors Going Abroad?

17 Fusion Startups Have Now Raised Over $100M Each — and the Total Keeps Climbing

Warren Raises €10M to Fix Belgium’s Broken Workplace Pensions

Finance Bill 2026: Extraction Cannot Deliver

Big Tech and the UK’s Unrest: Algorithm, Not Conspiracy

BankIslami Launches BIPL Exchange: What It Means

ABHI MFB, NADRA Technologies to Accelerate Digital Transformation

Top 7 Banking Stocks for Investment in PSX: Pakistan’s Lenders Are Still Printing Money

Top 5 Best Performing Islamic Banks in Pakistan

China Overhauls the World’s Biggest Surveillance Network with Advanced AI

Kevin Warsh Takes the Fed’s Helm — and Walks Straight Into a Rate-Hike Storm

SpaceX, OpenAI & Anthropic IPOs: Wall Street’s $200B AI Test

How AI Is Forcing McKinsey and Its Peers to Rethink Pricing

SpaceX IPO: Inside the $2 Trillion Market Debut

KPMG Australia CEO Resigns After Whistleblower Claims Exposed Investigation Failures

PwC China Partner Payouts Cut Amid Evergrande Audit Fraud

Broadcom Market Value Loss: Revenue Forecast Disappoints

Pakistan Budget FY 2026-27: Relief, Prospects, and the Tightrope Walk

The Guardrails Are Down: How Meta and Google’s AI Models Fold Under Pressure

Benefitbay Raises $18M to Build the Plumbing for America’s ICHRA Shift

Nasdaq Tumbles 4% as Chip and Memory Stocks Sink: A $1.2 Trillion Wipeout

Here’s How Much It’ll Cost You to Be Part of SpaceX’s Record-Breaking $75 Billion IPO

Japanese Mid-Sized Firms Flock to Southeast Asia for Growth
-

 Markets & Finance5 months ago
Top 15 Stocks for Investment in 2026 in PSX: Your Complete Guide to Pakistan’s Best Investment Opportunities
-

 Analysis4 months ago
Top 10 Stocks for Investment in PSX for Quick Returns in 2026
-

 Analysis4 months ago
Brazil’s Rare Earth Race: US, EU, and China Compete for Critical Minerals as Tensions Rise
-

 Banks5 months ago
Best Investments in Pakistan 2026: Top 10 Low-Price Shares and Long-Term Picks for the PSX
-

 Investment5 months ago
Top 10 Mutual Fund Managers in Pakistan for Investment in 2026: A Comprehensive Guide for Optimal Returns
-

 Analysis4 months ago
Johor’s Investment Boom: The Hidden Costs Behind Malaysia’s Most Ambitious Economic Surge
-

 Global Economy6 months ago
15 Most Lucrative Sectors for Investment in Pakistan: A 2025 Data-Driven Analysis
-

 Global Economy6 months ago
Pakistan’s Export Goldmine: 10 Game-Changing Markets Where Pakistani Businesses Are Winning Big in 2025