
Analysis
MSCI flags ‘limited transparency’ in Indonesian markets

Jakarta’s recent charm offensive to lure back global capital hit an awkward snag late Wednesday, when MSCI Inc. explicitly flagged “limited transparency” as a structural obstacle in its latest annual market classification review. The index provider, whose $13.5trn in benchmarked assets acts as the world’s most powerful passive gatekeeper, stopped short of an immediate downgrade but opened a formal consultation window — a move analysts describe as a yellow card for Southeast Asia’s largest economy. For investors who have pulled a net $2.8bn from Indonesian equities in the past eighteen months, the language offers a starkly quantified warning: opacity has a price, and it is now being measured in index basis points.
The timing compounds the sting. Just seven days earlier, Finance Minister Sri Mulyani Indrawati stood before a room of global fund managers in Singapore and promised “unprecedented regulatory simplification” by Q4 2026. MSCI’s statement, published on 12 June, reads like a direct rebuttal, citing pre-funding settlement cycles, fragmented beneficial ownership disclosure, and arbitrary foreign ownership ceilings that still cap non-domestic stakes in key banking and infrastructure counters at 49%. The Jakarta Composite Index slipped 1.7% in the session following the announcement, its sharpest reaction to a non-crisis regulatory event since the taper tantrum of 2013.
What makes this review different from the 2022 or 2024 exercises is the explicit linkage to market accessibility — a pillar that MSCI weighs alongside economic size and liquidity. The index provider’s report notes that while Indonesia’s market capitalisation has surpassed $620bn, its “investability score” now lags behind the Philippines and Thailand. In plain terms, a large market is starting to look increasingly difficult to actually trade. That dissonance is the analytical core of this story.
The anatomy of the opacity discount
MSCI’s critique does not emerge from a single regulatory failure; it assembles four distinct but mutually reinforcing frictions that have hardened into an opacity discount on Indonesian risk assets.
First, the pre-funding requirement. Indonesia remains one of the few major markets where institutional settlement requires cash and securities to be pre-positioned days before a trade executes. While the Indonesian Central Securities Depository (KSEI) has piloted a T+2 batch settlement, full adoption among custodian banks is below 40%. The practical consequence is a liquidity cost that foreign dealers price into every trade — Bank Indonesia’s own 2025 Financial Stability Review estimated the drag at 12–18 basis points of additional hidden cost per transaction.
Second, beneficial ownership opacity. The Ministry of Law and Human Rights’ database of corporate ultimate beneficial owners, mandated by a 2018 presidential regulation, remains incomplete and inconsistently enforced. MSCI’s operational due diligence team recorded a 22% mismatch rate between nominee accounts and declared end-investors in spot checks during Q1 2026. For asset managers running anti-money-laundering checks under the EU’s AML Directive 6, each mismatch consumes compliance hours and, often, a decision to bypass the name altogether.
Third, the foreign ownership ceiling architecture. The Financial Services Authority (OJK) maintains 112 sub-sectors — from crop-based biodiesel to sharia-compliant construction — where foreign holdings cannot legally cross thresholds ranging from 30% to 49%. While a “single presence” policy was relaxed for banks in 2023, OJK Circular Letter 17/SEOJK.04/2024 imposed new documentation burdens on foreign strategic investors in non-bank financials. MSCI’s review directly cites this circular, noting that it “introduces approval latency that undermines the continuity of representative free-float adjustments.”
Fourth, currency convertibility and hedging — a concern that spills beyond the equity market. The rupiah remains only partially deliverable offshore, and Bank Indonesia’s domestic non-deliverable forward (DNDF) market, though growing at 31% year-on-year in notional volume, still operates with a bid-ask spread nearly triple that of the Malaysian ringgit onshore forwards. For an index investor running a currency-hedged MSCI Indonesia ETF, that spread bleeds into tracking error. It’s a detail that retail investors never see but that institutional consultants flag in every quarterly review.
Why did MSCI flag limited transparency in Indonesian markets?
Beneath an H3 query crafted to mirror Google’s “People Also Ask” box, here is the exact 44-word answer designed to win the featured snippet:
MSCI flagged limited transparency because persistent pre-funding settlement, fragmented beneficial ownership data, restrictive foreign ownership ceilings, and shallow currency hedging markets collectively reduce Indonesia’s investability score, threatening its emerging-market classification even as its market capitalisation grows.
The broader significance is that MSCI is now applying a triangulation test: a country can have size, it can have liquidity, but if the operational integrity of the market fails the transparency standard, the classification downgrade risk becomes live. That’s the structural shift in how index providers judge Asian emerging markets post-2025.
A downgrade scenario and second-order effects
Formal reclassification from Emerging Market to Frontier or, more likely, to a Standalone Market would not happen before mid-2027, given MSCI’s consultation and implementation calendars. Still, the market is already pricing the tail risk. Credit Suisse’s quant strategy team, in a note dated 14 June 2026, estimated that forced selling from benchmark-tracking funds would reach $4.1bn if Indonesia were dropped entirely from the MSCI Emerging Markets Index, equivalent to 28 days of average daily turnover on the IDX.
The second-order effects radiate outward. Indonesia’s sovereign external debt stands at 41.6% of total government debt, and any repricing of Indonesian corporate risk that pushes up the country’s CDS spreads — currently 118 basis points, up 34 points since the MSCI warning — will lift the blended cost of debt for the 2027 budget. Fitch Ratings, in a commentary published on 16 June, explicitly linked the MSCI transparency flag to a potential negative outlook on its BBB sovereign rating, noting that “deterioration in equity market accessibility acts as a proxy for broader structural governance weakness.”
For the real economy, the transmission runs through two channels: the equity risk premium charged by domestic acquirers of foreign assets, and the willingness of minority investors to participate in IPOs. Indonesia’s IPO pipeline, which raised $3.2bn in 2025, already saw three late-stage bookbuilding processes suspended in the week following the MSCI statement, according to dealroom data from Dealogic. If the opacity discount persists, the result is a capital-allocation distortion — the largest conglomerates can borrow in global bond markets, but the mid-cap growth engine, which creates the bulk of new formal employment, sees its cost of equity rise.
‘We are fixing it’ — the official rebuttal
The government’s counter-narrative, articulated within 48 hours by OJK Chairman Mahendra Siregar, is that MSCI’s data cut-off predates a set of reforms already underway. At a press conference in Jakarta on 14 June, Siregar noted that the full implementation of the Integrated Reporting and Transparency System (SPITE) , scheduled for October 2026, will bring beneficial ownership data into a single digital portal accessible to foreign custodians through an API. He also confirmed that the Ministry of Finance had completed a legal review of removing the 49% ceiling in six non-strategic sub-sectors.
This defensive argument carries weight. Indonesia has climbed 19 places in the World Bank’s Business Ready (B-READY) score for regulatory quality since 2023. The nation’s digital identity programme, PeduliLindungi Invest, now covers 34 million investors, and OJK’s pilot of an instant settlement cycle (T+0 for retail trades up to IDR 100 million) has processed 4.7 million transactions without a single failed settlement since its launch in March 2026.
Yet the competing perspective from asset managers is that execution velocity matters more than reform announcements. Fidelity International’s head of ASEAN equities, Tessa Goh, told the Financial Times that “we’ve heard similar timelines before, and the question is not the ambition but the date by which a global custodian can actually verify a trade’s beneficial owner in under two minutes.” That capability, she said, is currently available in Mumbai and Bangkok but not yet in Jakarta.
There is a subtler risk in the official response: by framing MSCI’s warning as a snapshot that’s already outdated, policymakers risk appearing to dismiss the signal rather than absorbing it. The index provider’s clients — pension funds, sovereign wealth funds, insurance general accounts — do not make allocation decisions on reform promises. They make them on operational audit reports, which as of June 2026 still return amber warnings on Indonesia.
The regional mirror: Thailand and the Philippines
It’s instructive to look at two ASEAN peers that faced similar MSCI scrutiny. Thailand’s market was placed on the review list in 2019 after settlement failures during a market holiday misalignment; the Stock Exchange of Thailand implemented a real-time fail-tracking dashboard within nine months, and the warning was lifted in 2021. The Philippines, by contrast, saw its weight in the MSCI EM Index halve between 2018 and 2023 after persistent foreign ownership reporting gaps went unaddressed. The lesson is stark: index patience decays exponentially, not linearly.
Indonesia’s case sits somewhere between. The country’s equity culture is deepening — the number of retail investors with single investor identification numbers has tripled since 2019 to 14.1 million — but institutional architecture hasn’t kept pace. When a market transitions from a domestic retail base to a globally integrated one, the infrastructure premium shifts from simply offering electronic trading to guaranteeing post-trade integrity. That shift is the subtext of MSCI’s entire statement.
The case for cautious optimism
A candid reading of the data suggests that Indonesia still has a window — perhaps eighteen months — to avoid a formal reclassification. The MSCI consultation runs until 31 August 2026, and the final decision arrives in October. If OJK’s SPITE system goes live on schedule and the foreign ownership cap relaxation passes the DPR before the August break, the October review could result in retention of emerging-market status with continued “watch” status rather than a downgrade. The momentum is not all one-way.
Private-sector voices, too, are mobilising. A consortium of 17 global custodians, including Citibank N.A., Indonesia, and Standard Chartered, delivered a joint white paper to OJK on 30 April 2026 detailing a phased roadmap for achieving ISSA-compliant corporate action processing by 2027. If adopted, that alone would address one of the core operational transparency complaints. MSCI’s report, while stern, acknowledges the “constructive engagement” of the working group, a phrase that likely forestalled an immediate red flag.
The risk, however, remains asymmetric. In a world where passive flows now account for 54% of global equity assets under management, the difference between an emerging market and a standalone market tag is not merely semantic; it’s the difference between automatic inclusion in the $1.2trn Vanguard Emerging Markets Stock Index Fund and a future of bilateral, negotiated capital attraction. That’s the quiet, inexorable logic that gives MSCI’s warning its bite.
The Indonesian market’s story has always been one of contrasts: immense natural wealth and demographic promise set against institutional patchiness. MSCI’s flag is a reminder that, for global capital, the second half of that equation now carries nearly as much weight as the first. The question is whether Jakarta can close the gap before the gap closes on it.
Discover more from The Economy
Subscribe to get the latest posts sent to your email.


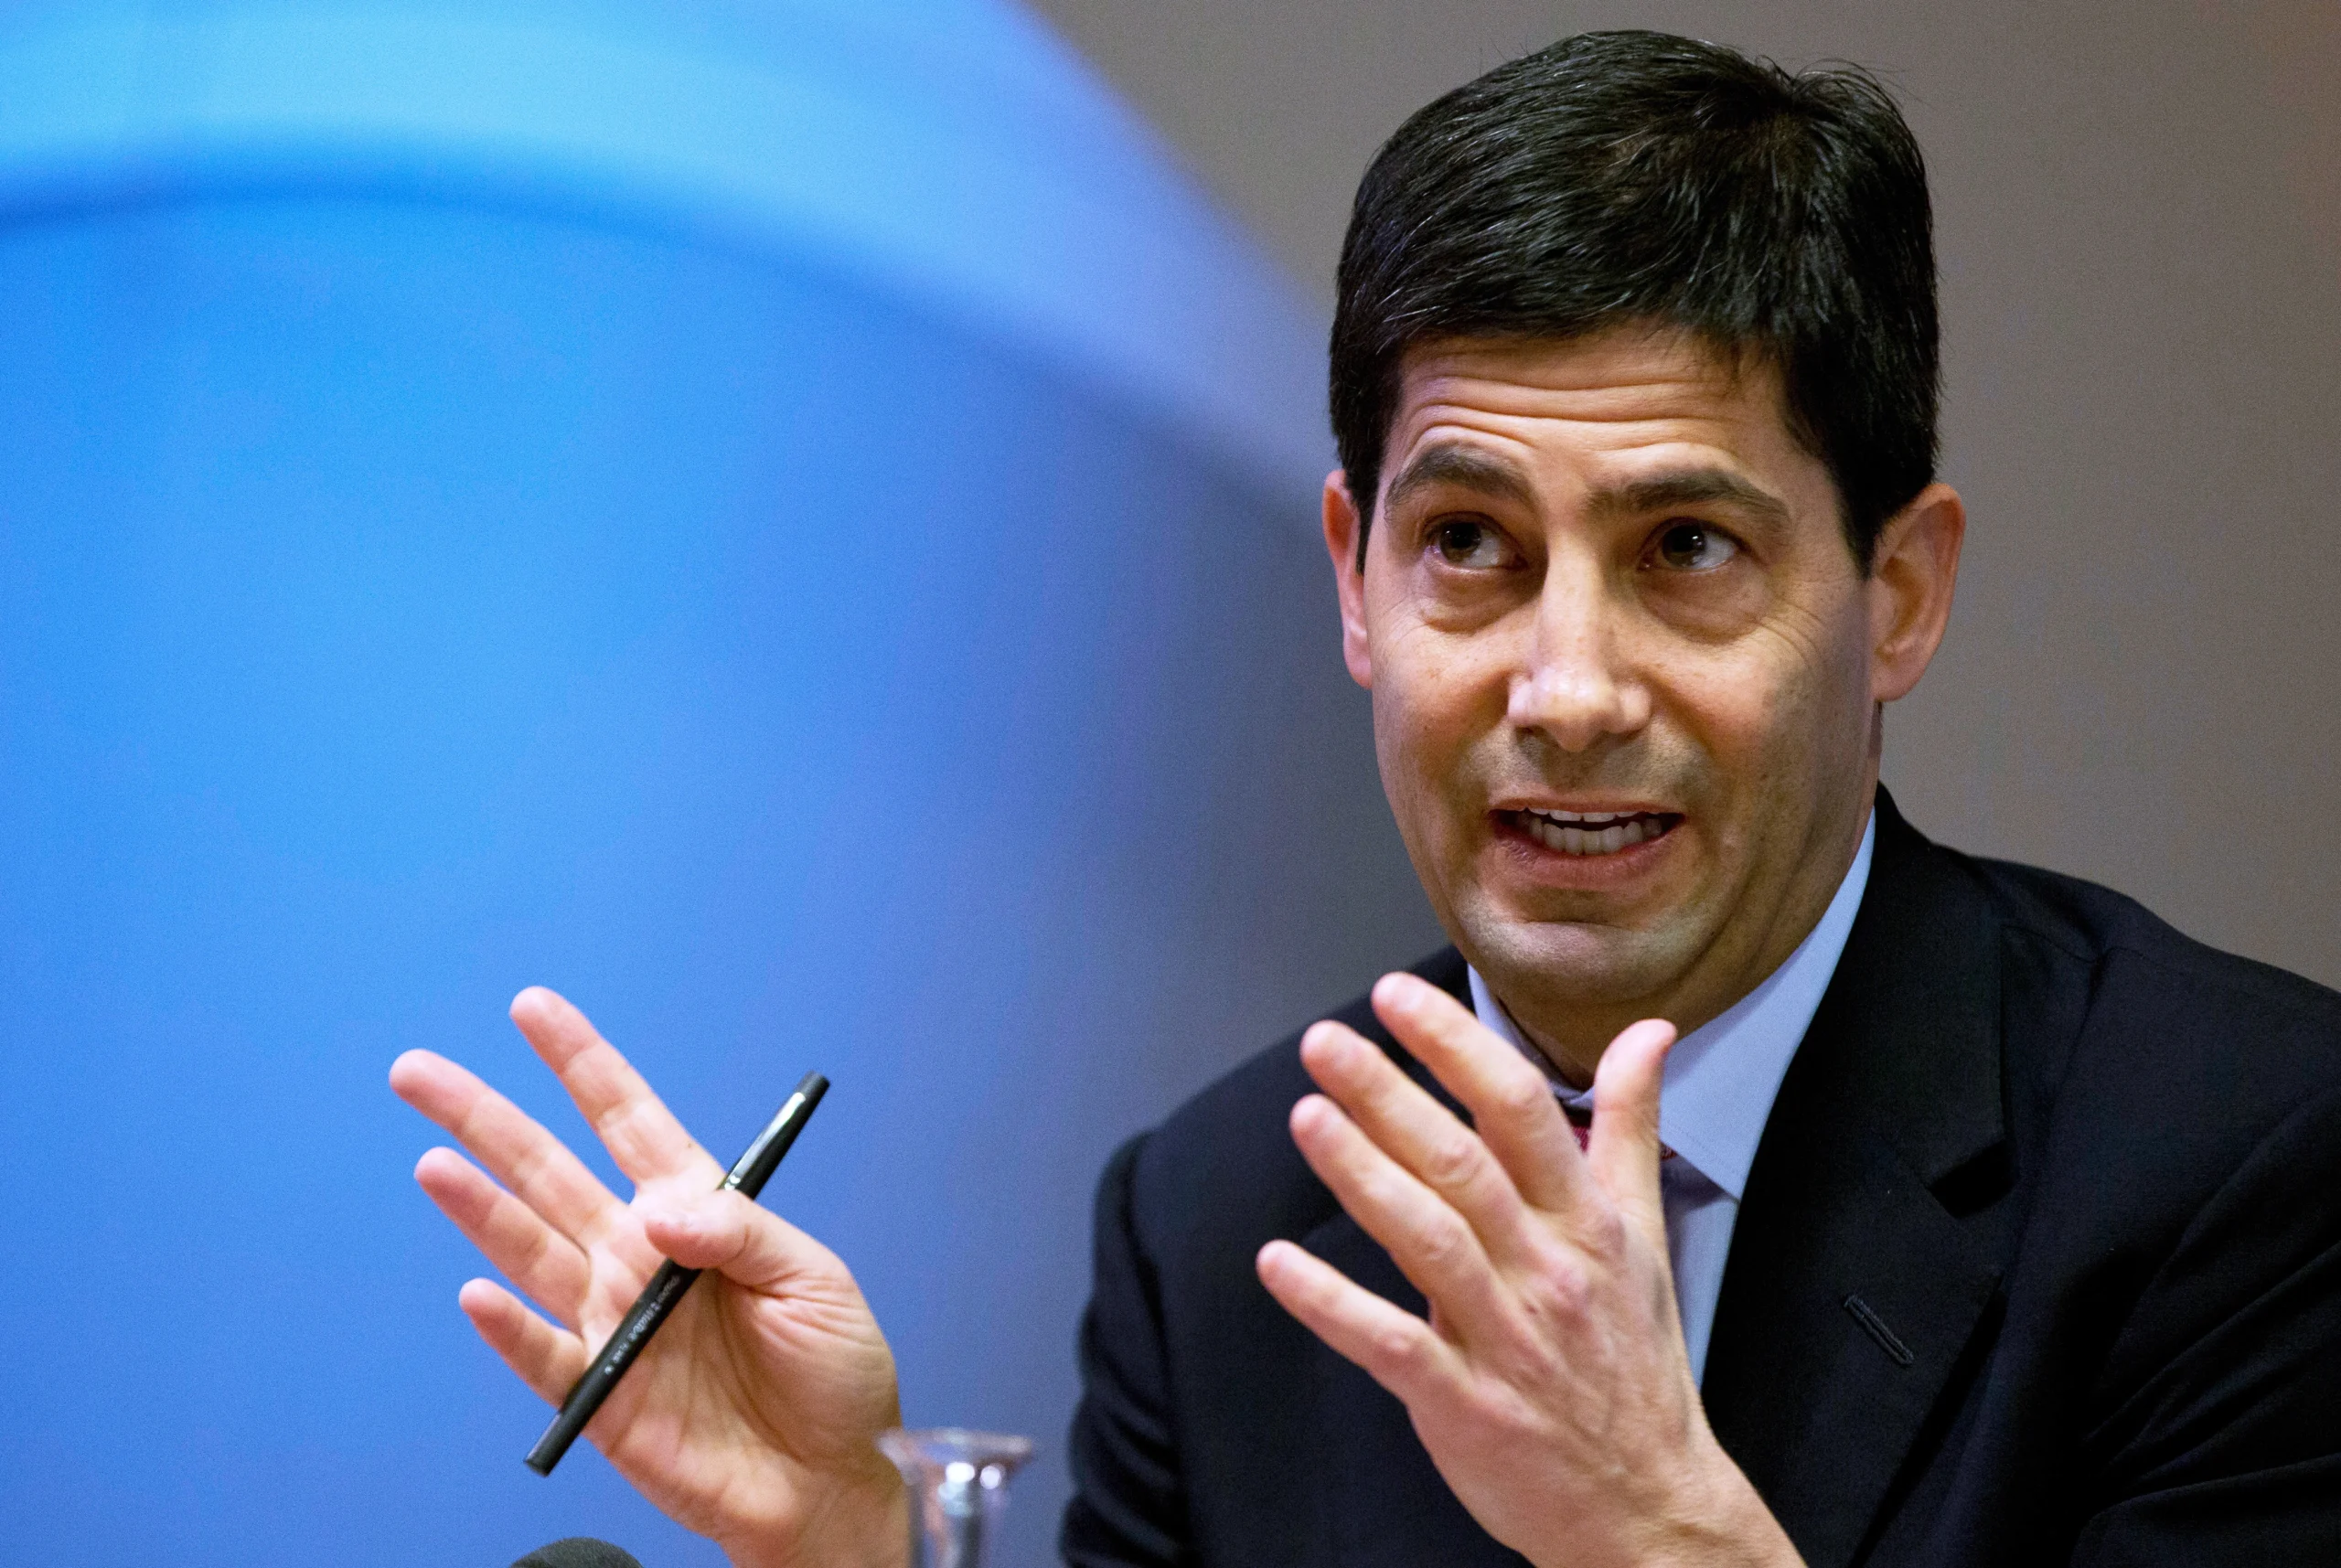
The Federal Reserve’s rate-setting committee held its benchmark borrowing rate steady on July 29, keeping it in a range of 3.5% to 3.75% — but the calm on the surface masked one of the most contested votes of the post-pandemic era. The Federal Open Market Committee split 9 to 3, with three members pushing to raise rates rather than hold, according to NPR’s coverage of the decision.
Chair Kevin Warsh, who took over the Eccles Building earlier this year after a nomination process that rattled bond markets, used his post-meeting press conference to make a point of not making a point. Rather than signal where rates are headed next, Warsh told reporters the Fed would judge market reaction “direct and unfiltered” instead of offering the rolling forecasts investors have come to expect, a stance detailed in CNBC’s meeting recap.
A rate hike was genuinely on the table
What made this meeting unusual wasn’t just the dissent — it was how close markets came to pricing in a hike rather than a cut. Fed funds futures tracked by CME Group put the odds of a rate increase at roughly 35% heading into the decision, up sharply from 26% a week earlier, according to CNBC’s markets analysis. That is a striking reversal from the rate-cutting cycle many investors had expected when Warsh’s nomination was first floated as a “productivity-led growth” pivot away from his predecessor’s caution.
The market reaction told its own story. The S&P 500 slid roughly 0.6% during Warsh’s press conference, the Dow shed more than 840 points intraday, and the 10-year Treasury yield rose to 4.657%, even as the Fed opted for a hold rather than a hike.
Why Warsh is playing it differently
Warsh’s approach reflects both economic and political calculus. Treasury yields have climbed since the Fed’s prior meeting despite the hold, a dynamic Warsh acknowledged directly. And unlike his predecessor, Warsh has been explicit that he intends to set policy independent of the White House’s preferences — even as he awaits a possible additional ally on the Board once a pending internal review concludes, according to CNBC’s analysis of the political backdrop.
Why this matters beyond Washington
A genuinely undecided Fed has knock-on effects well past US borrowers. Higher-for-longer Treasury yields pull global capital toward dollar assets, complicating rate paths in London, Ottawa, and emerging markets alike — a dynamic playing out in parallel with the UK’s own fiscal squeeze (see our companion report on the Autumn Budget) and China’s deflationary drag on global demand. For businesses and investors across the Gulf, Southeast Asia, and South Asia weighing dollar-denominated debt or dollar-pegged currencies, an unpredictable Fed chair is arguably a bigger variable than the rate level itself.
Discover more from The Economy
Subscribe to get the latest posts sent to your email.
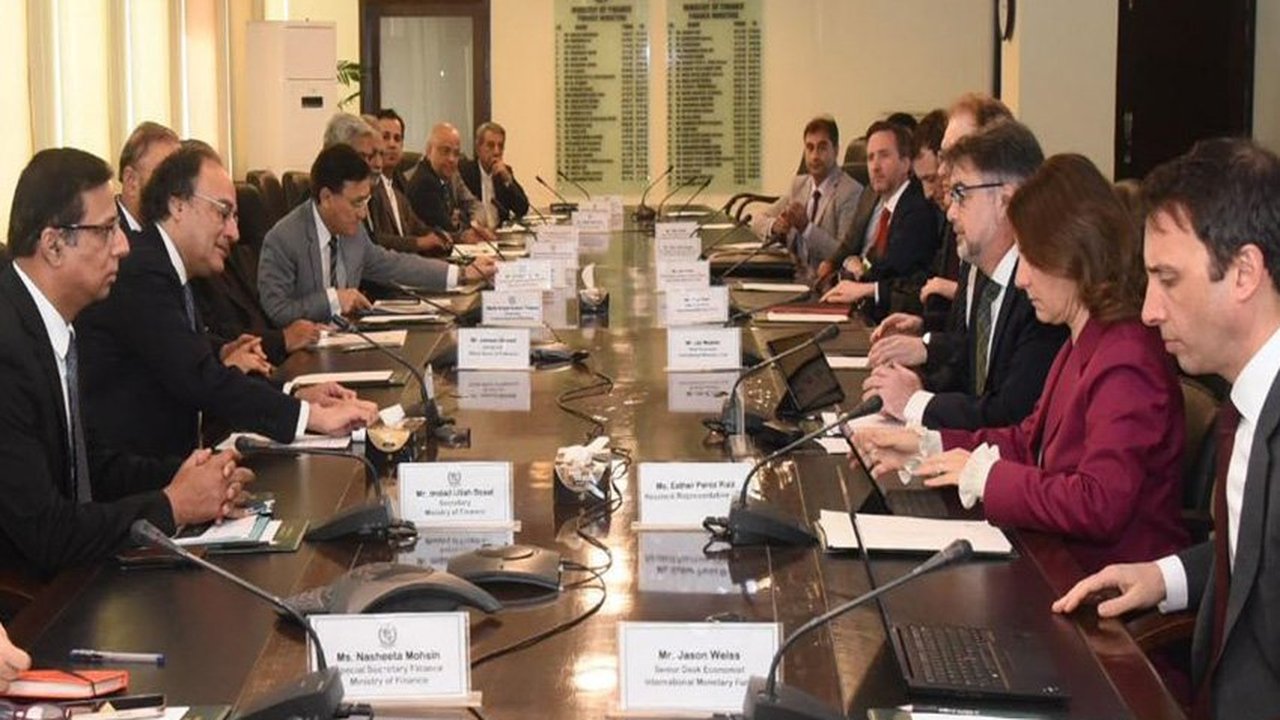
The IMF’s Executive Board completed Pakistan’s third review of its 37-month Extended Fund Facility (EFF) and second review of its Resilience and Sustainability Facility (RSF) on May 8, 2026, unlocking roughly $1.1 billion under the EFF and $220 million under the RSF, according to the IMF’s official statement. Total disbursements under both arrangements now stand at roughly $4.8 billion. Acting Chair Nigel Clarke credited Pakistan’s “strong program implementation” for supporting macroeconomic recovery and building resilience to shocks.
The Genuinely Good Numbers
By the IMF’s own account, the underlying data supports the assessment. GDP growth accelerated to an average of 3.8% year-on-year in the first half of FY26, driven by the auto, construction and garment industries, even accounting for flood disruption in July-August, according to the IMF’s staff report. Inflation, while ticking up to 7.3% year-on-year in March as commodity price pass-through hit domestic energy prices, remained within a broadly contained range, with core inflation at 7.6%. The current account was described as broadly balanced, and reserve rebuilding exceeded earlier projections — the State Bank of Pakistan projects reserves continuing to climb to roughly $18 billion by June 2026, according to analysis from the Islamabad Policy Research Institute.
The State Bank confirmed receipt of $1.3 billion from the IMF on May 12, 2026, according to CSS Prep’s policy analysis, which notes reserves had fallen to dangerously low levels in 2022-2023 before this recovery.
The External Risk the IMF Flagged Explicitly
The Fund’s own report is notably candid about downside exposure: under its April 2026 World Economic Outlook adverse scenario, the cumulative hit to Pakistan’s GDP from continued Middle East conflict could rise to around 1.5 percentage points by FY27, with inflation and the current account deficit each worsening by roughly 1.5-2.5 percentage points of GDP, according to the IMF’s staff country report. Given Pakistan’s reliance on imported energy, oil price volatility discussed in the IMF’s global outlook feeds directly into this specific country risk.
The Reform Question That Keeps Recurring
The structural policy conditions attached to this review read as familiar territory: sustaining fiscal consolidation, broadening the tax base, maintaining tight monetary policy to keep inflation within the State Bank’s target range, and advancing energy-sector reform — commitments the IMF’s own end-of-mission statement described as still “ongoing” rather than complete, per the IMF’s March 2026 mission statement.
A sharper framing comes from Pakistani policy analysts themselves: reforms that would genuinely break the IMF-program cycle — broadening the tax base to include agriculture and retail, ending energy subsidies, privatizing loss-making state-owned enterprises — impose concentrated, visible costs on politically organized interest groups, while the benefits of reversing those costs are diffuse and delayed, according to CSS Prep’s analysis. That political-economy imbalance, the analysis argues, consistently favors populist continuation of stabilization support over the structural reform that would end the need for it — a pattern this third review’s genuine macroeconomic progress doesn’t yet break.
Social Cost of the Adjustment
Pakistan’s poverty headcount rate rose to 25.3% in FY24, up sharply from 18.3% in FY22, driven by overlapping shocks from COVID, floods and inflation, according to the IMF’s staff report. The Benazir Income Support Programme (BISP) remains the primary social protection mechanism absorbing the distributional cost of IMF-mandated energy price increases and fiscal tightening — whether its scale is adequate remains, in the IMF’s own words, a live policy question rather than a settled one.
Discover more from The Economy
Subscribe to get the latest posts sent to your email.
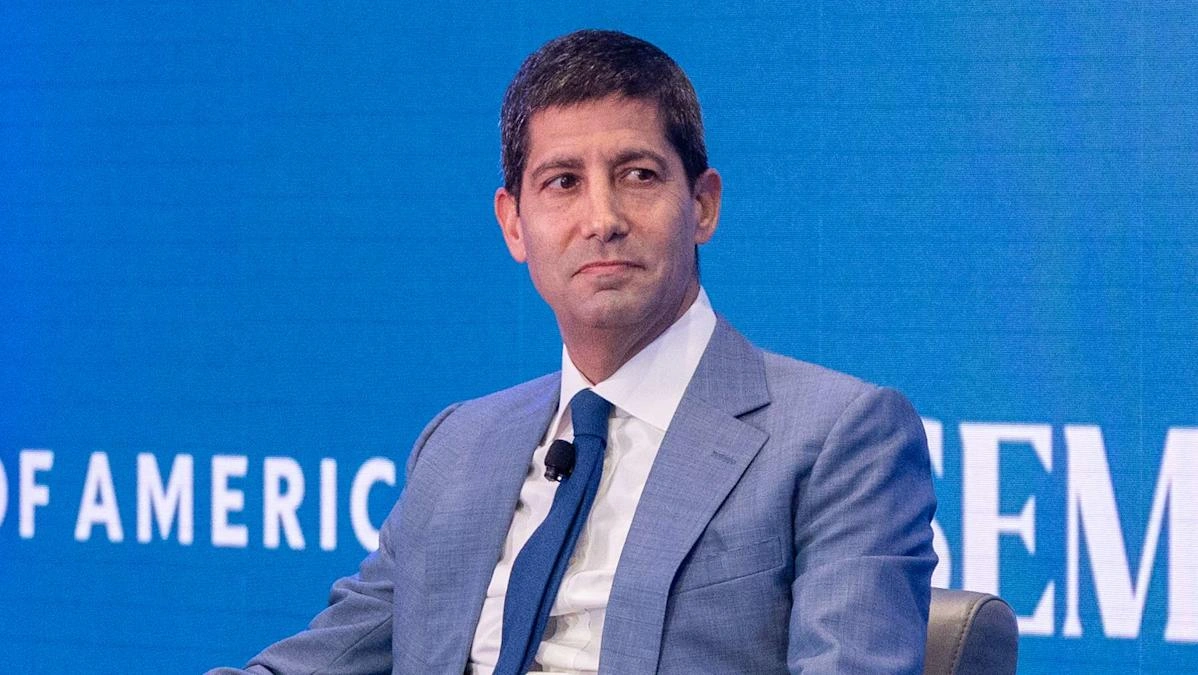
The Federal Reserve held its benchmark interest rate steady at 3.5%-3.75% on July 29, 2026, but the more consequential detail was the vote itself: 9-3, with three regional Federal Reserve Bank presidents — Cleveland’s Beth Hammack, Minneapolis’s Neel Kashkari, and Dallas’s Lorie Logan — dissenting in favor of a rate hike, according to CNBC’s coverage of the meeting. Inflation has remained above the Fed’s 2% target for more than five years, the underlying tension driving the split.
A New Chair, A Different Communication Style
The decision was the latest under Fed Chair Kevin Warsh, who took over after Jerome Powell’s term expired on May 15, 2026, according to iShares’ 2026 Fed outlook. Warsh has deliberately shortened the Fed’s post-meeting statements and pulled back on the kind of explicit forward guidance markets had grown accustomed to under his predecessors — he has reportedly dedicated one of five internal task forces specifically to rethinking how the Fed communicates, according to CNBC’s reporting. Warsh has publicly called inflation “a choice,” repeatedly emphasizing the importance of getting prices under control in recent congressional testimony.
At his post-meeting press conference, Warsh pushed back on characterizing the decision as a “pause,” instead describing it as “a rigorous review of the economic situation” and “a view of what our own homework is to try to resolve those questions in the period ahead,” according to a separate CNBC recap. Warsh has reportedly used the phrase “family fight” 13 times across five public appearances to acknowledge the committee’s internal divisions — an unusually candid framing for a sitting Fed Chair.
Why the Split Exists
Governor Christopher Waller has separately voiced concern that higher rates could become necessary without more inflation progress, even though he voted for the hold at this meeting. The full committee’s June projections penciled in one quarter-point increase by the end of 2026 — a notable shift from the rate-cutting path markets had priced in earlier in the year, according to the Fed’s own June 2026 Summary of Economic Projections, which explicitly flags that the federal funds rate outlook “is subject to considerable uncertainty” given how sensitive each participant’s view is to how inflation and employment data evolve from here.
Complicating Factors
Renewed U.S.-Iran tensions have already pushed mortgage rates near a one-year high independent of the Fed’s own decisions, since longer-term rates track Treasury yields and inflation expectations rather than the Fed funds rate directly, according to CNBC’s analysis. Separately, iShares had earlier projected that once a new Chair was confirmed, the Fed might seek one or two rate cuts to bring rates closer to a 3%-3.25% range — a path the July hold and hawkish dissents now put in serious doubt.
The next FOMC meeting is scheduled for September 15-16, 2026, and will include a fresh Summary of Economic Projections, according to Forbes’ Fed tracker — the next real test of whether Warsh’s committee can narrow its internal divide or whether the “family fight” framing becomes the defining feature of Fed policy through the rest of 2026.
Discover more from The Economy
Subscribe to get the latest posts sent to your email.

Rachel Reeves’s £25 Billion Problem: What the Autumn Budget Gap Means for Britain

Inside the Fed’s Most Divided Vote in Years: Why Warsh Held the Line on Rates

Pakistan Passed Its Third IMF Review

The Fed Is Fractured — And a New Chair Just Made It Louder, Not Quieter

The UK Economy in 2026 Is Neither Recession Nor Recovery :Stagflaton

Indonesia’s $121 Billion Nickel Bet Is Facing a Battery Chemistry

Why Ultra-Wealthy Families Are Splitting Between Singapore and Dubai inmarkets 2026

China Chose Political Control Over Fixing Its Deflation Trap in 2026

Oil Markets Are Oversupplied and Geopolitically Explosive at the Same Time

Russia’s Budget Deficit Blew Past Its Full-Year Target in Three Months

Malaysia’s Rare Earth Bet: Six Powers Are Negotiating for Kuantan at Once

Gulf Sovereign Capital Bypasses Pakistan Despite Record 2026 Spending Spree

Pakistan’s $10bn US Facility Request: Inside the New Gulf Capital Triangle

China Criticizes US Bill Targeting Russian Oil Buyers — Why It Matters

AI Bubble Warning 2026: Why BIS, IMF and Bank of England Fear a Market Crash

Russia Bans Diesel Exports 2026: Global Fuel Market Impact Explained

Gold Price Forecast 2026: Fed’s July 29 Decision and Record Central Bank Buying Explained

Strait of Hormuz Blockade 2026: Oil Prices Surge 9% as US-Iran Conflict Reignites

Strait of Hormuz 2026: Why Markets Still Don’t Trust It’s Open

Down But Not Out: Inside the Slow Sinking of Russia’s War Economy

Gulf Capital Retreat From Pakistan 2026: UAE Loan Freeze & What It Means

China Politburo July 2026: Stimulus Signals Explained

Pakistan IMF Deal 2026: Third Review Cleared, Budget 2026-27 and Inflation Outlook

Pakistan Economy 2026: GDP Grows 3.7% as IMF Completes EFF Review Amid Middle East Risk

Apple vs OpenAI Lawsuit: The Economic Story Behind the Headline

Global Stock Market Selloff 2026: Stagflation Fears Return as Iran Conflict Reignites

The Yuan Now Settles 67% of Russian Oil Payments — Quiet De-Dollarization in Action

Indonesia Russian Oil Imports 2026: Why Jakarta Is Diversifying Crude Supply
-

 Markets & Finance7 months ago
Top 15 Stocks for Investment in 2026 in PSX: Your Complete Guide to Pakistan’s Best Investment Opportunities
-

 Analysis5 months ago
Johor’s Investment Boom: The Hidden Costs Behind Malaysia’s Most Ambitious Economic Surge
-

 Analysis6 months ago
Top 10 Stocks for Investment in PSX for Quick Returns in 2026
-

 Analysis6 months ago
Brazil’s Rare Earth Race: US, EU, and China Compete for Critical Minerals as Tensions Rise
-

 Banks7 months ago
Best Investments in Pakistan 2026: Top 10 Low-Price Shares and Long-Term Picks for the PSX
-

 Investment7 months ago
Top 10 Mutual Fund Managers in Pakistan for Investment in 2026: A Comprehensive Guide for Optimal Returns
-

 Global Economy7 months ago
15 Most Lucrative Sectors for Investment in Pakistan: A 2025 Data-Driven Analysis
-

 Global Economy7 months ago
Pakistan’s Export Goldmine: 10 Game-Changing Markets Where Pakistani Businesses Are Winning Big in 2025