
Terms & Definitions
Supply vs Demand Shocks Explained: Market Equilibrium, Inflation Risks & Policy Responses in 2026

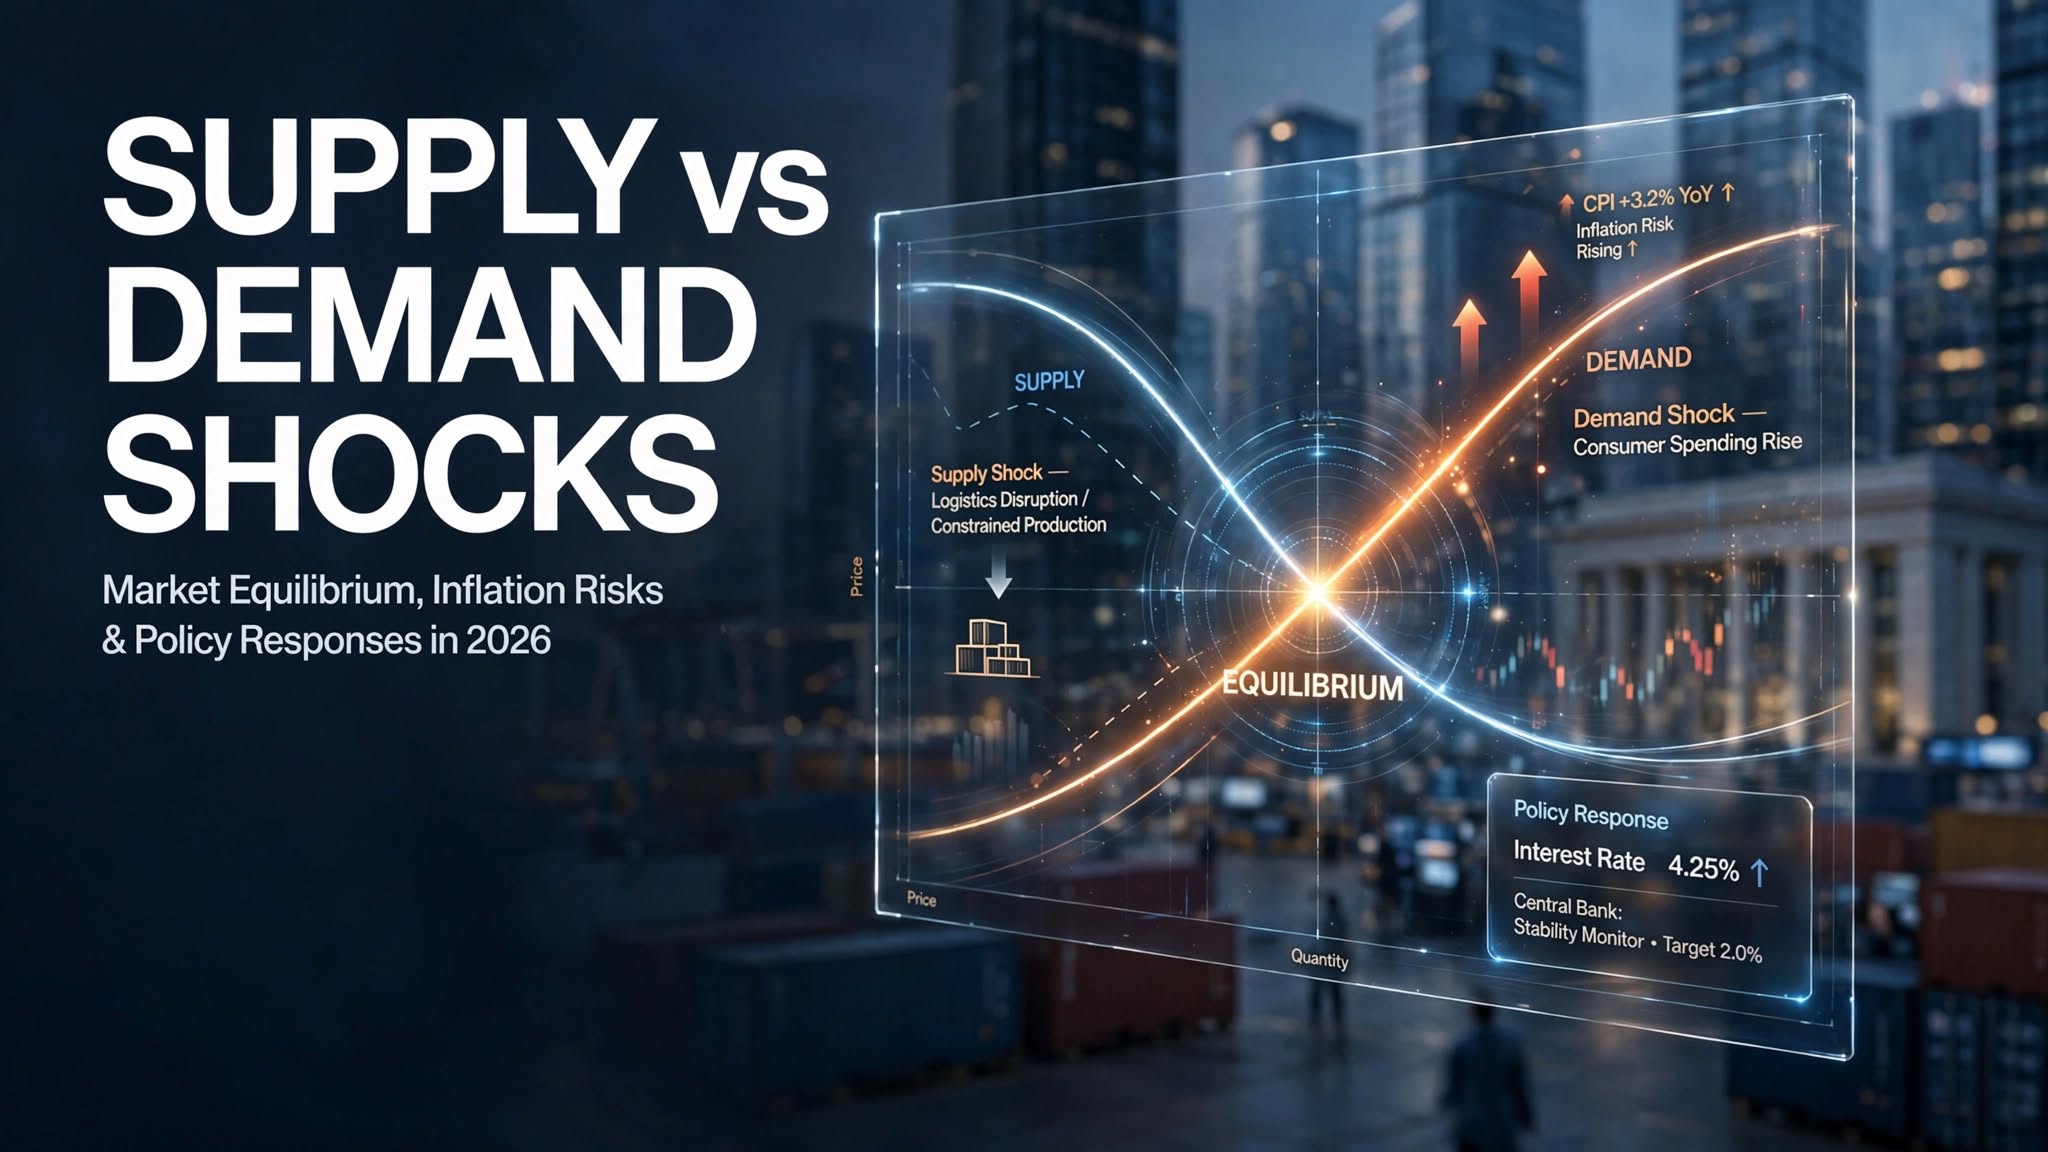
Understanding Sudden Disruptions in Market Equilibrium
In a stable market economy, prices and production quantities are constantly balanced by the forces of supply and demand. However, unexpected, high-impact events can violently disrupt this equilibrium. Economists classify these disruptions as Supply Shocks and Demand Shocks.
For financial analysts and readers of Economy.com.pk, identifying the nature of a sudden economic shock is the single most critical step in predicting how central banks and financial markets will react.
Supply Shocks: Disruptions in Production
A Supply Shock is an unexpected event that suddenly alters the production capacity of an economy, shifting the aggregate supply curve and causing an abrupt change in the prices of goods and services.
- Negative Supply Shock (Adverse): This is the most common and damaging type of shock. It occurs when production is suddenly restricted or made drastically more expensive. Classic examples include geopolitical wars cutting off crude oil supplies, natural disasters destroying agricultural belts, or pandemics shutting down global maritime shipping lanes. A negative supply shock causes prices to skyrocket (cost-push inflation) while output and employment plummet, often breeding stagflation.
- Positive Supply Shock: This occurs when productivity leaps forward unexpectedly. Examples include technological breakthroughs (such as artificial intelligence automation or widespread adoption of high-yield genetically modified crops) or a sudden collapse in global oil prices. A positive supply shock lowers production costs, increases output, and drives prices down, fostering non-inflationary economic growth.
Demand Shocks: Sudden Shifts in Consumer Appetite
A Demand Shock is an unexpected event that triggers a massive, sudden surge or collapse in consumer and business spending, shifting the aggregate demand curve across the economy.
- Negative Demand Shock (Adverse): This occurs when consumers and businesses suddenly lose confidence, hoard cash, and slash spending. Classic examples include financial panics (like the 2008 global banking collapse) or sudden lockdowns during a public health crisis. A negative demand shock causes widespread business failures, soaring unemployment, and tumbling prices (deflation).
- Positive Demand Shock: This happens when consumer or government spending surges unexpectedly, often fueled by massive fiscal stimulus packages, tax cuts, or sudden booms in consumer credit. While a positive demand shock creates jobs and stimulates short-term GDP growth, an unchecked surge in demand that outpaces production capacity leads straight to runaway demand-pull inflation.
The Policy Dilemma: Diagnosing the Shock
When an economic crisis hits, central banks and finance ministries must immediately diagnose whether the shock originated from the supply side or the demand side:
- If inflation is driven by a negative demand shock (unlikely) or normal overheating, central banks raise interest rates to suppress spending.
- If inflation is driven by a negative supply shock (e.g., an oil embargo), raising interest rates does nothing to physically produce more oil or fix broken supply chains; it only compounds the misery by strangling domestic businesses.
For editors at economist.media, dissecting the root cause of market shocks provides readers with the clarity needed to navigate turbulent financial markets.
Key Takeaways:
- Shocks are sudden, unexpected events that disrupt market equilibrium and price stability.
- Supply shocks alter production costs and capacities, while demand shocks alter consumer and business spending appetites.
- Negative supply shocks are particularly dangerous because they cause simultaneous inflation and economic stagnation.
- Central banks must carefully identify the origin of a shock to deploy the correct monetary response.
Authoritative Sources & Further Reading:
- Brookings Institution: Economic Shocks, Recovery, and Fiscal Research
- Federal Reserve Bank of St. Louis (FRED): Supply and Demand Shock Analysis
Discover more from The Economy
Subscribe to get the latest posts sent to your email.


International Trade
Tax-to-GDP Ratio Explained: Global Benchmarks, Fiscal Sovereignty & 2026 Insights
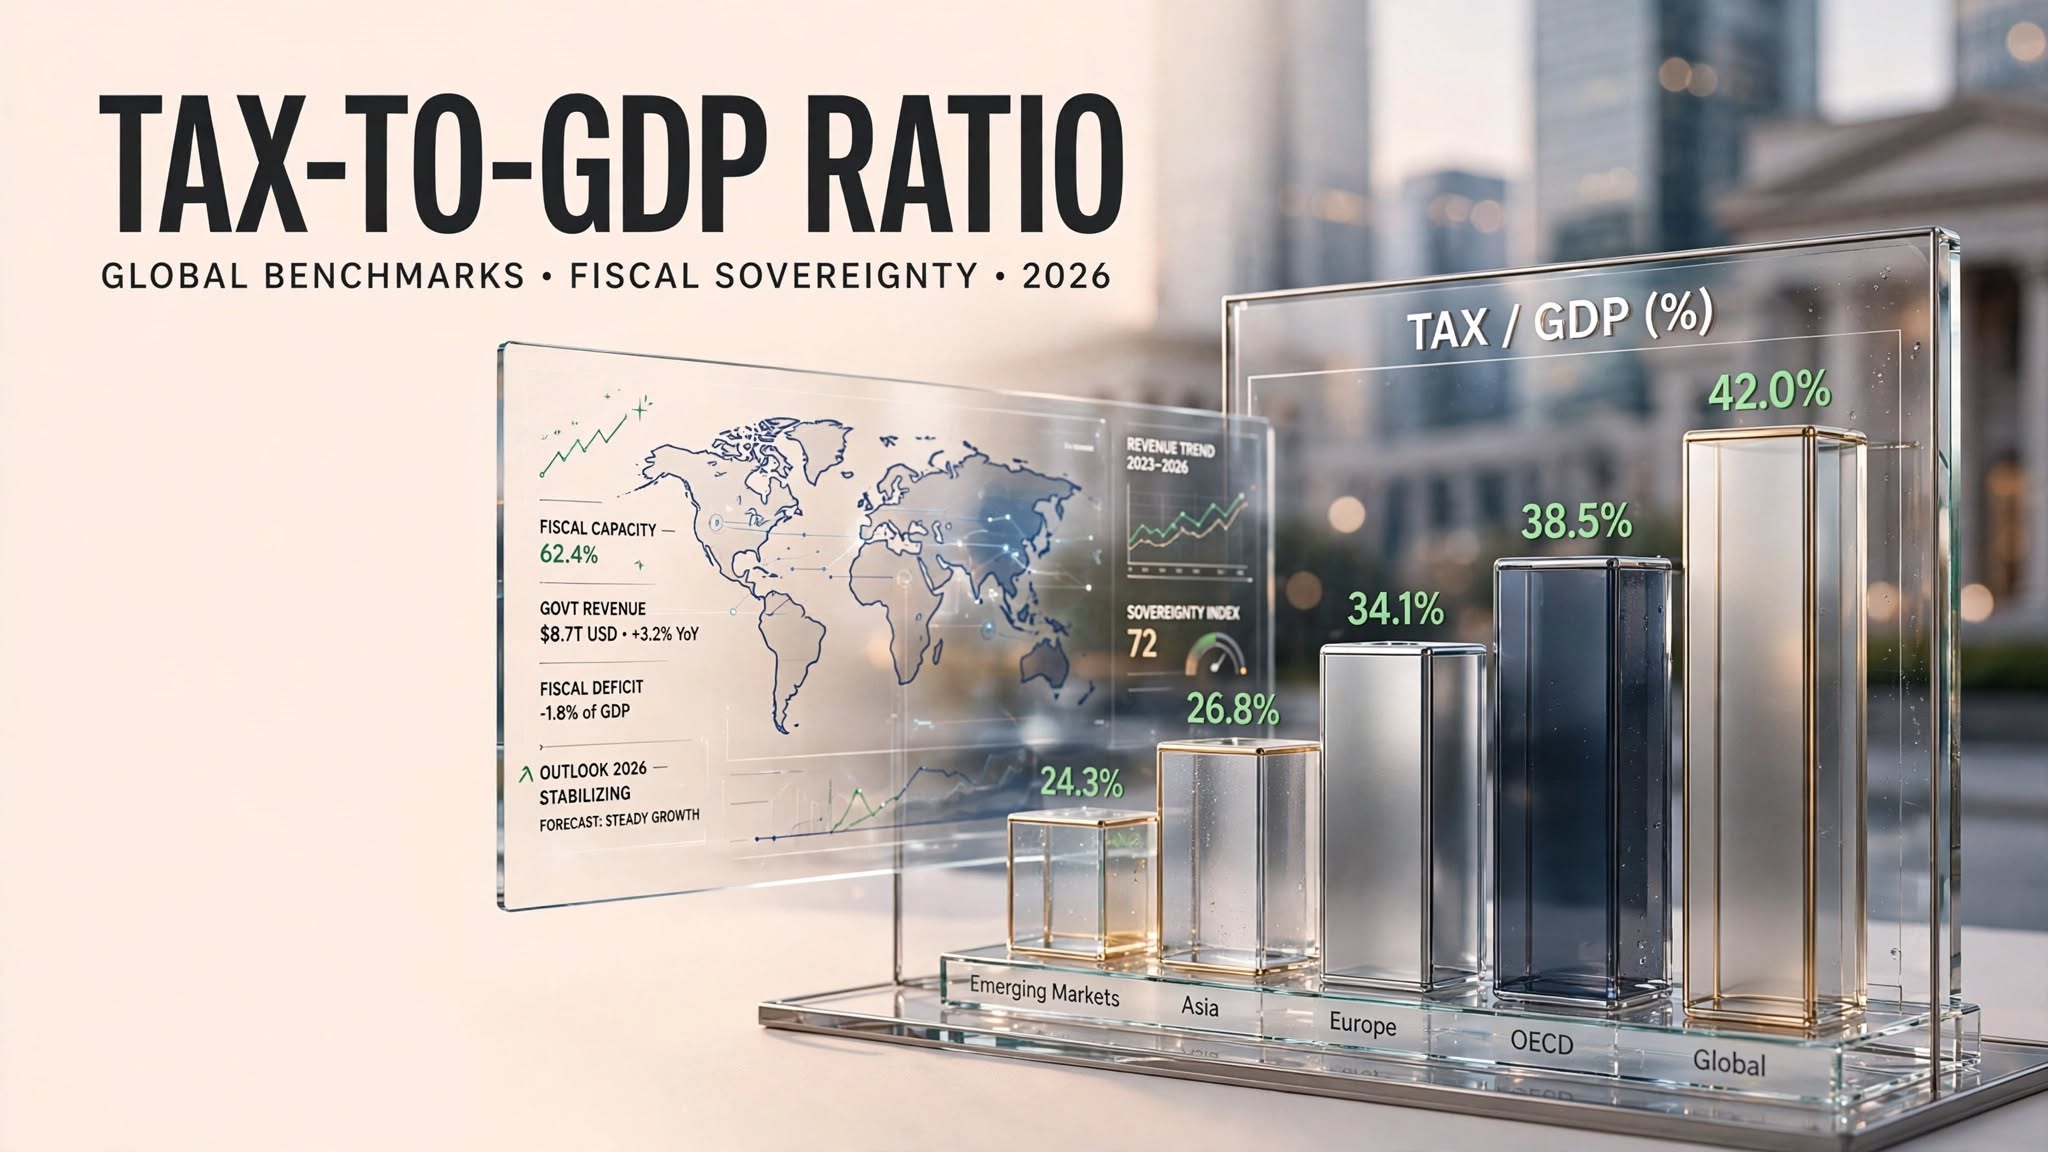
Measuring Government Revenue Efficiency and Fiscal Sovereignty
The Tax-to-GDP Ratio is a critical macroeconomic metric that compares total government tax revenue collection against the country’s Gross Domestic Product (GDP). Expressed as a percentage, it serves as the ultimate benchmark of a government’s fiscal capacity, revenue administration efficiency, and economic formalization.
For readers of economist.media and Thefinance.pk, tracking the tax-to-GDP ratio provides immediate insight into whether a government can fund its public infrastructure and debt obligations sustainably, or whether it is trapped in a perpetual cycle of fiscal deficits and external borrowing.
Why the Tax-to-GDP Ratio Matters
A healthy tax-to-GDP ratio is the cornerstone of economic sovereignty. It dictates how a government finances its public goods and services:
- Funding Public Infrastructure and Social Safety Nets: Developed nations (particularly Scandinavian and Western European economies) often boast tax-to-GDP ratios ranging from 30% to 45%. This high revenue collection allows them to build world-class public transport systems, fund universal healthcare, maintain robust public education networks, and provide social safety nets for vulnerable populations.
- Escaping the Debt Trap: When a developing nation struggles with a low tax-to-GDP ratio (often hovering between 9% and 12%), the government collects insufficient revenue to cover its day-to-day expenditures and interest payments. To bridge the gap, it must borrow heavily from domestic commercial banks or international lenders, driving up public debt and crowding out private sector investment.
The Informal Economy Trap
Why do some developing economies suffer from chronically low tax-to-GDP ratios despite high statutory tax rates? The answer lies in the informal economy (cash-based retail, undocumented labor, and unregistered small businesses).
When a massive percentage of economic activity operates off the books in cash, the tax net fails to capture it. Governments often respond by raising tax rates on the small, formal corporate sector and salaried workers already trapped in the tax net. This creates a vicious cycle: high tax rates on compliant businesses encourage more firms to slip into the informal economy, further shrinking the tax base and depressing the tax-to-GDP ratio.
Structural Tax Reform
To improve the tax-to-GDP ratio sustainably, governments must avoid harsh, regressive indirect taxes (like high flat sales taxes that disproportionately crush poor households) and instead focus on structural fiscal reforms:
- Expanding the Digital Tax Net: Integrating point-of-sale (POS) tracking systems, digitizing financial transactions, and leveraging data analytics to track high-net-worth individuals who evade income tax.
- Streamlining Exemptions: Eliminating massive corporate tax loopholes and exemptions that drain billions in potential state revenue.
- Broadening Direct Taxation: Shifting the burden toward progressive direct taxation, ensuring that wealth, high property values, and capital gains are taxed equitably.
For financial analysts, a rising tax-to-GDP ratio is a powerful signal of structural reform success, indicating that a government is moving toward fiscal self-reliance and macroeconomic stability.
Key Takeaways:
- The Tax-to-GDP ratio measures total government tax collection relative to the total size of the economy.
- Developed nations maintain high ratios (30-45%), enabling robust public infrastructure and social welfare programs.
- Low ratios in developing economies force reliance on deficit financing, heavy domestic borrowing, and external debt.
- Expanding the formal economy and capturing undocumented cash transactions are essential to raising the tax-to-GDP ratio sustainably.
Authoritative Sources & Further Reading:
- Organisation for Economic Co-operation and Development (OECD): Global Revenue Statistics and Tax-to-GDP Ratios
- World Bank: Government Revenue and Fiscal Policy Analytics
Discover more from The Economy
Subscribe to get the latest posts sent to your email.
Global Trade
Trade Deficit & Terms of Trade Explained: Global Impact, Real-World Examples, and 2026 Insights
Navigating the Complexities of International Commerce and Value Exchange
International trade is the lifeblood of modern globalization. Within this vast ecosystem, two metrics stand out as vital indicators of a nation’s trading health: the Trade Deficit and the Terms of Trade (TOT).
For platforms like Thefinance.pk and Economy.com.pk, examining these metrics reveals whether a country is building sustainable wealth through global trade or slowly eroding its foreign exchange reserves through unfavorable commerce.
Trade Deficit: When Imports Outpace Exports
A Trade Deficit (specifically a merchandise trade deficit) occurs when the total monetary value of physical goods a country imports from abroad exceeds the total value of the goods it exports over a given period.
- The Nuance of Deficits: A trade deficit is not inherently catastrophic. If a developing nation runs a trade deficit because it is importing heavy industrial machinery, raw steel, and advanced technology required to build domestic manufacturing plants, the deficit represents productive investment in future export capacity.
- The Danger of Consumption Deficits: Conversely, if a trade deficit is driven by a nation gorging on imported luxury vehicles, consumer electronics, and foreign food items while exporting very little, it represents an unsustainable drain on national wealth and foreign exchange reserves. Chronic consumption-driven trade deficits frequently culminate in balance of payments crises.
Terms of Trade (TOT): The Exchange Ratio of Exports to Imports
While the trade deficit measures the volume and value gap, the Terms of Trade (TOT) measures the relative price ratio of a country’s exports to its imports. It is calculated using the following formula:
$$\text{Terms of Trade} = \left( \frac{\text{Index of Export Prices}}{\text{Index of Import Prices}} \right) \times 100$$
- Improving Terms of Trade: If a country’s TOT index rises above 100 (or increases over time), it means the prices of the goods it exports are rising faster than the prices of the goods it imports. For every unit of exports it sells, the country can now buy more imports. This signals a strengthening economic position and rising national income.
- Deteriorating Terms of Trade: If the TOT index drops, the country must export a larger volume of its goods just to buy the exact same amount of imports (such as oil or machinery). This is a common trap for developing nations that export low-value agricultural raw materials while importing high-value manufactured technology and energy.
The Real-World Application
Consider an oil-exporting nation: when global crude oil prices surge, its export prices skyrocket, causing its Terms of Trade to improve dramatically, even if export volumes remain unchanged.
Conversely, an oil-importing developing nation experiences a devastating collapse in its Terms of Trade during an energy crisis; its export earnings remain flat, but its import bill for fuel doubles overnight. This disparity explains why global commodity price fluctuations can instantly devastate an emerging economy’s macroeconomic stability.
Key Takeaways:
- A trade deficit occurs when the value of imported merchandise exceeds export earnings.
- Trade deficits are manageable if funded by capital imports for infrastructure, but dangerous if driven by luxury consumption.
- Terms of Trade measures the ratio of export prices to import prices, determining a nation’s purchasing power on global markets.
- Deteriorating terms of trade force nations to export more physical goods just to pay for essential imports like energy.
Authoritative Sources & Further Reading:
- United Nations Conference on Trade and Development (UNCTAD): Global Trade Statistics
- World Trade Organization (WTO): International Trade Trends and Market Analysis
Discover more from The Economy
Subscribe to get the latest posts sent to your email.
Economics
Microeconomics vs. Macroeconomics Explained: Key Differences, Interdependence & Global Impact
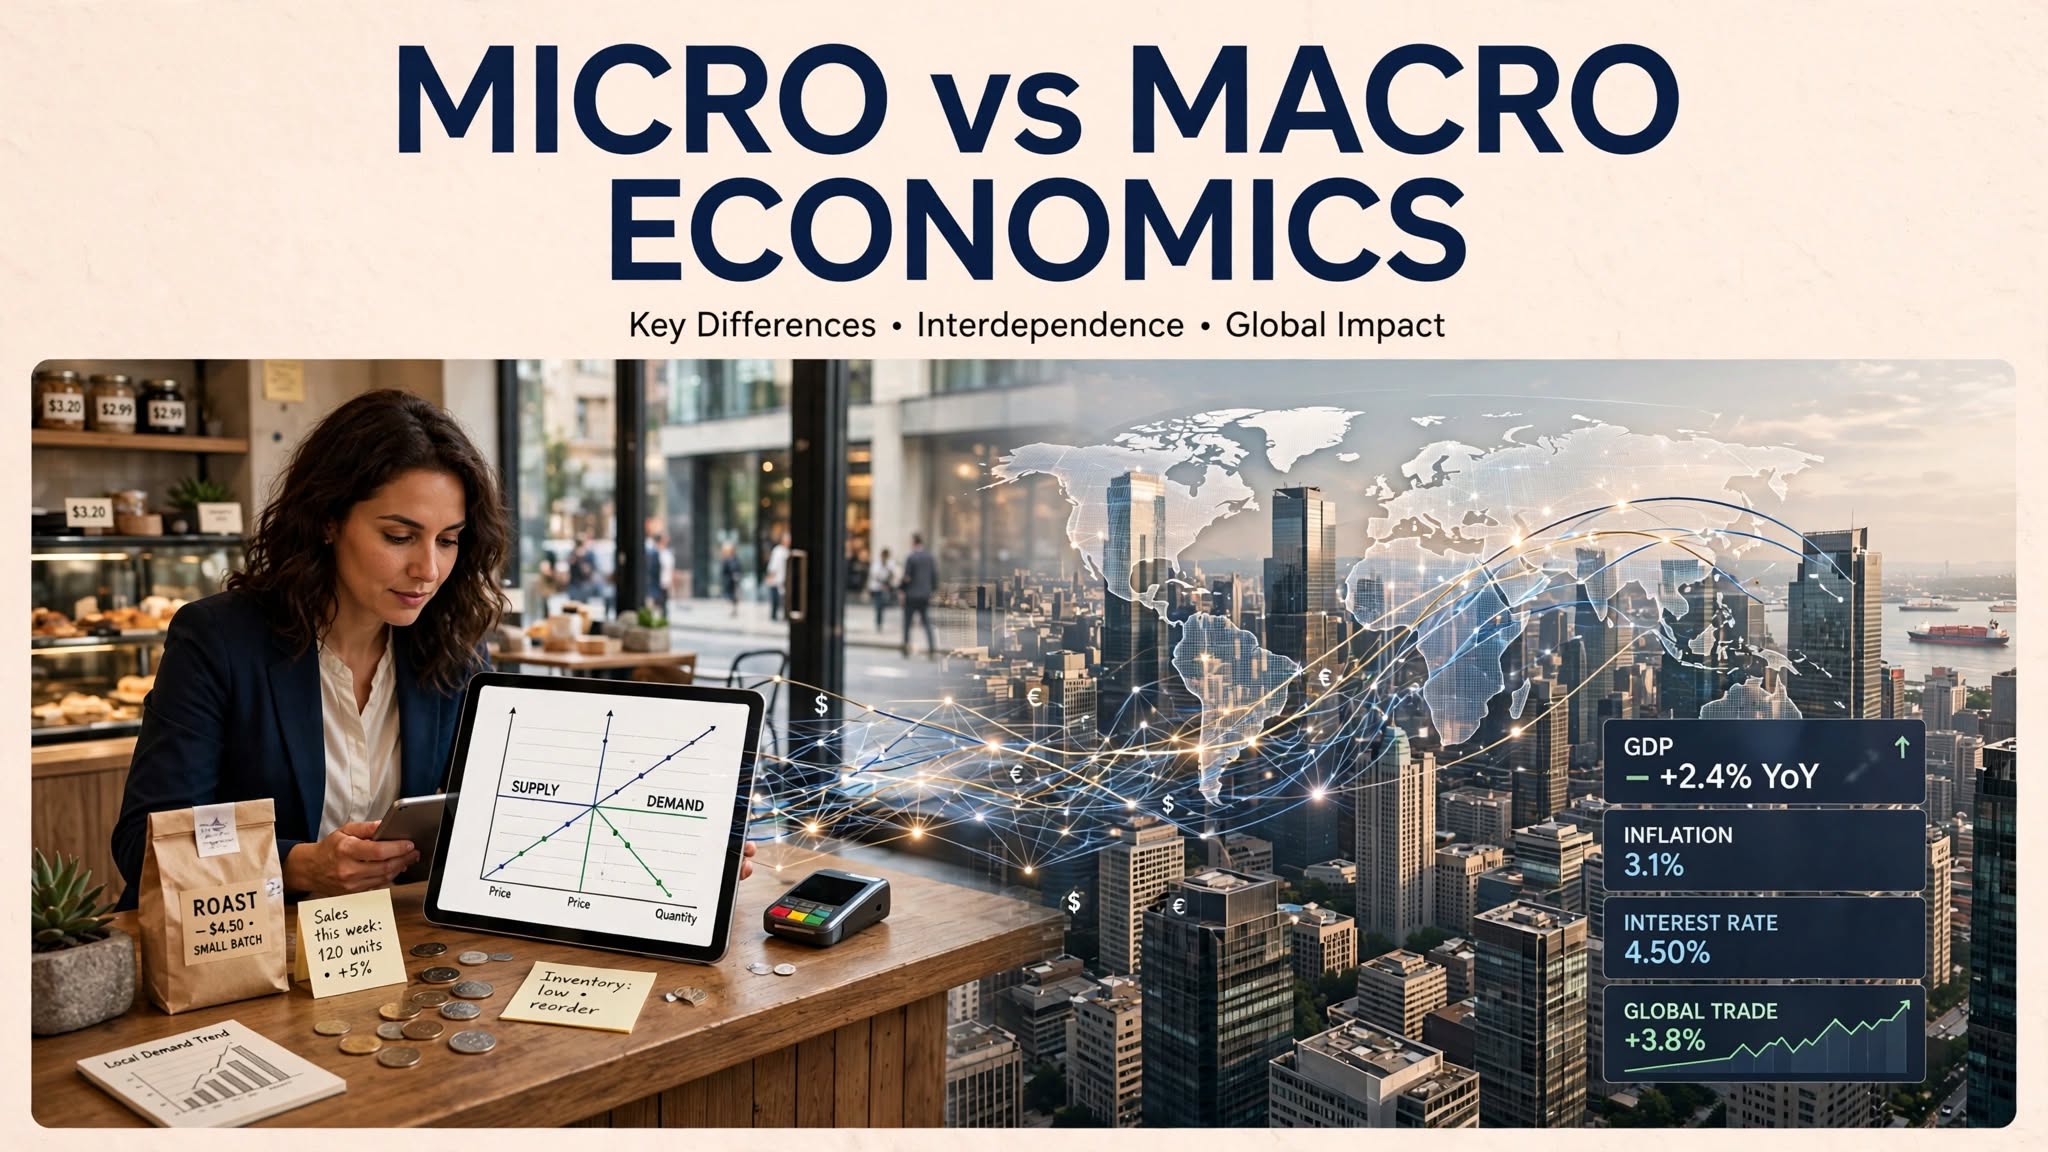
The Dual Lenses of Economic Analysis: From Individual Behavior to Global Markets
The vast and complex discipline of economics is traditionally divided into two distinct yet deeply interconnected branches: Microeconomics and Macroeconomics. To understand how financial systems operate, readers of Thefinance.pk and economist.media must master both perspectives.
While microeconomics zooms in on the microscopic decisions made by individual agents in specific markets, macroeconomics zooms out to analyze the sweeping forces governing entire national economies and global trade networks.
Microeconomics: The Science of Individual Choices
Microeconomics (from the Greek word mikros, meaning “small”) is the study of economic behavior and decision-making by individual consumers, households, and business firms. It examines how scarce resources are allocated among competing uses on a granular level.
Key pillars of microeconomic analysis include:
- Supply and Demand Theory: How the price of a specific good or service is determined in a competitive market based on consumer willingness to buy and producer willingness to sell.
- Consumer Choice Theory: How individuals maximize their personal utility (satisfaction) given limited budgets and varying preferences.
- Theory of the Firm: How businesses decide what products to manufacture, how much labor to hire, what pricing strategies to adopt, and how to minimize production costs to maximize profit margins.
- Market Structures: Analyzing how different levels of competition—ranging from perfect competition and monopolistic competition to oligopolies and monopolies—affect pricing and efficiency.
For a local business owner or corporate strategist, microeconomic principles dictate daily operational decisions, such as setting optimal retail prices or managing supply chain inventories.
Macroeconomics: The Study of the Forest
Macroeconomics (from the Greek word makros, meaning “large”) steps back to examine the economy as an integrated whole. Instead of looking at the price of a single cup of coffee or the wages paid by a single local factory, macroeconomics analyzes economy-wide aggregates and indicators.
Core focus areas of macroeconomics include:
- Gross Domestic Product (GDP): Measuring total national economic output and growth rates.
- Inflation and Price Indexes: Tracking the general price level and the erosion of purchasing power across the entire country.
- Unemployment and Labor Markets: Assessing national job creation, structural unemployment rates, and wage trends.
- Monetary and Fiscal Policy: Studying how central banks manage interest rates and how governments manage taxation and public debt to stabilize business cycles.
Macroeconomic trends create the overarching economic climate within which microeconomic actors must operate. For example, when a central bank raises the macro policy rate, it fundamentally alters the microeconomic borrowing costs for every individual household and startup business in the country.
The Interdependence of Micro and Macro
Though studied separately, micro and macroeconomics are deeply intertwined. Modern economic theory emphasizes microfoundations—the idea that macroeconomic models must be built upon a solid understanding of individual microeconomic behavior.
When consumers panic during a high-inflation environment (a macro event), they alter their individual shopping habits and demand higher wages (micro actions). Conversely, millions of individual business decisions to freeze hiring or expand factories collectively shape the national GDP growth rate.
Key Takeaways:
- Microeconomics focuses on individual consumer and corporate behavior, pricing, and market structures.
- Macroeconomics analyzes economy-wide aggregates, including GDP, inflation, unemployment, and monetary policy.
- Both disciplines are interdependent, with macroeconomic climates dictating microeconomic constraints, and micro actions driving macro trends.
Authoritative Sources & Further Reading:
- National Bureau of Economic Research (NBER): Micro and Macro Research Portals
- American Economic Association (AEA): Economic Journals and Frameworks
Discover more from The Economy
Subscribe to get the latest posts sent to your email.

Stock Market Crash 2026? How the Trump $5,000 Dividend Impacts Global Inflation

Tax-to-GDP Ratio Explained: Global Benchmarks, Fiscal Sovereignty & 2026 Insights

Trade Deficit & Terms of Trade Explained: Global Impact, Real-World Examples, and 2026 Insights

Supply vs Demand Shocks Explained: Market Equilibrium, Inflation Risks & Policy Responses in 2026

Microeconomics vs. Macroeconomics Explained: Key Differences, Interdependence & Global Impact

Devaluation vs Depreciation: Clear Differences, Causes, and Economic Impact

Purchasing Power Parity (PPP) Explained: Global Rankings, Living Standards & Why Nominal Exchange Rates Mislead in 2026

Remittances 2026: Global Trends, Household Resilience & Economic Lifeline for Developing Nations

Stagflation Explained: Causes, Global Impact & 2026 Economic Outlook

Understanding Foreign Exchange Reserves: Key Purposes and Global Impact

The Business of Gaming and Tech: How Global Economies Are Driven by Digital Consumerism

Crypto Daily Outlook: Bitcoin, Altcoins, and the Future of Decentralized Finance

Anthony Scaramucci’s Crypto Prediction: Why MicroStrategy’s Move Is Bitcoin’s “iPhone Moment”

Best Dividend Stocks 2026: European & Asian Blue Chips

State Farm’s $5B Dividend 2026: Who Qualifies & Payout Dates

US-China Relations in Q3 2026: Trade Tariffs and Supply Chain Risks

Gold’s Wild 2026: From a Record $5,600 Peak to a 24% Crash and Back Toward $4,500

Oil Surges as Strait of Hormuz Traffic Collapses Again

The Rocket That Won’t Quit: Inside SpaceX’s Falcon 9 Launch Machine

Bank of England Set to Hold Rates Through Year-End, Reuters Poll Shows

SpaceX Starship Flight 14: First Orbital Attempt & Starlink V3 Launch Explained

The 2026 Crypto Regulatory Shift: What It Means for Institutional Investors

AI Chip Stocks 2026: The Best Semiconductor Investments Beyond Marvell

Top 30 Stocks for Investment in PSX for Massive ROI in 2026

Retail Earnings Week: What Home Depot, Target & Walmart Reveal

AI-Powered Training: The Next Multi-Billion Dollar Ecosystem in Fitness

Russia’s Black Sea Oil Exports Fall for a Fifth Straight Week

Tween Back-to-School Trends 2026: What’s Driving the $85B Season
-

 Markets & Finance8 months ago
Top 15 Stocks for Investment in 2026 in PSX: Your Complete Guide to Pakistan’s Best Investment Opportunities
-

 Analysis7 months ago
Johor’s Investment Boom: The Hidden Costs Behind Malaysia’s Most Ambitious Economic Surge
-

 Analysis7 months ago
Top 10 Stocks for Investment in PSX for Quick Returns in 2026
-

 Analysis7 months ago
Brazil’s Rare Earth Race: US, EU, and China Compete for Critical Minerals as Tensions Rise
-

 Banks8 months ago
Best Investments in Pakistan 2026: Top 10 Low-Price Shares and Long-Term Picks for the PSX
-

 Investment8 months ago
Top 10 Mutual Fund Managers in Pakistan for Investment in 2026: A Comprehensive Guide for Optimal Returns
-

 Global Economy9 months ago
15 Most Lucrative Sectors for Investment in Pakistan: A 2025 Data-Driven Analysis
-

 Global Economy9 months ago
Pakistan’s Export Goldmine: 10 Game-Changing Markets Where Pakistani Businesses Are Winning Big in 2025