
Policy
US Section 301 Tariffs 2026: 60 Countries Face 12.5% Duties on Forced Labour Goods
Having lost its most powerful tariff tool in the Supreme Court, the Trump administration has found a new one — and it comes with a moral argument attached.
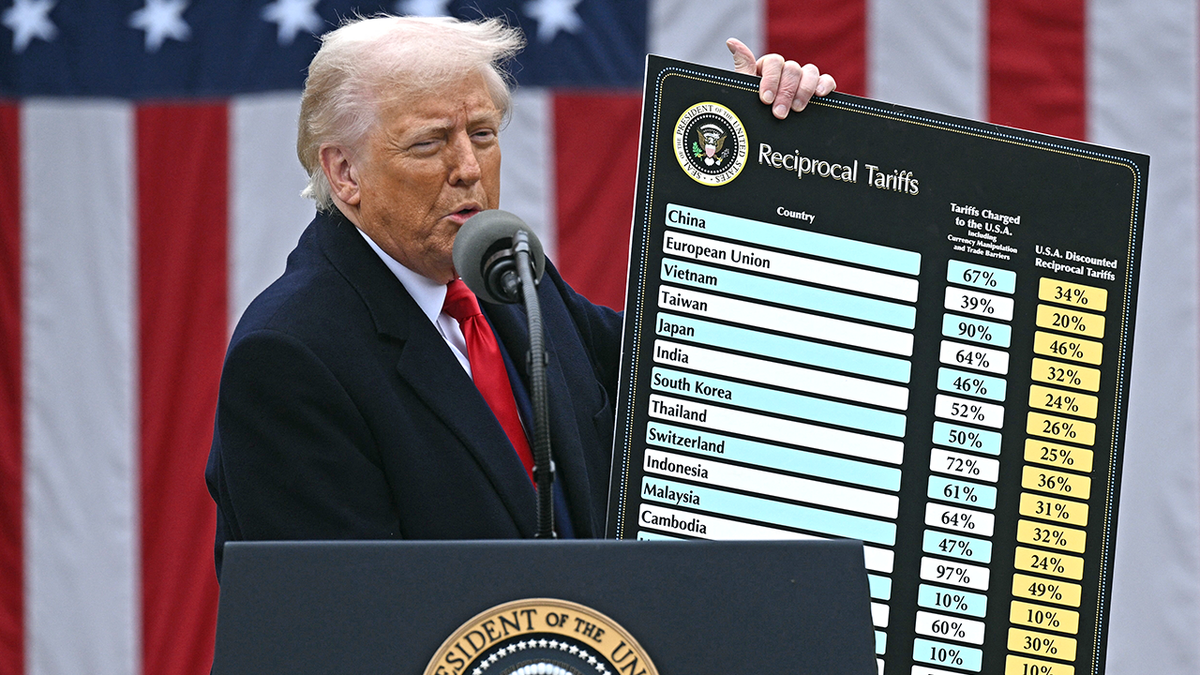
On June 2, 2026, the Office of the United States Trade Representative concluded 60 simultaneous Section 301 investigations, finding that each of the targeted economies had failed to impose or effectively enforce a prohibition on the importation of goods produced with forced labour. The proposed remedy: additional tariffs of 10% to 12.5% on all imports from those economies, covering 99.4% of total US imports by origin. The scope is unprecedented. It sweeps in China, the European Union, Japan, India, Vietnam, Australia, South Korea, and 52 other trading partners in a single action.
The Legal Architecture Post-Supreme Court
The context matters. In February 2026, the US Supreme Court struck down most of President Trump’s “Liberation Day” emergency tariffs, ruling that they exceeded the executive’s authority under the International Emergency Economic Powers Act (IEEPA). That decision dismantled the headline tariff architecture the administration had built over 2025. Rather than abandon the strategy, the Trump administration pivoted to legal frameworks with stronger statutory grounding. Section 301 of the Trade Act of 1974 authorises the president to impose levies to counter foreign trade practices that are “unreasonable or discriminatory and burden or restrict U.S. commerce” — a standard that the USTR has now applied to forced labour enforcement failures.
The investigations were formally initiated on March 12, 2026, with public hearings drawing testimony from nearly 60 witnesses and 500 written comments over April and May. The USTR’s findings drew a direct causal link between inadequate forced labour enforcement and competitive harm to US companies and workers.
The Rate Architecture
The proposed tariff structure creates two tiers. Economies that have adopted full or partial forced labour import prohibitions — notably Canada, Mexico, and a handful of others — would face 10% additional duties. The remaining 45 economies, including China, India, Japan, Vietnam, Australia, and New Zealand, would face 12.5% additional duties. A separate textile mechanism would allow a capped volume of apparel and textile imports from certain economies at a reduced rate. Electronics and AI-related products are widely expected to carry significant exemptions, according to the Economist Intelligence Unit.
The public comment period closes July 6, 2026, with hearings beginning July 7. The duties are not yet in effect — but for companies sourcing from any of the 60 targeted economies, the window to map exposure and file comments is rapidly closing.
Trading Partners Push Back
Responses from affected governments were swift and uniformly dismissive of the USTR’s reasoning. Beijing‘s commerce ministry spokesperson stated flatly that “there is no so-called forced labor in China,” and that Washington and Beijing should “meet each other halfway.” China’s foreign ministry called the accusations politically motivated.
The European Union is in a particularly complex position. Brussels signed a broad bilateral trade agreement with Washington in 2025, which the European Parliament ratified. The proposed new tariffs — which the EU called “unjustified” — would come on top of the existing 15% tariff framework from that deal. The USTR’s own report acknowledged that the EU’s anti-forced-labour regulation only entered into force in December 2027 and lacks certain enforcement elements — giving the administration its statutory foothold. The chair of the European Parliament’s trade committee described the determination as “utterly absurd” given the 2024 EU forced labour import ban law.
France‘s government questioned whether the investigation reflected genuine concerns, with officials suggesting a tariff measure was “sought first, and only then is a suitable legal justification found.”
The Supply Chain Reality for Multinationals
For global supply chain managers, the practical implications are immediate regardless of the final duty levels. The Clark Hill law firm’s trade practice advised clients to map exposure against the 60 targeted economies by HTS code, model the 10% and 12.5% rate scenarios, and test exclusion eligibility before assuming coverage — noting that even partial exposure in electronics supply chains could run to billions in added costs at scale.
Nick Marro of the Economist Intelligence Unit told CNBC that he expects the Trump administration to “unleash further investigations and tariff announcements in preparation for renewed rounds of trade talks,” characterising the Section 301 action as part of a broader pattern of building leverage ahead of bilateral negotiations. The July 24 expiration of the separate 10% baseline tariff imposed under Section 122 adds another inflection point to the calendar.
For the global trading system, the implication is clear: the US high-tariff era is not over; it has simply found a new statutory vehicle.
Discover more from The Economy
Subscribe to get the latest posts sent to your email.


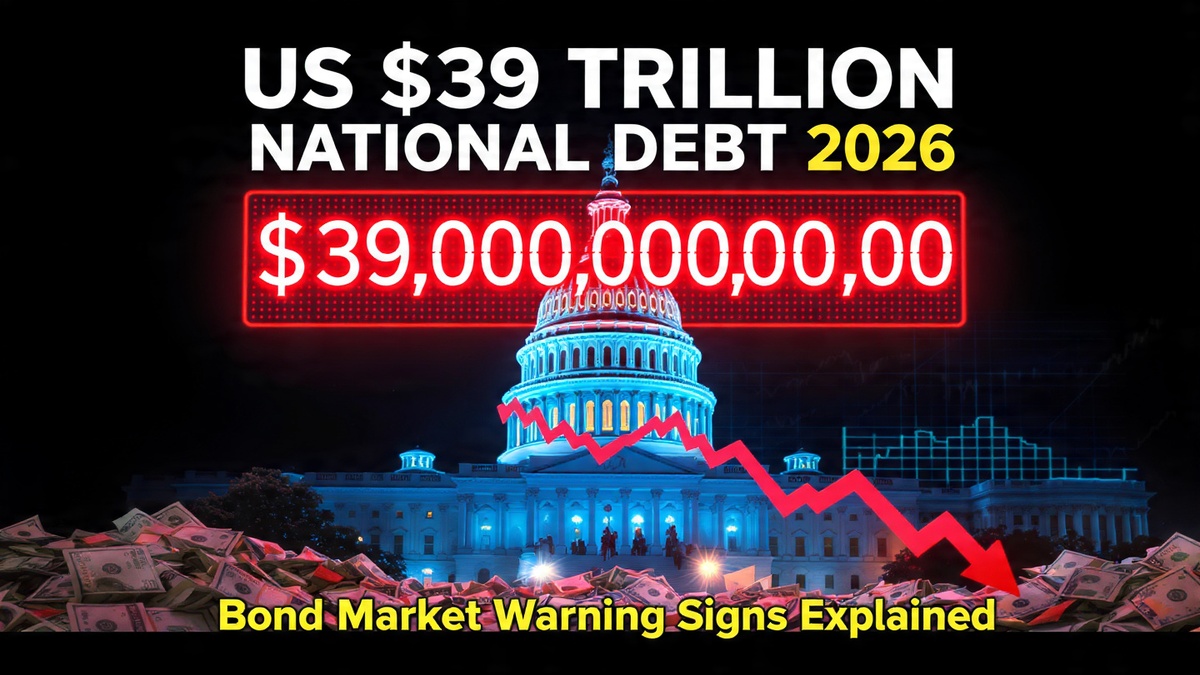
US national debt has crossed $39 trillion, bond yields are spiking, and Treasury auctions are showing soft demand. Here is what the bond market knows that Washington refuses to acknowledge.The United States crossed a number this year that no country in history has ever reached: $39 trillion in total federal debt. Not in inflation-adjusted terms. Not as a percentage of GDP. In raw dollars, the figure that sits on the public ledger of the world’s largest economy grew by $1 trillion in five months and $2 trillion in seven and a half months—and it is not slowing down.
What makes the velocity of that accumulation remarkable is the context in which it occurred. The Iran war added direct military expenditure at a pace that budget analysts said was accelerating. The 2025 tax cuts continued to erode revenue. And rising interest rates—the same rates the Federal Reserve is now signaling it may push higher still—are compounding the cost of servicing all that outstanding debt in a feedback loop that the bond market has quietly begun to price.
What the Auctions Are Saying
The most direct readout of market confidence in U.S. fiscal sustainability is the Treasury auction market, where the government sells new debt every week. Recent auctions have produced signals that bond investors usually describe in muted, technical language—but the direction is consistent.
A recent three-year Treasury auction cleared at 4.192%, well above the 3.965% at the prior auction. Yields rise when demand is soft. Soft demand at U.S. Treasury auctions is not a crisis signal—these are still among the most liquid securities in the world—but the trend line is one that fixed-income analysts at institutions ranging from J.P. Morgan to the Council on Foreign Relations have flagged as requiring close attention.
Foreign investors currently hold just above 30% of the Treasury market. Alarm bells rang briefly after April 2025’s Liberation Day tariffs—when U.S. bonds, equities, and the dollar all sold off together, the rarest of Wall Street trifectas—but subsequent data showed no dramatic reallocation away from Treasuries by foreign holders. That relative stability, however, depends on the continuation of conditions (a strong dollar, a functioning petrodollar system, geopolitical faith in U.S. institutions) that several of those conditions’ own architects now question.
The Interest Payment Problem
Of that $39 trillion, roughly $31.4 trillion is held by the public—the portion traded in financial markets globally. At current yields, the annual interest cost the U.S. government pays is on track to exceed $1 trillion for the first time in the country’s history. That figure is not a forecast. It is an arithmetic consequence of the debt level and the rate environment.
For context: U.S. defense spending in 2026 is approximately $900 billion. The federal government will spend more on interest payments than on the entire military. More than on Medicaid. More than on all discretionary non-defense programs combined. That structural reality constrains fiscal policy in ways that economists at the Deloitte Center for Financial Services have described as the most significant long-term challenge facing the U.S. economy.
“Higher bond yields affect U.S. fiscal dynamics in a number of ways,” analysts at the Council on Foreign Relations noted in their examination of tariff and Treasury interactions. “As interest payments on debt increase and use a greater share of available government funds, policymakers become more constrained around other fiscal priorities. They also can be more challenged when they need to respond to economic shocks.”
Three Credit Downgrades, Zero Course Correction
The United States has now been downgraded by all three major credit ratings agencies: S&P in 2011, Fitch in 2023, and Moody’s in May 2025. Each downgrade arrived with similar language—concerns about fiscal trajectory, political dysfunction over the debt ceiling, and a structural unwillingness to match revenues with spending. Each was followed by a brief market convulsion and then, effectively, nothing. Congress did not respond. The debt continued growing.
That pattern—of consequences being absorbed rather than heeded—is what makes the current moment structurally different from prior debt discussions, according to analysts who study sovereign fiscal crises. In those prior episodes, the U.S. still had room to maneuver: rates were low, the global appetite for dollar-denominated safe assets was rising, and alternative reserve currencies were even less credible than they are today. The margin for error has narrowed on all three dimensions.
The Political Ceiling on Solutions
The challenge is not primarily economic—it is political. Addressing a $39 trillion debt requires some combination of higher revenues, lower spending, or both. In the current Washington environment, tax increases are politically radioactive for one party and spending cuts face equivalent resistance from the other—particularly for the entitlement programs (Social Security, Medicare, Medicaid) that account for the largest share of mandatory outlays.
Markets have not yet priced the national debt as an immediate crisis, as analysts at U.S. Bank noted in their midyear market review: investors continue to watch whether rising debt eventually requires higher interest rates to attract enough Treasury buyers. The passive construction of that sentence—”continue to watch”—captures the market’s posture precisely. It is waiting. It is not yet acting.
The bond market’s message, in the language of Treasury yields and auction results, is being sent in increments rather than in a single shock. Washington is not listening. The question is not whether the message will eventually become impossible to ignore—it is how high rates must rise, and how much growth must slow, before the political system treats the ledger as a constraint rather than an abstraction.
Discover more from The Economy
Subscribe to get the latest posts sent to your email.
The effective US tariff rate has risen from 2.1% to 11.7% under Trump. Here’s how the tariff regime is reshaping global supply chains, consumer prices, and the trade war outlook for 2026.
In 2025, the Trump administration implemented the most sweeping overhaul of US trade policy since the Smoot-Hawley Tariff Act of 1930. Through executive action — primarily invoking emergency economic powers and national security statutes — the administration raised the effective US tariff rate from 2.1% to an estimated 11.7% as of January 2026.
Eighteen months later, the consequences of that decision are visible across every dimension of the US and global economy: in consumer prices, in supply chain restructuring, in the Federal Reserve’s inflation calculations, and in the diplomatic relationships that underpin global trade.
The tariff regime is not an abstract policy debate. It is a tax — and like all taxes, it has winners, losers, and unintended consequences that took time to manifest and will take years more to fully resolve.
The Scale of the Tariff Shock
To appreciate the magnitude of the 2025 tariff escalation, the baseline comparison matters. Before the first Trump administration’s tariff actions in 2018, the average US effective tariff rate on imports was approximately 1.5%. The first Trump term raised it to approximately 3%. The second term’s actions pushed it to 11.7% — a level not seen in the US in decades.
The mechanics varied by category:
- China-specific tariffs remained elevated and in many cases were increased further, targeting electronics, machinery, textiles, and consumer goods
- A 10% global baseline tariff on all imports was implemented through executive action, though this was challenged in the courts
- Sector-specific tariffs targeted steel, aluminium, solar panels, electric vehicles, and semiconductors from multiple origin countries
The Supreme Court rejected several of the most aggressive tariff actions in 2025, ruling that some executive tariff applications exceeded statutory authority. This opened the door for importers to seek refunds on improperly collected duties — a complex refund process that the administration has contested aggressively. The Supreme Court’s intervention did not eliminate the tariff regime; it trimmed its most legally exposed elements while leaving the core architecture intact.
A 10% global baseline tariff remains in effect as of June 2026.
Who Is Actually Paying the Tariffs
The most persistent economic misconception about tariffs is that foreign exporters pay them. They do not. Tariffs are paid by importing firms — US companies that purchase foreign goods — and the economic burden is distributed between exporters, importers, and consumers depending on market conditions.
The best available evidence suggests that more than 50% of Trump tariff costs are now being passed through to US consumers — a pass-through rate that has been somewhat slower than the near-100% observed under the first-term tariffs, but is accelerating as inventory buffers built before tariff implementation are depleted.
For the median US household, the effective tariff tax represents a meaningful annual cost increase — concentrated in electronics, clothing, furniture, appliances, and consumer goods where import shares are high and domestic substitutes are limited or more expensive.
The pass-through to prices has been one of the primary contributors to US inflation remaining above 3% — and is a key reason why the Federal Reserve’s task of returning inflation to 2% is more difficult than a simple demand-management problem would suggest.
Supply Chain Restructuring: Three Years In
The tariff regime has succeeded in its stated objective of prompting supply chain diversification away from China. But “diversification” has not meant “reshoring.” The dominant pattern has been near-shoring — shifting production to third countries that are not subject to the highest US tariff rates.
Vietnam, Mexico, India, Bangladesh, and Indonesia have been the primary beneficiaries of China-targeted tariff diversion. US imports from these countries have increased substantially since 2022, with Vietnam in particular becoming a major hub for electronics assembly, textile production, and component manufacturing previously concentrated in China.
The irony is that much of this production still relies on Chinese inputs — materials, components, and intermediate goods that flow through third-country manufacturing before reaching the US market. The tariff regime has in many cases added a processing step to the supply chain without fundamentally reducing Chinese industrial participation in global production networks.
Mexico, benefiting from the US-Mexico-Canada Agreement, has seen a surge of near-shoring investment from both US and Chinese firms seeking US market access through a tariff-advantaged production base. This has created genuine economic activity in Mexico while raising questions about whether the tariff regime is achieving its intended effect on Chinese production capacity.
China’s Response: Export Diversification and the Trade Surplus
China’s trade surplus — the gap between what it exports and what it imports — has actually expanded in 2026, despite (or perhaps because of) the US tariff regime. Chinese exporters have aggressively diversified their market base, deepening trade relationships with:
- Southeast Asia (ASEAN markets, particularly Vietnam, Indonesia, Thailand)
- Latin America (Brazil, Mexico, Argentina)
- Africa (through the Belt and Road infrastructure network)
- Middle East (Gulf states diversifying from Western supply chains)
- Russia (bilateral trade dramatically expanded since Western sanctions)
This market diversification has reduced China’s vulnerability to US tariff pressure while maintaining the export-led growth model. The result is a structural change in global trade flows — with Chinese goods increasingly reaching the world through routes that bypass direct US market entry.
The EU has responded separately. European tariffs on Chinese electric vehicles, implemented in 2025, represent the most significant trade action in the China-Europe relationship in years. But China’s response has been measured — targeting European luxury goods with retaliatory measures while continuing to invest in European market access through investment in non-tariffed segments.
The Inflation Arithmetic
The tariff-inflation relationship is one of the most debated and most significant economic linkages in 2026.
The direct mechanism is straightforward: tariffs raise the cost of imported inputs, which businesses pass through to consumer prices. The indirect mechanism is subtler: tariffs reduce import competition, allowing domestic producers to raise prices without competitive constraint. Both channels are operational in the current US economy.
Stanford’s Institute for Economic Policy Research estimated that tariff pass-through to consumers now exceeds 50%, with the full pass-through taking 12–18 months from tariff implementation. Given the tariff escalation of 2025, the full inflationary impact is still working its way through the system as of mid-2026.
This creates a structural floor on US inflation that makes the Federal Reserve’s 2% target difficult to achieve without either reversing the tariff regime (a political impossibility under the current administration) or engineering a significant recession that reduces demand enough to offset the supply-side price pressure.
The Fed cannot solve a tariff-driven inflation problem with interest rate tools alone. This is the core of the policy trap that Kevin Warsh inherited upon taking the Fed chair position.
The WTO and the Multilateral Trade Framework
The US tariff regime has created significant strain on the World Trade Organization framework. Multiple WTO dispute settlement proceedings have been filed by trading partners including the EU, China, Japan, South Korea, and Canada. The US has contested these proceedings and has maintained its practice of blocking WTO Appellate Body appointments — a practice that began in the first Trump term and has effectively disabled the WTO’s binding dispute resolution mechanism.
The practical consequence: the global trading system has fragmented into a series of bilateral and regional arrangements, with the WTO’s rules-based framework increasingly supplemented or supplanted by power-based bilateral negotiations.
For businesses operating across borders, this fragmentation creates compliance complexity, supply chain uncertainty, and strategic risk that has no precedent in the post-war era of multilateral trade liberalisation.
What Comes Next: The Second Half of 2026
Several tariff-related developments are likely to shape the trade environment in the second half of 2026:
Supreme Court refund proceedings — the ongoing dispute over duty refunds for imports collected under executive actions that courts ruled as exceeding statutory authority. Resolution will affect importers’ balance sheets and the effective tariff rate going forward.
EU-US tariff negotiations — the Biden-era tariff truce framework has partially frayed under the Trump administration’s more aggressive posture. EU-US talks on steel, aluminium, and digital services remain ongoing and unresolved.
China-US trade dynamics — with China’s trade surplus expanding and US domestic pressure for further action on Chinese imports growing, additional tariff escalation cannot be ruled out. The November 2026 midterm elections create political incentives for trade action.
WTO dispute outcomes — while the Appellate Body remains disabled, preliminary panel rulings could create diplomatic pressure points with major trading partners.
The Bottom Line
The Trump tariff regime has fundamentally altered the US and global trade landscape. The effective tariff rate of 11.7% represents the most significant barrier the US has erected to international commerce in generations, with consequences that run from consumer prices and Federal Reserve policy to supply chain geography and WTO institutional legitimacy.
The tariff regime is not going away. Political economy — domestic manufacturing interests, national security framing, and electoral incentives — makes tariff rollback extremely unlikely under the current administration.
The relevant questions for investors and businesses are not whether tariffs will be reversed, but how supply chains adapt, how much of the inflationary pass-through remains ahead, and whether the trade war escalates or stabilises in the second half of 2026.
FAQ
Q: What is the current US tariff rate in 2026?
A: The US effective tariff rate rose from approximately 2.1% before the Trump administration to an estimated 11.7% as of January 2026. A 10% global baseline tariff on all imports remains in effect after the Supreme Court struck down some of the most aggressive executive tariff actions.
Q: How do tariffs affect inflation in 2026?
A: More than 50% of tariff costs are now being passed through to US consumers, according to Stanford SIEPR research. This represents a structural supply-side inflation pressure that the Federal Reserve cannot resolve through interest rate policy alone.
Q: What happened to US-China trade in 2026?
A: US-China direct trade has declined under tariff pressure, but China has diversified its export markets significantly — increasing flows to Southeast Asia, Latin America, Africa, and the Middle East. China’s overall trade surplus has actually expanded in 2026.
Q: How are tariffs affecting US consumers in 2026?
A: US consumers are facing higher prices on electronics, clothing, appliances, and consumer goods as tariff costs are passed through the supply chain. This contributes to the inflation reading of 4.2% in May 2026 and reduces household purchasing power.
Discover more from The Economy
Subscribe to get the latest posts sent to your email.
New Fed Chairman Kevin Warsh’s first FOMC meeting has flipped the dot plot from projected cuts to projected hikes, eliminated forward guidance, and sent markets reeling. Here is the complete breakdown of what happened and what comes next.
The Rate-Cut Trade Is Dead
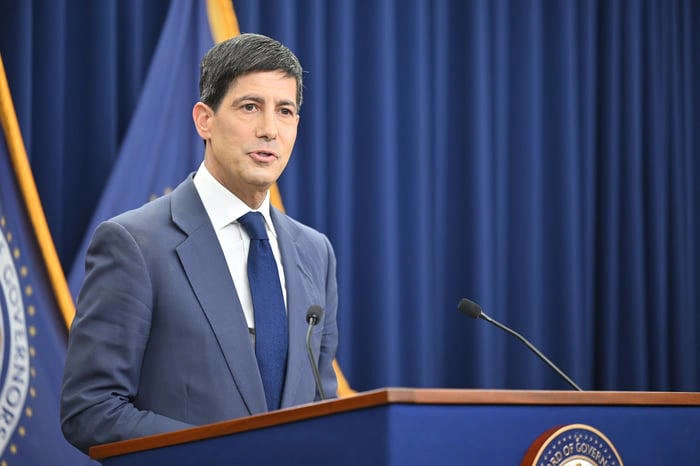
On June 17, 2026, Kevin Warsh chaired his first Federal Open Market Committee meeting as the new Chairman of the Federal Reserve. What followed was one of the most consequential shifts in US monetary policy communication in years.
The rate hold was widely anticipated. What was not anticipated was the magnitude of the hawkish signal embedded in the updated economic projections — and the fundamental change in how the Fed communicates with markets.
The Dot Plot Stunner: From Cuts to Hikes in One Quarter
The Fed’s “dot plot” — a chart showing where each FOMC member expects interest rates to be in coming years — delivered a stunning reversal. Nine of the 18 voting members now project an interest rate hike before end of 2026, with six projecting two 25-basis-point hikes. The dot plot median jumped from a projected year-end rate of 3.4% to 3.8% in a single quarter.
To appreciate the full significance of this shift, consider where markets were at the start of 2026: pricing in three rate cuts by December. That expectation has now been completely reversed. CME FedWatch data now shows virtually no probability of rate cuts in 2026, with a 60%+ chance of at least one hike by October.
Warsh’s Communication Revolution: Killing Forward Guidance
Perhaps more significant than the dot plot shift was Warsh’s deliberate dismantling of the Fed’s forward guidance regime — the practice of pre-signaling future rate moves that Jerome Powell had used throughout his tenure.
Warsh’s rationale was explicit: “I think financial markets perform best when they react to incoming data.” That is a structural change with profound implications. Markets that have spent 15 years pricing assets based on Fed forward guidance now face a fundamentally different environment — one where every data release carries maximum uncertainty.
The immediate market reaction was sharp. The S&P 500 dropped, the Nasdaq fell, the Dow lost over 500 points in afternoon trading. The 2-year Treasury yield surged 16 basis points to 4.21%.
Why Warsh Did Not Submit His Own Dot
One of the most unusual and closely watched aspects of the June meeting was Warsh’s decision to withhold his own rate projection from the dot plot — an unprecedented step for a sitting Fed Chairman.
The dot plot confirmed that even one rate cut in 2026 is not the base case. Warsh announced five task forces to review the Fed’s monetary policy operations, communications, data sources, productivity and the labor market. The task force review suggests Warsh may also be questioning the dot plot tool itself — potentially with plans to restructure or eliminate it as part of a broader overhaul of Fed communications.
His silence spoke loudest of all. Markets interpreted the missing dot as Warsh reserving maximum flexibility — unwilling to commit to a path before his task forces have completed their assessment.
What This Means for Investors and Borrowers
The hawkish pivot reshapes the financial landscape across multiple dimensions:
Equities: Elevated rates for longer compress valuations on growth stocks. Technology and AI companies — which have led the market higher on expectations of rate cuts — face increased pressure as the discount rate for future earnings rises.
Fixed Income: Treasury yields rising means existing bond holders face mark-to-market losses. However, new buyers lock in attractive yields. The 2-year Treasury note is now offering yields not seen since early 2025.
Mortgages and Housing: Higher-for-longer rates keep mortgage rates elevated, suppressing housing affordability and transaction volumes — a continued drag on construction and related industries.
The Dollar: A more hawkish Fed relative to other central banks (the Bank of England held at 3.75%, the Swiss National Bank at 0%) supports dollar strength — which in turn creates headwinds for emerging market economies with dollar-denominated debts.
FAQs
Q: Who is Kevin Warsh? Kevin Warsh is a former Federal Reserve Governor (2006–2011) and private sector financier who was nominated by President Trump and confirmed by the Senate as Fed Chair on May 13, 2026. He succeeded Jerome Powell, who remains a voting member of the FOMC.
Q: Will the Fed actually raise rates in 2026? As of June 2026, nine of 18 FOMC members project at least one hike before year-end, and CME FedWatch shows greater than 60% probability of a hike by October. Whether this materializes depends heavily on incoming inflation data, particularly whether oil price declines translate into lower core PCE readings.
Q: What is the dot plot? The “dot plot” is a chart released quarterly by the Fed showing each FOMC member’s projection for where the federal funds rate will be at the end of each year and in the longer run. It is used by markets to gauge the central bank’s collective rate outlook.
Q: Why did Warsh eliminate forward guidance? Warsh believes that pre-committing to rate paths can distort market pricing and reduce the Fed’s flexibility to respond to incoming data. By removing forward guidance, he is returning to a more traditional model of responding to economic conditions rather than managing expectations about future policy.
Discover more from The Economy
Subscribe to get the latest posts sent to your email.

AI Infrastructure Debt Bubble 2026: $570 Billion in Global Debt Issuance Raises Systemic Risk Alarm

Argentina Economy 2026: Milei’s Fiscal Surplus, Inflation Drop to 29%, and What Comes Next

Global Economic Growth 2026: World Bank Cuts Forecast to 2.5%

Gold Price 2026: J.P. Morgan Forecasts $6,000/oz as Inflation, Iran War

US Section 301 Tariffs 2026: 60 Countries Face 12.5% Duties on Forced Labour Goods

China Economy 2026: 87% Semiconductor Surge, Property Crisis

Kevin Warsh Fed 2026: Rate Hold, Hawkish Dot Plot, and the End of Forward Guidance

SpaceX IPO 2026: $2 Trillion Valuation, Retail Frenzy, and the Risks

Oracle AI Debt Crisis 2026: $130 Billion Gamble Triggers Worst Stock Crash Since Dot-Com Bust

Male Labor Force Participation Rate 2026: Why Men Are Leaving & Economic Impact

Trump Tariffs 2026: Economic Impact, Household Costs & Trade War Outlook

China Economy 2026: Export Boom Masks Property Crisis & Investment Slump

US Inflation 4% May 2026: Is the Worst Over? Fed, Oil Prices

AI Memory Chip Shortage 2026: Nvidia, Apple & What Comes Next

PwC China Partner Payouts Cut Amid Evergrande Audit Fraud

Broadcom Market Value Loss: Revenue Forecast Disappoints

Investors Pile Into Bullish Dollar Bets as ‘US Exceptionalism’ Trade Returns

Here’s How Much It’ll Cost You to Be Part of SpaceX’s Record-Breaking $75 Billion IPO

Nasdaq Tumbles 4% as Chip and Memory Stocks Sink: A $1.2 Trillion Wipeout

How to Fix Pakistan’s Debt Economy: A Structural Blueprint

Smash Capital Leads $200M Funding for Allen Control Systems

Democrats Draw a Red Line Around Military AI — And the Pentagon Is Already Pushing Back

New Investment Super-Cycle: AI, Green Energy & Re-Shoring

Xponential Fitness Franchise Lawsuit: The $3.97M Judgment

Middle East Conflict Oil Prices: The $4 Surge Explained

Grinding the Already Ground: Pakistan’s Inflation Crisis

The End of the Chatbot: Why OpenAI is Tearing Up Its Most Successful Product

Musk’s SpaceX Lines Up Retail Investors for Record IPO Allocation
-

 Markets & Finance6 months ago
Top 15 Stocks for Investment in 2026 in PSX: Your Complete Guide to Pakistan’s Best Investment Opportunities
-

 Analysis4 months ago
Top 10 Stocks for Investment in PSX for Quick Returns in 2026
-

 Analysis5 months ago
Brazil’s Rare Earth Race: US, EU, and China Compete for Critical Minerals as Tensions Rise
-

 Analysis4 months ago
Johor’s Investment Boom: The Hidden Costs Behind Malaysia’s Most Ambitious Economic Surge
-

 Banks5 months ago
Best Investments in Pakistan 2026: Top 10 Low-Price Shares and Long-Term Picks for the PSX
-

 Investment6 months ago
Top 10 Mutual Fund Managers in Pakistan for Investment in 2026: A Comprehensive Guide for Optimal Returns
-

 Global Economy6 months ago
15 Most Lucrative Sectors for Investment in Pakistan: A 2025 Data-Driven Analysis
-

 Global Economy6 months ago
Pakistan’s Export Goldmine: 10 Game-Changing Markets Where Pakistani Businesses Are Winning Big in 2025