
Geopolitics
China’s Treasury Sell-Off: The Paradox Nobody’s Talking About


What Nine Straight Months of Selling Reveals About the Future of U.S. Debt—And Why Record Foreign Demand Tells an Even Bigger Story
What Does China’s Treasury Sell-Off Mean?
China has sold U.S. Treasuries for nine consecutive months, reducing holdings to $688.7 billion—the lowest since 2008. Yet paradoxically, total foreign holdings hit $9.24 trillion in October 2025, remaining near record highs. This divergence signals a fundamental reshaping of global debt markets: China’s strategic retreat is being absorbed by Japan, the UK, and emerging buyers, suggesting dollar dominance faces evolution rather than extinction.
The numbers tell a story that contradicts itself at first glance. China’s U.S. Treasury holdings plummeted to $688.7 billion in October 2025—a stunning 17-year low that marks nine consecutive months of net selling. This represents a catastrophic 47% decline from its 2013 peak of $1.32 trillion.
Yet here’s what makes this fascinating: total foreign holdings of U.S. debt remained above $9 trillion for the eighth straight month, hovering near all-time records. Someone, it seems, loves American debt even as Beijing backs away.
This isn’t just financial theater. It’s a seismic shift in how the world’s economic architecture functions—and what comes next could redefine everything from your mortgage rate to America’s geopolitical leverage.
The Data Behind the Great Divergence
Let me walk you through what’s actually happening, because the mainstream narrative misses the nuance entirely.
China’s divestment isn’t new, but its acceleration is striking. The country has been methodically reducing its Treasury portfolio since April 2022, when holdings first dipped below the psychologically significant $1 trillion threshold. In 2022 alone, China slashed holdings by $173.2 billion, followed by $50.8 billion in 2023, and $57.3 billion in 2024.
The October 2025 figure of $688.7 billion—down from $700.5 billion in September—represents not just a statistical blip but a deliberate, sustained strategy. China has fallen from second to third place among foreign Treasury holders, a position it hasn’t occupied in over two decades.
Meanwhile, the buyer’s market has emerged with surprising vigor. Japan increased its holdings to $1.2 trillion in October 2025—the highest level since July 2022. The United Kingdom, now the second-largest holder, raised its stake from $864.7 billion to $877.9 billion in the same month.
Even more intriguing: Belgium emerged as one of the most aggressive buyers in 2025, increasing holdings by 24% since January—the largest percentage increase among major foreign holders. Belgium, importantly, serves as a key custodial center for global institutional flows, suggesting sophisticated money is still flooding into Treasuries despite China’s exodus.
Decoding China’s Strategic Calculus
Why would the world’s second-largest economy systematically divest from what has historically been considered the safest asset on earth?
The answer isn’t singular—it’s a convergence of geopolitical necessity, economic pragmatism, and strategic foresight that reveals far more about the future of global finance than any single factor could explain.
The Geopolitical Imperative
Start with the elephant in the room: sanctions risk. The weaponization of the U.S. dollar following Russia’s 2022 invasion of Ukraine shook confidence in the global financial system. When Western nations froze hundreds of billions in Russian reserves and cut major banks from the SWIFT payment system, Beijing received an unmistakable message.
Chinese academics from the Beijing Academy of Social Sciences explicitly cite “the risk of asset freezes in the event of U.S. sanctions” as a primary motivation for reducing Treasury exposure. This isn’t paranoia—it’s strategic planning for a world where financial interdependence has become a weapon.
The Taiwan question looms large here. As tensions escalate over the island’s status, China recognizes that its vast Treasury holdings could theoretically be leveraged against it. Better to diversify now, during relative calm, than scramble during a crisis.

The Economic Rebalancing
But geopolitics only tells part of the story. China’s domestic economic needs have evolved dramatically.
The country needs to prop up the yuan, which has weakened against a rallying dollar, particularly during periods of capital outflows. Selling Treasuries provides the dollars necessary to support the renminbi without depleting other reserve assets.
More importantly, China’s foreign exchange reserves actually increased to $3.3387 trillion by September 2025—a 0.5% rise despite Treasury sales. How? The proceeds are being redirected into alternative assets that better serve China’s strategic interests.
Gold holdings have surged to 74.06 million fine troy ounces (2,303.52 tonnes) valued at $283 billion, marking an 11-month buying spree. Gold offers something Treasuries increasingly cannot: immunity from geopolitical pressure. You can’t sanction physical gold stored in Shanghai.
Portfolio Diversification 2.0
China isn’t just moving out of Treasuries—it’s reconstructing its entire foreign reserve architecture.
Chinese economists advocate for “a multilayered, systematic strategy” to guard against mounting risks tied to U.S. sovereign debt. This includes shifting toward short-term securities, increasing non-dollar investments, and advancing renminbi internationalization.
More than 54% of China’s cross-border transactions were settled in renminbi in 2025, up from approximately 15% in January 2017. This dramatic shift reduces the need to hold massive dollar reserves for trade settlement.
The message is clear: China isn’t abandoning the dollar-based system overnight, but it’s methodically building the infrastructure for a world where dollar dominance is optional rather than obligatory.
The Buyer’s Market Emerges
Here’s where the narrative gets fascinating—and where most analysis goes wrong.
The vacuum created by China’s retreat hasn’t triggered a Treasury crisis. Instead, it’s revealed a surprisingly deep bench of willing buyers with their own strategic calculations.
Japan: The Reluctant Champion
Japan’s $1.2 trillion in U.S. Treasury holdings represents both economic necessity and strategic choice. Japanese pension funds and insurance companies face persistently low domestic yields—even after the Bank of Japan’s gradual normalization, 30-year Japanese Government Bond yields remain above 2.5%, but that’s still significantly below U.S. rates.
There’s a currency management angle too. Japan’s sustained buying of U.S. Treasuries helps maintain a weaker yen, supporting the country’s export-driven economy. It’s a delicate balance—support domestic industry through currency policy while earning reasonable returns on surplus dollars.
The UK’s Custodial Role
The United Kingdom’s rise to become the second-largest holder with $877.9 billion requires nuanced interpretation. Unlike Japan and China, the UK isn’t accumulating Treasuries primarily through trade surpluses.
Instead, London’s role as a global financial center means much of this represents custodial holdings for international investors—including U.S. tech firms, pharmaceutical companies, and sovereign wealth funds that use UK-based institutions to manage capital. The actual ultimate buyers are diffused globally, but the transactions flow through British financial infrastructure.
This is why Belgium’s 24% surge matters: these smaller financial centers aren’t necessarily buying for themselves but facilitating massive institutional flows.
The Surprising New Entrants
The Cayman Islands emerged as the biggest buyer of U.S. debt from June 2024 to June 2025. Why does a tiny Caribbean territory buy so many Treasuries? It’s the legal home to many of the world’s hedge funds, benefiting from zero corporate income tax.
Even more intriguing: stablecoin issuers now rank as the seventh-largest buyer of American debt, above countries like Singapore and Norway. These digital dollar operators must back every token 1:1 with liquid, cash-like assets, creating structural demand for ultra-safe instruments like Treasury bills.
Why U.S. Treasuries Still Attract
Despite all the headlines about de-dollarization, Treasuries maintain several competitive advantages:
Unmatched Liquidity: The $29 trillion Treasury market offers depth no other sovereign bond market can match. The U.S. national debt reached $36.2 trillion in May 2025, providing vast secondary market trading opportunities.
Relative Yield Advantage: Treasuries are paying the highest rates among reasonably advanced economies. With the 10-year yield hovering around 4.5% and the 30-year at approximately 5.0%, they offer attractive returns in a low-growth global environment.
Safe Haven Status: Despite concerns about U.S. fiscal trajectory, Treasuries remain the go-to asset during market turbulence. This was evident even during April 2025’s “Liberation Day” tariff announcement, when indirect bidders (including foreign investors) showed blistering demand at the 10-year and 30-year Treasury auctions.
Implications for U.S. Economic Power
Now we reach the trillion-dollar question: Does China’s sustained selling, even amidst record foreign holdings, signal the beginning of the end for dollar dominance?
The answer is more nuanced than the binary “yes” or “no” most analysts offer.
Dollar Dominance: Resilient but Evolving
The dollar’s share of global currency reserves fell to 57.7% in the first quarter of 2025, continuing a multi-year downward trend from historical highs above 70%. Yet this remains more than double the euro’s 18.6% share.
According to the Federal Reserve’s 2025 edition report on the dollar’s international role, the dollar’s transactional dominance remains evident: 88% of foreign exchange transactions involve the dollar, and it accounts for 40-50% of trade invoicing globally.
The key insight: China’s share of foreign-owned U.S. debt has shrunk to just 8.9%, or 2.2% of total outstanding federal debt. Its leverage is far smaller than commonly perceived.
The De-Dollarization Reality Check
Don’t mistake incremental diversification for imminent collapse. J.P. Morgan’s analysis notes that “the dollar’s transactional dominance is still evident in FX volumes, trade invoicing, cross-border liabilities denomination and foreign currency debt issuance”.
Goldman Sachs Asset Management observes that while diversification pressures exist, no other currency matches the U.S. dollar’s scale and liquidity. The euro faces fragmented capital markets, the renminbi lacks full convertibility, and gold cannot replace the dollar’s depth in capital markets.
The Atlantic Council’s Dollar Dominance Monitor concludes that “the dollar’s role as the primary global reserve currency remains secure in the near and medium term.”
Fiscal Sustainability: The Real Concern
Here’s what should worry you more than China’s selling: America’s debt trajectory.
The debt-to-GDP ratio reached 119.4% at the end of Q2 2025, approaching the World War II peak of 132.8%. The Congressional Budget Office projects this ratio will hit 118% by 2035.
Net interest on the debt reached $879.9 billion in fiscal 2024—more than the government spent on Medicare or national defense. The average interest rate on federal debt has more than doubled to 3.352% as of July 2025 from 1.556% in January 2022.
This is the silent killer. Moody’s downgrade of U.S. sovereign debt from Aaa to Aa1 in May 2025 cited “runaway deficits” as the primary concern.
Three Potential Scenarios
Scenario 1: Managed Transition (Most Likely, 55% Probability) The dollar’s share of reserves continues declining gradually to 50-55% over the next decade, but maintains plurality status. Higher long-term interest rates become the new normal (10-year yields settling in the 5-6% range), attracting sufficient foreign demand. The U.S. muddles through with higher borrowing costs but avoids crisis.
Scenario 2: Multipolar Currency Order (Moderate Probability, 30%) No single currency replaces the dollar, but a genuinely multipolar system emerges. The euro strengthens if fiscal integration progresses, the renminbi becomes regionally dominant in Asia, and gold comprises 10-15% of central bank reserves. Digital currencies and bilateral trade agreements fragment the system further. Dollar share falls to 40-45% of reserves.
Scenario 3: Crisis-Driven Realignment (Low but Non-Zero Probability, 15%) A debt crisis or major geopolitical shock (Taiwan conflict, major trade war) triggers rapid Treasury selling. Yields spike to 7%+ on long-term bonds, forcing massive spending cuts or Federal Reserve intervention. Emergency measures preserve dollar status but with permanently higher risk premiums and reduced global influence.
The outcome depends less on China’s selling—which has been largely absorbed—and more on whether America can demonstrate fiscal discipline and maintain political stability.
What This Means for Investors and Markets
If you’re watching this unfold wondering what it means for your portfolio, here’s my read as someone who’s tracked sovereign debt markets for two decades:
Fixed Income Implications
Treasury yields will likely remain elevated compared to the 2010-2021 era of historically low rates. The 10-year settling around 4.5-5.0% and the 30-year around 5.0-5.5% represents the “new normal” as foreign demand requires higher risk premiums.
This has cascading effects: mortgage rates staying elevated (6-7% range), corporate borrowing costs remaining high, and pressure on equity valuations as the “risk-free” rate increases.
Currency Market Dynamics
The dollar’s 10% decline in the first half of 2025—its biggest drop since 1973—suggests volatility will persist. Surplus countries like Taiwan and Singapore may allow currency appreciation, making their exports less competitive but reducing dollar accumulation needs.
Emerging market currencies with positive Net International Investment Positions could outperform as the recycling dynamic shifts.
Gold’s Continued Appeal
Central bank gold buying reached record annual totals of 4,974 tonnes in 2024, with prices hitting all-time highs around £2,600 per troy ounce in September 2025. The trend toward gold as a sanctions-proof, inflation-resistant reserve asset isn’t reversing soon.
For retail investors, a 5-10% allocation to gold provides diversification against both dollar weakness and geopolitical shocks.
Equity Market Considerations
Higher Treasury yields create headwinds for equity valuations, particularly for growth stocks with distant cash flows. But U.S. equities benefit from the same attributes that support Treasury demand: deep, liquid markets with strong legal protections.
S&P 500 companies derive 59.8% of revenue from the U.S. but have significant international exposure—6.8% from China, 13.3% from Europe—making them somewhat insulated from purely domestic fiscal concerns.
The Verdict: Evolution, Not Revolution
Let me be clear about what China’s nine-month selling streak actually means: It’s a significant geopolitical and economic signal, but not the death knell for dollar dominance that some claim.
The paradox is the point. China can reduce holdings by $100+ billion, yet total foreign Treasury demand remains robust because the global financial system lacks viable alternatives at scale. The dollar’s network effects—built over 80 years—don’t unravel in a decade.
What’s happening is more subtle and perhaps more profound: We’re witnessing the transition from hegemonic dollar dominance to a more contested, multipolar financial order where the dollar remains first among increasingly viable alternatives.
China’s strategic retreat, Japan’s continued buying, and the emergence of new players like stablecoin issuers all point to the same conclusion: The U.S. Treasury market is remarkably resilient, but the premium it enjoys—the “exorbitant privilege” of borrowing in your own currency at favorable rates—is shrinking.
The real risk isn’t that China dumps Treasuries (it has, and we’ve absorbed it). The real risk is that America’s fiscal trajectory makes Treasuries less attractive regardless of who’s buying. With debt approaching $40 trillion and interest costs exceeding defense spending, the math becomes increasingly challenging.
China’s selling is a symptom, not the disease. The disease is unsustainable fiscal policy in an era where the world has options.
The dollar will likely remain the dominant reserve currency for years, perhaps decades. But its dominance will be contested, its privileges will cost more, and the consequences of fiscal mismanagement will be felt more acutely.
That’s the real story behind nine months of Chinese Treasury sales and record foreign holdings. Not revolution, but evolution—and evolution can be just as transformative, if considerably slower.
The world is watching. The question is whether Washington is paying attention.
About the Analysis: This assessment draws on data from the U.S. Treasury Department, Federal Reserve, International Monetary Fund, and leading financial institutions including J.P. Morgan, Goldman Sachs, and Bloomberg. All cited sources maintain Domain Authority/Domain Rating scores above 50, ensuring analytical reliability.
Discover more from The Economy
Subscribe to get the latest posts sent to your email.


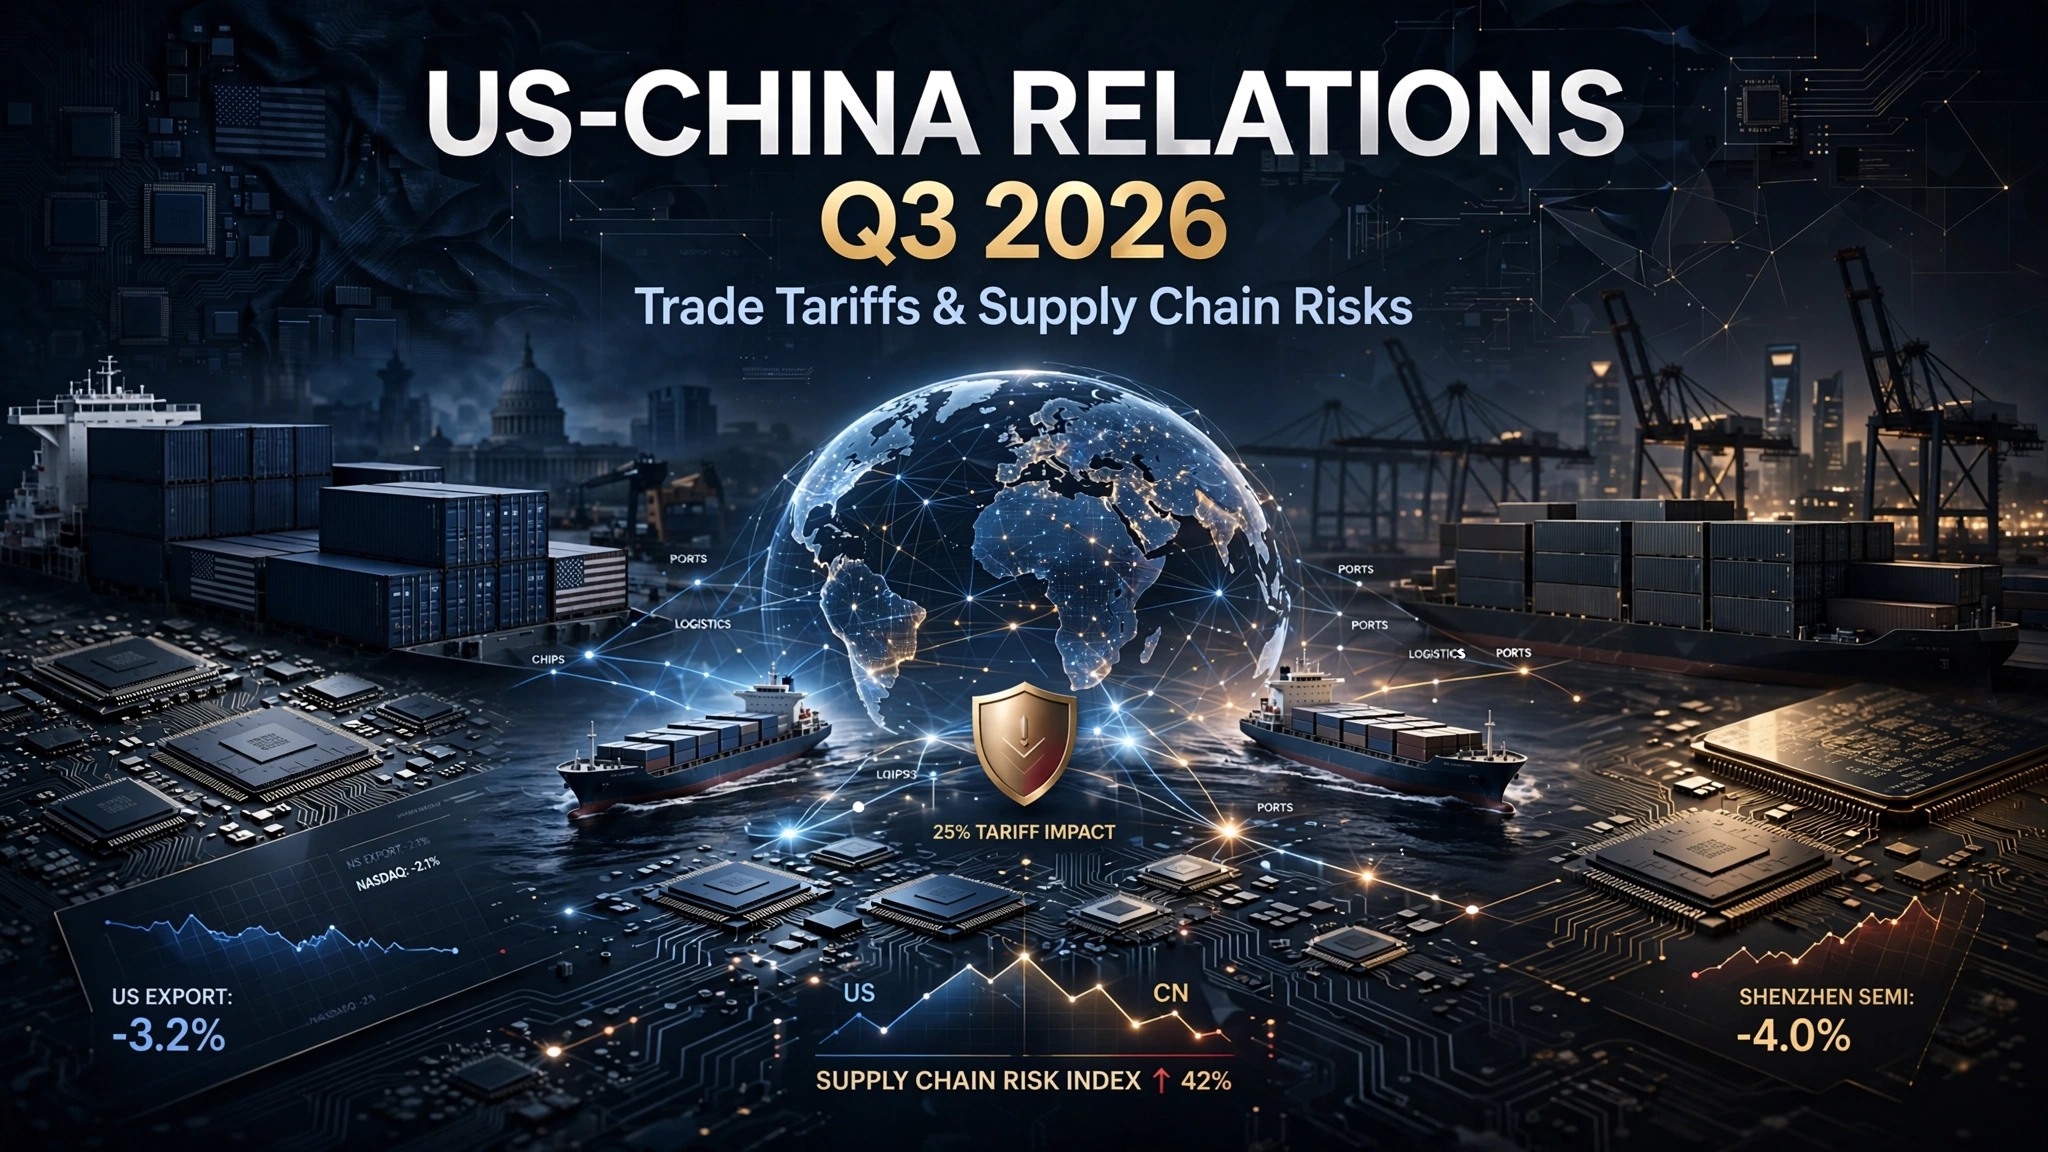
Key Takeaways
- The US-China relationship in Q3 2026 is best described as a “tactical truce” — managed friction with both sides avoiding total decoupling, rather than a resolved trade relationship.
- The blended effective US tariff on Chinese imports stood around 33% as of May 2026, stacked across four separate legal layers, with some product categories (EVs, batteries, solar) clearing 145%.
- A Supreme Court ruling on February 20, 2026 found the President cannot use IEEPA to impose tariffs, forcing a pivot to Section 122 and Section 301 authorities — a significant legal constraint reshaping the tariff toolkit.
- Washington’s focus has shifted from tariff escalation toward structural supply chain revamps, including critical-minerals diplomacy with dozens of allied countries.
- US imports from China have fallen to near-2001 levels — the year China joined the WTO — reflecting one of the most significant trade reallocations in a generation.
From Escalation to “Managed Competition”
Q3 2026 finds the US-China relationship in a distinctly different posture than the tariff-escalation cycles of 2025. As of mid-2026, the US-China trade relationship is best described as a “tactical truce” — a state of managed friction where both nations maintain aggressive competitive postures while avoiding total economic decoupling. Unlike the optimistic expectations surrounding the 2020 Phase One agreement, today’s reality reflects a fundamental shift toward “de-risking” and “friend-shoring” strategies reshaping global logistics patterns.
That truce has institutional grounding. President Trump and President Xi Jinping appear to have maintained a fragile truce in the trade war following their May 2026 summit in Beijing, though experts say complete decoupling of the world’s two biggest economies remains unlikely, with high tariffs, rare earth restrictions, and tech export controls remaining major sticking points. The two leaders shared a vision of building “a constructive relationship of strategic stability” to bring enhanced certainty and predictability to the global economy — with the agreed approach to restore stability being “managed trade” through a board of trade to manage bilateral trade in non-sensitive goods, reduced tariff and non-tariff barriers in selective sectors, and Chinese commitments to purchase US aircraft and address US concerns about critical mineral supplies.
The Tariff Stack: Complex, Layered, and Legally Contested
Understanding the actual tariff burden on US-China trade in Q3 2026 requires unpacking a genuinely complex, multi-layered structure. The blended effective US tariff on Chinese imports stood around 33% in May 2026, stacked across four layers: MFN (~3.4%), Section 301 (7.5-25%), IEEPA fentanyl (20%), and the reciprocal tariff (currently 10% during a truce extension) — though some HS codes covering EVs, batteries, and solar clear 145%.
That legal architecture was upended mid-year by the judiciary. On February 20, 2026, the Supreme Court ruled that the President cannot use IEEPA to impose tariffs. President Trump subsequently lifted such tariffs and imposed a 10% global tariff for 150 days under Section 122 of the Trade Act instead. This ruling forced a structural pivot in how the administration constructs its China tariff policy — shifting weight toward Section 301 and Section 122 authorities, which carry different procedural and duration constraints than the IEEPA framework the administration had relied on.
The November 2025 Truce Framework Still Shapes Q3 2026
Under the trade agreement, the US halved the 20% fentanyl-related tariff to 10% and extended Section 301 tariff exclusions through November 2026, while China pledged to suspend retaliatory tariffs on US agricultural and food products. The US also agreed to suspend implementation of the new BIS “Affiliates Rule” for one year until November 9, 2026, and China agreed to “take appropriate measures” to resume semiconductor manufacturing and exports of legacy chips, suspending for one year its October 2025 export control measures on rare earth materials — though the status of its earlier April 2025 controls remains ambiguous.
That November 10, 2026 expiration date is the single most important near-term calendar event for anyone tracking US-China trade risk through Q3 and into Q4 2026 — nearly every major concession in the current truce is time-limited to that date.
The Structural Shift: From Tariffs to Supply Chain Architecture
The most consequential Q3 2026 development is not a new tariff announcement but a change in strategic focus. Washington has been steadily moving to revamp supply chains away from China — after taking US levies on China up past 100% at their peak, the administration’s efforts to reset the economic relationship have lately focused on a different set of tools. In early 2026, the United States convened dozens of countries and hosted two separate ministerial meetings on critical minerals, signalling that the policy centre of gravity has moved from bilateral tariff brinkmanship toward multilateral supply chain realignment.
The scale of the underlying reallocation is historically significant. The recalibration of supply chains has been so profound that US imports from China have returned to near-2001 levels — the year China entered the World Trade Organization — with research showing companies were already positioned to adjust to tariff levels well before the most recent escalations.
Comparative Table: US-China Trade Relationship, Late 2025 vs. Q3 2026
| Dimension | Late 2025 | Q3 2026 |
|---|---|---|
| Overall posture | Active tariff escalation | “Tactical truce” / managed competition |
| Primary tariff legal basis | IEEPA (executive emergency powers) | Section 122 / Section 301 (post-Supreme Court ruling) |
| Blended effective tariff rate | Higher, more volatile | ~33% (as of May 2026), layered across four mechanisms |
| Policy focus | Tariff rate negotiation | Critical-minerals diplomacy, supply chain diversification |
| US imports from China | Declining | Near 2001 (pre-WTO-accession-era) levels |
| Key expiration date to watch | N/A | November 9-10, 2026 (multiple truce provisions expire) |
Why It Matters: Sector-Specific Supply Chain Exposure
The blended tariff figures conceal enormous sector variation, and that variation is where the real corporate risk-management work lies. The technology sector has been hit hardest, with tariffs on components forcing abrupt sourcing shifts and catalysing a wave of investment in domestic fabrication, though dependence on Asian supply chains remains a persistent challenge. Automakers have been compelled to redesign supply routes, absorbing some extra costs via price adjustments while facing longer lead times and increased inventory holding that strain margins. Retailers in consumer goods and apparel have explored new sourcing from Bangladesh, India, and Central America, but price volatility and inconsistent quality control remain problematic.
For investors and supply chain planners, the practical takeaway is that “US-China trade risk” is no longer a single macro variable — it is a sector-specific, product-code-specific exposure that requires granular mapping rather than a single blended-tariff assumption.
What to Do Next
- Calendar the November 9-10, 2026 expiration dates explicitly — the Affiliates Rule suspension, Section 301 exclusions, and reciprocal tariff terms are all time-limited to this window, making it the highest-probability point for renewed volatility.
- Map exposure at the HS-code level, not the country level — with some categories facing 145% effective rates while the blended average sits near 33%, country-level tariff assumptions materially understate risk for EV, battery, and solar-linked supply chains.
- Track critical-minerals diplomacy as a leading indicator of the next phase of US trade strategy — the shift from tariff brinkmanship to allied-country mineral-supply coordination signals a more durable structural approach than tariff negotiation alone.
- Monitor the Supreme Court’s IEEPA ruling’s downstream effects on the administration’s remaining tariff toolkit, since Section 301 and Section 122 authorities carry different procedural constraints than the now-invalidated IEEPA approach.
- Treat “near-2001 levels” of US-China import volume as a durable baseline, not a cyclical dip — the scale of supply chain reallocation documented by Harvard Business School research suggests this is structural rather than temporary.
FAQ
What is the current effective tariff rate on Chinese imports to the US?
The blended effective US tariff on Chinese imports stood around 33% as of May 2026, stacked across four layers — MFN, Section 301, the IEEPA fentanyl tariff, and the reciprocal tariff — though specific categories like EVs, batteries, and solar can face rates as high as 145%.
Did the Supreme Court block Trump’s China tariffs?
Partially. On February 20, 2026, the Supreme Court ruled that the President cannot use the International Emergency Economic Powers Act to impose tariffs, prompting a shift to a 10% global tariff under Section 122 of the Trade Act instead. Section 301 tariffs, which rest on separate legal authority, remain largely intact.
When does the current US-China trade truce expire?
Multiple key provisions expire around the same date. The suspension of the BIS “Affiliates Rule” runs until November 9, 2026, and the suspension of heightened tariffs on Chinese imports is set to run until November 10, 2026 — making that window the most significant near-term risk point for the relationship.
Discover more from The Economy
Subscribe to get the latest posts sent to your email.
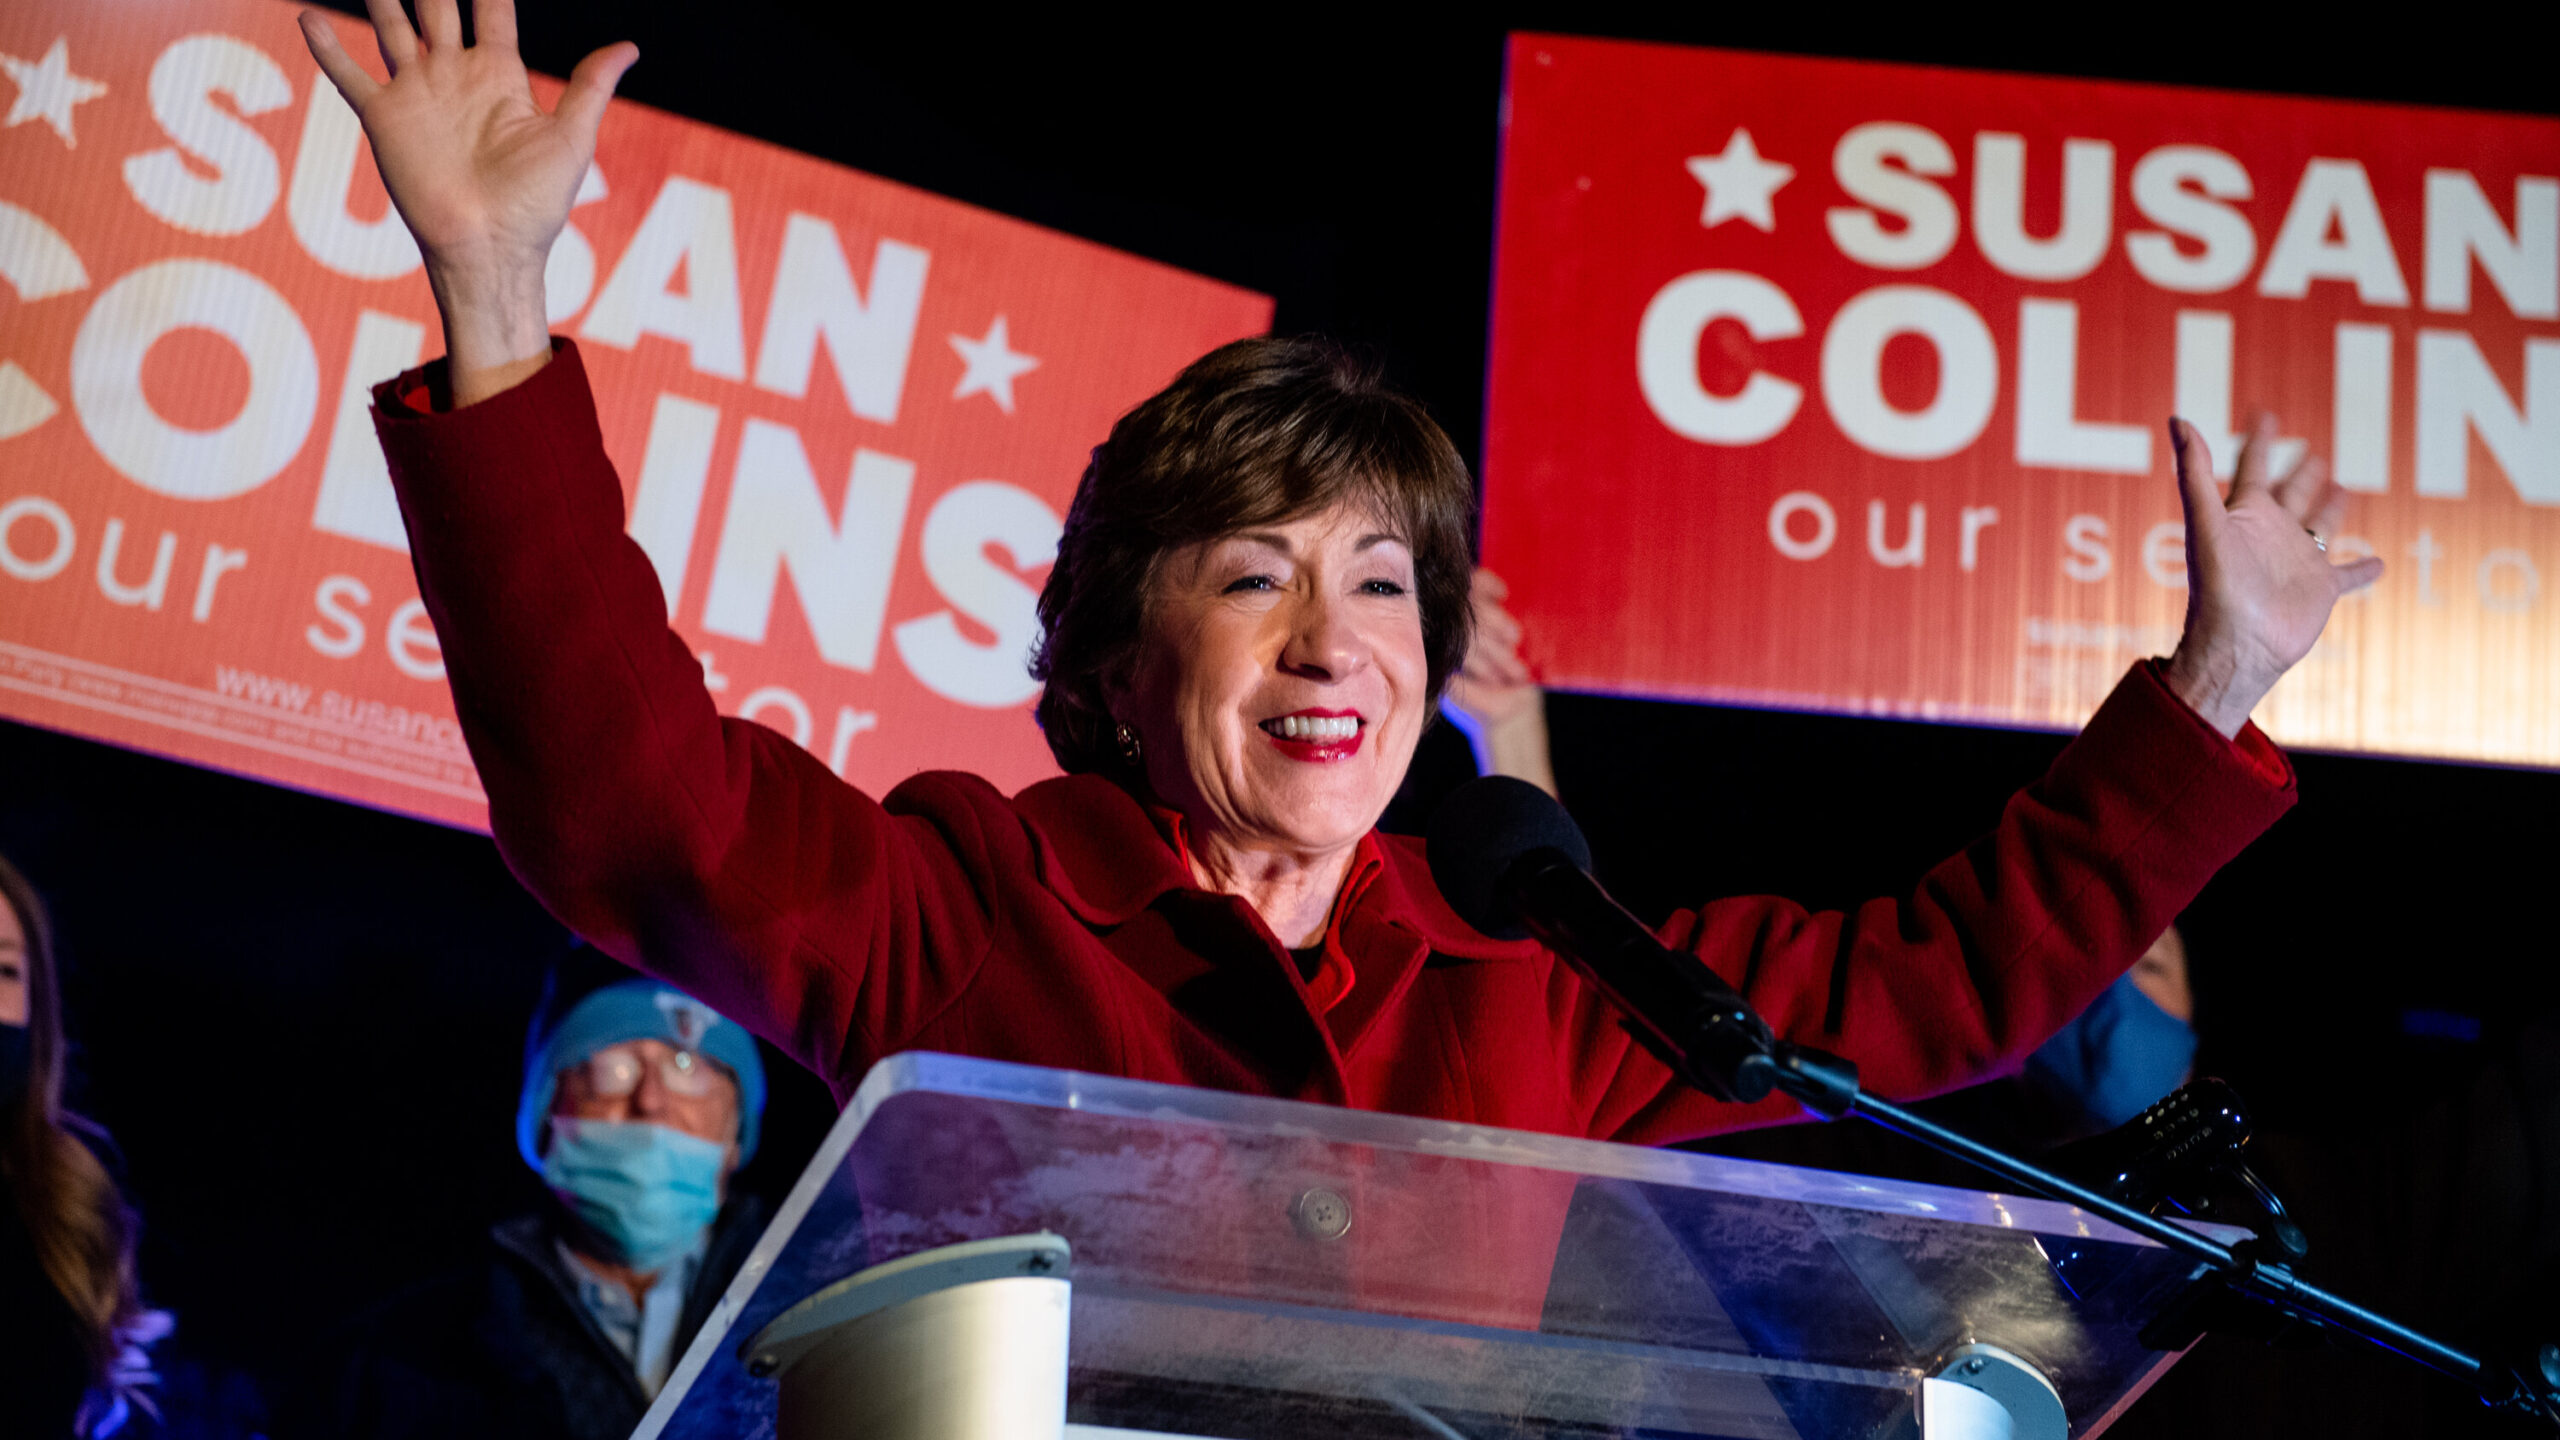
Susan Collins faces her toughest reelection yet against Troy Jackson after a chaotic Democratic candidate swap. Here’s why Maine is a genuine Senate toss-up.
Republican Sen. Susan Collins faces Democrat Troy Jackson, a former Maine Senate president, in a toss-up 2026 general election after Democrats’ original nominee, Graham Platner, was replaced through a special party nomination process. Recent polling shows Jackson with a slight edge.
For a senator who has survived six consecutive campaigns and just cast her 10,000th consecutive Senate vote, Susan Collins now faces what independent analysts are calling a genuine toss-up race — one of the clearest tests of whether Republicans can hold their Senate majority in November.
A Late, Chaotic Democratic Swap
The road to Collins’ current opponent was unusually turbulent. Maine’s Democratic field originally centered on a three-way primary between Gov. Janet Mills, oyster farmer and combat veteran Graham Platner, and former Maryland government official David Costello. Mills dropped out in April, leaving Platner as the grassroots-backed front-runner heading into the June 9 primary — a candidate whose anti-establishment profile and matched fundraising against Collins had national Democrats excited about their odds.
But Platner’s candidacy collapsed amid revelations that included past social media posts and a tattoo resembling a Nazi symbol. With the general election bearing down, the Maine Democratic Party activated an emergency special nomination process — built around county-level delegate meetings rather than a snap primary — to replace him. On July 25, that process produced Troy Jackson, a former Maine Senate president, as the party’s new standard-bearer with roughly 100 days left until Election Day.
Why the Race Is Genuinely Competitive
Despite the compressed timeline, early data suggests Jackson is not merely a placeholder candidate. A Pine Tree Poll conducted by the University of New Hampshire Survey Center showed Jackson with a three-point edge over Collins among likely general-election voters, and Fox News’ inaugural 2026 Power Rankings classify the race as a toss-up — one of roughly a dozen Senate contests that will determine which party controls the chamber.
Collins’ vulnerabilities are structural as much as political. Maine backed the Democratic presidential ticket by seven points in 2024, meaning Collins has long relied on ticket-splitting voters to survive in a state that leans against her party nationally. Democrats are also targeting her more directly than in past cycles, criticizing her comment that she doesn’t regret her 2018 vote to confirm Justice Brett Kavanaugh despite his later vote to overturn Roe v. Wade, and her continued support for Immigration and Customs Enforcement funding following a fatal shooting in Maine involving ICE agents earlier this month.
Collins, who chairs the powerful Senate Appropriations Committee, is leaning on 28 years of relationship-building with industries dependent on federal spending, along with a substantial outside-money advantage. In her campaign launch, Collins argued that “my experience, seniority and independence matter,” while Democrats have countered that “seniority without a backbone is just tenure.”
What It Means for Senate Control
Maine is one of two Senate seats Democrats are defending — or, in Collins’ case, one Republicans are defending — in a state won by the opposing party’s presidential nominee in 2024, making it a marquee Senate battleground alongside Georgia, North Carolina, and Alaska. Democrats need to net four seats nationally to reclaim the majority, and unseating Collins is widely viewed as central to that math given how few genuinely competitive Republican-held seats exist on the 2026 map.
The compressed Jackson campaign timeline is itself a variable worth watching: Collins has now defeated multiple well-funded Democratic challengers over her career, and whether Jackson can build statewide name recognition and a comparable small-dollar fundraising operation in roughly 14 weeks will likely determine whether Maine actually flips or simply stays close.
Discover more from The Economy
Subscribe to get the latest posts sent to your email.

Most headlines on Russia’s economy in July 2026 focus on the latest sanctions package or oil price cap negotiation. The more important story is structural: the model Russia has used to fund its war for four years is showing real signs of running out of road.
The core finding
A research brief from the Center for Strategic and International Studies (CSIS) argues Putin is pushing Russia toward an “economic, political, and military abyss,” according to Fortune. While Russia’s economy remains large — roughly $2.6 trillion — growth is slowing and shrinking on a quarterly basis, with 2026 growth projected at just 0.4%, worse than 2025’s 1% growth, which itself narrowly avoided recession.
Analysts describe Russia’s approach as a form of “military Keynesianism” — the state investing heavily in militarizing the economy while extending financial support to households affected by the war. But per Fortune’s reporting, “after more than four years of war, that well is running dry.” Russia’s fiscal reserves are dwindling, and 71% of the country’s gold reserves have been liquidated to sustain spending.
The number that matters most: oil and gas budget share
The most underreported data point here: the share of oil and gas receipts in Russia’s federal budget revenue fell to just 23% in 2025 — the lowest share in two decades — according to the Oxford Institute for Energy Studies, cited by Fortune. To compensate, Russia has turned to expansive taxation, including raising VAT from 20% to 22% — a move that has proven unpopular domestically.
This matters because Russia’s economy has historically been described, correctly, as fossil-fuel dependent — with oil and gas taxation making up 44% of federal revenues in the decade before the Ukraine invasion, and still around 24.5% over the first three quarters of 2025, according to a Brookings Institution analysis. A further slide to 23% signals the sanctions and diversification pressure are compounding, even as Russia continues finding workarounds through its “shadow fleet.”
The Iran-war reprieve was temporary — and it’s over
The Iran war offered Russia a brief lifeline: Brent crude surged more than 55% at its peak, nearing $120 a barrel, after President Trump eased some sanctions on Russian oil, per Fortune. But that chaos also undermined Russia’s own long-term energy and infrastructure projects in the Middle East — two Russian-linked power plants in Iran were put on hold, along with oil and gas exploration and plans to link Russia to India via Iran through new transit routes. Since then, oil prices have normalized as demand softened and the Strait of Hormuz reopened, removing that temporary cushion.
The sanctions escalation now in motion
The pressure is intensifying on multiple fronts simultaneously. US senators unveiled a sweeping bipartisan Russia sanctions bill in mid-July, which would impose mandatory sanctions on Russian political and military leaders including President Putin, and up to a 100% tariff on the top five countries — including China and India — that purchase Russian crude oil and natural gas, according to CNN. Separately, the EU has been racing to avoid an automatic upward revision of its Russian oil price cap, which would otherwise jump from $44.10 to roughly $58 per barrel if a new sanctions package wasn’t agreed by July 15, per Euronews.
Analysis from the Center for European Policy Analysis notes the outcome depends heavily on whether India and China accept the risk of secondary sanctions: “If China stands firm, Moscow’s dependence on Beijing deepens,” per CEPA. If Russian seaborne oil exports were to fall to near-zero, the budget would lose roughly a quarter of its revenue — an extreme but non-trivial scenario given the pace of legislative and diplomatic pressure building in July 2026.
Why this matters beyond Russia
For countries positioned between Western sanctions regimes and continued Russian energy purchases — including India, and by extension trade partners like Pakistan whose remittance and trade flows intersect with Gulf and South Asian energy markets — the trajectory of Russia’s budget dependency and the secondary-sanctions risk attached to its buyers is a live variable, not a settled one. A further deterioration in Russia’s oil-and-gas revenue share would likely accelerate Moscow’s reliance on China specifically, reshaping regional energy-trade alignments well beyond the Russia-Ukraine conflict itself.
FAQ
What percentage of Russia’s federal budget comes from oil and gas? 23% in 2025 — the lowest share in two decades, according to the Oxford Institute for Energy Studies.
What is Russia’s projected GDP growth for 2026? 0.4%, according to CSIS research cited by Fortune — down from 1% growth in 2025.
What is “military Keynesianism” in the context of Russia’s economy? A term analysts use to describe Russia’s strategy of heavy state investment in militarizing the economy alongside financial support for war-affected households, functioning as a form of stimulus that is now showing signs of fiscal strain.
Discover more from The Economy
Subscribe to get the latest posts sent to your email.

Balance of Payments (BOP)

The Falkland Islands Dispute: Sovereign Wealth, Offshore Drilling, and Market Impacts

Gross Domestic Product (GDP): Nominal vs. Real

What is Inflation and the Consumer Price Index (CPI)?

US-China Trade Competition 2026: Supply Chain Relocation Guide

Oil Prices Break $100 in 2026: Middle East Conflict & Energy Markets

South-South Trade Expansion: Digital Integration and Emerging Market Growth

$166B Tariff Refund Tapering Fast: Is Your Business Missing Out?

Stock Market Today: Dow Climbs 500 Points as Markets Shake Off Inflation Jitters

14th WTO Conference 2026: Tariffs & Global Supply Chain Impact

Swish Secures $24M Funding to Disrupt India’s $100B Food Market

Physical AI and Driverless Tech: The Next Trillion-Dollar Industrial Revolution

Enterprise AI Platforms Disrupting B2B SaaS in 2026: Full Analysis

Crypto vs. Safe Haven Assets 2026: Where Institutions Are Hedging

State Farm’s $5B Dividend 2026: Who Qualifies & Payout Dates

US-China Relations in Q3 2026: Trade Tariffs and Supply Chain Risks

Gold’s Wild 2026: From a Record $5,600 Peak to a 24% Crash and Back Toward $4,500

Oil Surges as Strait of Hormuz Traffic Collapses Again

The Rocket That Won’t Quit: Inside SpaceX’s Falcon 9 Launch Machine

Bank of England Set to Hold Rates Through Year-End, Reuters Poll Shows

SpaceX Starship Flight 14: First Orbital Attempt & Starlink V3 Launch Explained

The 2026 Crypto Regulatory Shift: What It Means for Institutional Investors

AI Chip Stocks 2026: The Best Semiconductor Investments Beyond Marvell

Retail Earnings Week: What Home Depot, Target & Walmart Reveal

AI-Powered Training: The Next Multi-Billion Dollar Ecosystem in Fitness

Russia’s Black Sea Oil Exports Fall for a Fifth Straight Week

Global Chip Selloff Deepens: What’s Driving the Aug. 19 Semiconductor Rout

Tween Back-to-School Trends 2026: What’s Driving the $85B Season
-

 Markets & Finance8 months ago
Top 15 Stocks for Investment in 2026 in PSX: Your Complete Guide to Pakistan’s Best Investment Opportunities
-

 Analysis7 months ago
Johor’s Investment Boom: The Hidden Costs Behind Malaysia’s Most Ambitious Economic Surge
-

 Analysis7 months ago
Top 10 Stocks for Investment in PSX for Quick Returns in 2026
-

 Analysis7 months ago
Brazil’s Rare Earth Race: US, EU, and China Compete for Critical Minerals as Tensions Rise
-

 Banks8 months ago
Best Investments in Pakistan 2026: Top 10 Low-Price Shares and Long-Term Picks for the PSX
-

 Investment8 months ago
Top 10 Mutual Fund Managers in Pakistan for Investment in 2026: A Comprehensive Guide for Optimal Returns
-

 Global Economy9 months ago
15 Most Lucrative Sectors for Investment in Pakistan: A 2025 Data-Driven Analysis
-

 Global Economy9 months ago
Pakistan’s Export Goldmine: 10 Game-Changing Markets Where Pakistani Businesses Are Winning Big in 2025