
Global Economy
Pakistan’s Stock Market Renaissance: How 2025’s Hottest Investment Opportunity Is Democratizing Wealth—A Complete Beginner’s Guide


How a frontier market’s 94% surge, IMF-backed reforms, and digital transformation are creating unprecedented opportunities for retail investors
When Saba Ahmed, a 29-year-old graphic designer from Karachi, opened her CDC account in March 2025, she joined a historic wave transforming Pakistan’s investment landscape. With just PKR 50,000 saved from freelance projects, she’s now part of a retail investor revolution that helped propel the Karachi Stock Exchange’s KSE-100 Index to an all-time high of 170,719 points in December 2025—a staggering 94% increase from the previous year.
Her story isn’t unique. From Lahore university students to Islamabad housewives, Pakistanis are discovering what institutional investors have known for months: the Pakistan Stock Exchange has become one of Asia’s best-performing markets, outpacing even regional giants. Yet beneath the record-breaking headlines lies a more profound transformation—the democratization of capital markets in a country where only 0.3% of the population owns shares.
This convergence of financial inclusion, governance reform, and geopolitical positioning offers insights extending far beyond Pakistan’s borders. For policymakers examining emerging market resilience, investors seeking frontier opportunities, and citizens demanding economic participation, the PSX experiment represents a critical test case for whether structural reform can genuinely broaden prosperity.
The Landscape: From Crisis to Confidence
The Numbers That Changed Everything
The KSE-100 Index reached an all-time high of 170,719 points, with 12-month gains exceeding 46%, positioning Pakistan among Asia’s top-performing equity markets. This isn’t hollow momentum—it’s backed by fundamentals that signal genuine transformation.
As of September 2025, PSX lists 525 companies with total market capitalization of approximately PKR 18.276 trillion (about $64.83 billion USD). More significantly, the rally is broad-based: banking, energy, cement, fertilizers, and textiles all contributing, suggesting structural confidence rather than speculative bubbles.
The transformation becomes starker in comparative context. While India’s Nifty 50 delivered respectable returns and Bangladesh struggled with political instability, Pakistan’s stock market emerged as an unexpected outperformer. The PSX Dividend 20 Index—tracking top dividend-yielding companies—gained over 40% year-to-date, offering yields substantially above regional peers.
The Geopolitical Context: Reform Under Pressure
This market renaissance didn’t occur in isolation. It emerged from Pakistan’s $7 billion Extended Fund Facility (EFF) agreement with the IMF, approved in September 2024 and supplemented by a $1.4 billion Resilience and Sustainability Facility. The program imposed painful conditionalities: fiscal primary surplus targets of 2.1% of GDP, broadened tax bases including agricultural income taxes, and energy sector reforms to eliminate circular debt exceeding PKR 4.9 trillion.
Inflation fell to a historic low of 0.3% in April, while gross reserves stood at $10.3 billion at end-April, up from $9.4 billion in August 2024, projected to reach $13.9 billion by end-June 2025. These aren’t just statistics—they’re confidence signals that convinced foreign institutional investors to return after years of capital flight.
Yet risks persist. The IMF’s second review completion in December 2025 came with warnings about policy slippages, geopolitical commodity shocks, and climate vulnerabilities. Recent flooding affected 7 million people and temporarily dampened agricultural output, highlighting Pakistan’s exposure to climate risks. The delicate balancing act between reform momentum and political sustainability will determine whether this rally has legs.
Opening the Gates: Your Step-by-Step Investment Framework
Understanding the CDC Account: The Gateway to PSX
The Central Depository Company (CDC) serves as Pakistan’s securities custodian, similar to the DTCC in the United States or NSDL in India. Your CDC account holds your shares electronically, enabling settlement through the National Clearing Company of Pakistan on a T+2 basis—a system now enhanced by digital integration with the RAAST instant payment system.
Two Account Types Serve Different Needs:
The Sahulat Account targets new investors with simplified documentation. Designed for students, housewives, and small-scale investors, it requires only your CNIC (Computerized National Identity Card) and imposes a PKR 800,000 ($2,840 USD) investment ceiling. This structure eliminates income verification barriers, lowering entry thresholds that historically excluded the majority of Pakistanis from capital markets.
The Sahulat Account gives retail investors access to regular market trading without leverage or futures restrictions, requiring minimal documentation. Once your investment exceeds the ceiling, upgrading to a standard account requires income documentation—a progressive on-ramp recognizing Pakistan’s large informal economy.
The Standard CDC Investor Account offers unrestricted access but demands comprehensive Know Your Customer (KYC) compliance: CNIC/NICOP/Passport copies, bank account verification, address proof, and for Muslims, Zakat exemption declarations. The CDC digitized this process in 2024, enabling online applications through www.cdcaccess.com.pk with mobile app support.
The Practical Process: From Application to Trading
Step 1: Broker Selection and Documentation
Pakistan has 270+ registered Trading Right Entitlement Certificate (TREC) holders—brokerage firms licensed by the Securities and Exchange Commission of Pakistan. Leading digital brokers include KTrade Securities, KASB Securities, Arif Habib Limited, and AKD Securities, each offering mobile trading platforms with varying fee structures.
Brokerage commissions typically range from 0.15% to 0.30% per trade, with annual account maintenance fees between PKR 500-2,000. Capital gains tax on shares held less than one year stands at 15%, while shares held longer face no capital gains tax—a powerful incentive for long-term investing. Dividend income incurs withholding tax of 15% for filers and 30% for non-filers, creating tax incentives for formal economy participation.
Step 2: Account Opening Timeline
Individual accounts are opened within 24 hours whereas corporate accounts take 48 hours after cheque clearance. The process has accelerated dramatically since CDC’s online system launch, eliminating the need for physical office visits in most cases.
Your Account Opening Package includes:
- Transaction Order book for physical trade instructions
- CDC Relationship Number (your unique identifier)
- Access credentials for CDC Access portal and mobile app
- Registration for SMS and email alerts on all transactions
Step 3: Funding and Trading
Investors can fund accounts through bank transfers, with CDC now integrated into Pakistan’s RAAST instant payment system for real-time settlements. The minimum investment varies by stock price—theoretically one share—but practical minimums of PKR 10,000-20,000 ($35-70 USD) provide meaningful diversification.
The Pakistan Stock Exchange operates Monday-Friday with trading sessions from 9:30 AM to 3:30 PM Pakistan Standard Time. Pre-opening sessions allow order placement before market open, while post-close sessions handle uncompleted orders. Modern mobile applications from brokers provide real-time quotes, portfolio tracking, and research tools previously available only to institutional investors.
The Cost Structure: Understanding the Economics
A typical investment of PKR 100,000 faces:
- Brokerage commission: PKR 150-300 (0.15-0.30%)
- CDC fee: PKR 10-15
- SECP regulatory fee: Nominal
- National Clearing Company charges: PKR 5-10
Round-trip transaction costs (buy and sell) total approximately 0.5-0.8% excluding tax—competitive with regional markets but higher than developed economies. These costs matter less for buy-and-hold dividend strategies than for active trading.
The Dividend Aristocrats Strategy: Where Value Meets Stability
Pakistan’s Unique Dividend Culture
The PSX Dividend 20 Index tracks the performance of the top 20 dividend paying companies, ranked and weighted based on their trailing 12-month dividend yield, rebalanced semi-annually. This index provides a ready-made screening tool for income-focused investors, something mature markets offer but many frontier markets lack.
Pakistani corporate culture favors dividend distributions more than growth-focused tech sectors, reflecting the market’s composition. Oil and gas companies, banks, cement manufacturers, and Fast-Moving Consumer Goods (FMCG) firms dominate the high-yield landscape, offering dividend yields frequently exceeding 6-10% annually—substantially above Pakistan’s current inflation rate of approximately 7-8%.
Sector Analysis: Where Dividends Flow
Banking Sector Leaders
Banks like United Bank Limited, Meezan Bank, and MCB Bank have historically provided dividend yields of 6-9%, supported by net interest margin expansion as interest rates normalized from emergency highs. The sector benefited from improved credit quality as macroeconomic stability returned, with non-performing loan ratios declining throughout 2025.
Regulatory capital requirements ensure dividend sustainability, with the State Bank of Pakistan enforcing minimum capital adequacy ratios of 11.5%. Banks that maintained strong provisions during crisis years now possess the balance sheet strength to reward shareholders while funding credit growth.
Oil & Gas Sector Stability
State-owned enterprises like Oil & Gas Development Company Limited (OGDC) and Pakistan Petroleum Limited have provided consistent dividends tied to commodity prices and production volumes. With global energy prices stabilizing and domestic gas field development continuing, these companies offer inflation hedges alongside income.
The government’s 2025 policy shift toward market-determined energy pricing—a key IMF conditionality—reduces subsidy burdens while improving profitability for producers. However, investors must monitor circular debt resolution; delayed payments to power producers historically constrained some companies’ ability to distribute cash.
Fertilizer Sector: Agricultural Dependence
Fauji Fertilizer Company and Engro Fertilizers serve Pakistan’s agricultural sector, which employs 37% of the workforce. Government subsidy reforms targeting agricultural support prices create both risks and opportunities. Reduced direct subsidies may pressure demand, while improved payment discipline by government procurement agencies strengthens receivables quality.
Climate vulnerability represents a material risk—flooding can devastate crop yields, reducing fertilizer demand. Yet Pakistan’s youthful population and food security imperatives ensure long-term agricultural investment, supporting fertilizer industry fundamentals.
The Sustainability Question: Dividend Trap Risks
A sustainable payout ratio typically under 70% ensures the company isn’t over-distributing profits. Investors should verify that dividends are supported by operational cash flow rather than debt-financed distributions—a red flag common during liquidity crises.
Compare yields against government Pakistan Investment Bonds (PIBs). When 10-year PIB yields stand at 11-12%, equity dividend yields of 8-9% must be justified by growth potential or special circumstances. Excessively high yields often signal market skepticism about dividend sustainability.
Navigating the Risks: What Could Go Wrong
Political Instability Premium
Pakistan’s political volatility remains a material risk. Frequent government changes, military influence in economic policymaking, and judicial-executive tensions create uncertainty that periodically triggers capital flight. The 2025 relative stability rests partly on broad political consensus around the IMF program—a consensus that could fracture under electoral pressures or external shocks.
Investors must accept that PSX can experience 20-30% drawdowns triggered by political events unrelated to corporate fundamentals. Historical patterns show rapid recoveries once stability returns, rewarding patient capital but punishing leveraged positions.
Currency Depreciation Reality
The Pakistani Rupee has depreciated approximately 25-30% against the US Dollar over the past five years, a trend that may continue given structural current account pressures. For domestic investors, this matters less—they earn and invest in Rupees. For foreign investors or Pakistanis earning abroad, currency risk substantially affects returns.
The State Bank of Pakistan maintains a flexible exchange rate and continues to improve the functioning of the foreign exchange market and transparency around FX operations. This policy shift from controlled rates reduces central bank intervention but increases volatility. Dollar-denominated returns may significantly lag local currency returns depending on exchange rate movements.
Liquidity Considerations
Average daily trading volume on PSX exceeds PKR 35-40 billion, concentrated in top 50 companies. Mid-cap and small-cap stocks often trade thinly, with wide bid-ask spreads and difficulty executing large orders without moving prices. The introduction of circuit breakers limiting daily price movements to 5% in either direction reduces volatility but can trap investors in illiquid positions during crises.
Foreign institutional ownership remains below 10% of market capitalization, far lower than India (22%) or Indonesia (45%). While rising foreign interest supports valuations, any reversal could pressure prices given limited domestic institutional buffers—pension funds and insurance companies remain underdeveloped compared to regional peers.
Regulatory and Governance Risks
The Securities and Exchange Commission of Pakistan has strengthened enforcement, introducing corporate governance reforms and beneficial ownership disclosure requirements throughout 2024-2025. Yet governance standards still lag international benchmarks, with related-party transactions, opaque family business structures, and limited minority shareholder protections remaining concerns.
The 2025 Governance and Corruption Diagnostic report released under IMF conditionality highlighted persistent issues in procurement transparency and state-owned enterprise governance. While reforms are underway, changing institutional cultures requires years of sustained effort. Investors should favor companies with strong independent directors, transparent reporting, and established audit relationships.
The Broader Implications: What This Means Beyond Markets
Financial Inclusion as Economic Strategy
Pakistan’s 241 million people—62% under age 30—represent an enormous untapped investor base. Individual traders are turning to equities as property prices stagnate and deposit rates have halved in the past two years, illustrating how macroeconomic shifts can democratize investing when alternatives disappoint.
Expanding retail participation addresses multiple policy goals simultaneously. It channels domestic savings toward productive investment, reducing reliance on external financing. It creates middle-class stakeholders in economic stability, building political constituencies for sustained reform. And it addresses youth unemployment by providing wealth-building alternatives to government jobs or emigration.
The challenge lies in investor protection. Unsophisticated investors entering markets during euphoric periods historically suffer losses when sentiment shifts. The SECP’s emphasis on investor education through initiatives like JamaPunji—the investor education portal—attempts to build financial literacy alongside market access. Whether these efforts sufficiently prepare retail investors for inevitable downturns remains uncertain.
The China Factor: Strategic Implications
In 2017, a consortium of Chinese exchanges including Shanghai Stock Exchange, Shenzhen Stock Exchange, and China Financial Futures Exchange acquired a 40% strategic stake in PSX, making China its single largest foreign shareholder. The “China Connect” system theoretically enables cross-border capital flows, though practical implementation has lagged ambitions.
This ownership structure carries geopolitical dimensions. As Pakistan balances its traditional security relationship with China against renewed economic engagement with Western institutions through the IMF, the stock exchange becomes a symbol of competing visions. Chinese infrastructure investment through the China-Pakistan Economic Corridor could boost listed companies’ growth prospects, while Western investors remain cautious about governance and political risks.
Regional Competitive Dynamics
Pakistan competes with Bangladesh, Sri Lanka, and frontier African markets for foreign portfolio investment. Bangladesh’s current political instability provides Pakistan a temporary advantage, while Sri Lanka’s post-default recovery creates a compelling distressed opportunity narrative. Pakistan must sustain reform momentum to differentiate itself as more than a tactical trade.
The comparison with India remains inevitable and unflattering. India’s market capitalization exceeds $4 trillion compared to Pakistan’s $65 billion—a 60:1 ratio that exceeds the countries’ economic size differential. India’s success in building institutional infrastructure, retail participation, and regulatory credibility provides both a roadmap and a competitive challenge. Pakistani policymakers increasingly study India’s National Stock Exchange transformation as a model, adapted for local context.
The Path Forward: Scenarios for the Next Five Years
The Optimistic Case: Structural Transformation
If Pakistan maintains IMF program discipline through 2027 while avoiding major political disruptions, the market could sustain 15-20% annual returns through 2030. Key drivers would include:
- Privatization Pipeline: Government plans to privatize Pakistan International Airlines, several power distribution companies, and other state-owned enterprises could unlock value while demonstrating commitment to market-oriented reforms. Successful privatizations would attract strategic investors and validate governance improvements.
- Digital Transformation: Pakistan’s IT services exports exceeded $3 billion in FY2024-25 and are growing 25% annually. If even a fraction of successful tech companies pursue PSX listings instead of overseas exits, the market could develop a genuine growth sector beyond traditional industries.
- Demographic Dividend: If macro stability persists and regulatory reforms continue, Pakistan’s youthful population could drive sustained consumption growth, benefiting listed consumer companies while expanding the retail investor base.
The Pessimistic Case: Reversal of Fortunes
Conversely, political instability, reform backsliding, or external shocks could trigger rapid capital flight. Pakistan’s vulnerability to:
- Geopolitical Tensions: Escalation with India, Afghanistan spillover effects, or positioning amid US-China competition could rapidly shift investor sentiment. Defense spending imperatives could crowd out development expenditure, slowing growth.
- Climate Catastrophes: As 2025’s flooding demonstrated, Pakistan remains highly vulnerable to climate events. A major disaster could derail fiscal targets, forcing emergency spending that conflicts with IMF conditionalities.
- Reform Fatigue: The political sustainability of IMF-mandated austerity remains questionable. Provincial resistance to agricultural income taxes, business community opposition to documentation requirements, and public frustration with subsidy removal could fracture the reform coalition.
The Most Likely Outcome: Muddling Through
Pakistan’s historical pattern suggests neither sustained excellence nor complete collapse but rather cyclical progress punctuated by periodic crises. The 2025-2026 rally likely represents genuine improvement rather than a bubble, but expecting linear progress ignores structural constraints.
Smart investors will approach PSX as a tactical allocation within diversified portfolios rather than a strategic bet. The market offers compelling risk-adjusted returns for those who understand and accept the volatility, regulatory uncertainty, and currency risks. For Pakistani citizens, participating in their economy’s growth through equity ownership represents both a financial opportunity and a civic engagement act.
Practical Recommendations: How to Proceed
For Individual Investors
Start Small, Learn First: Open a Sahulat Account with minimal capital to understand market mechanics before committing substantial savings. Use the first six months as an education period, tracking your picks without emotional attachment.
Focus on Dividend Aristocrats: Top dividend paying sectors on PSX include banking, energy and fertilizers. Build a portfolio of 6-8 established dividend payers rather than chasing speculative growth. Reinvest dividends to compound returns.
Maintain Realistic Expectations: Budget for 30% drawdowns as normal market corrections. Only invest capital you won’t need for 3-5 years. Consider PSX as 10-20% of total savings, not your entire nest egg.
Stay Informed: Subscribe to PSX announcements through the official data portal. Follow quarterly results for your holdings. Understand that in Pakistan, management quality and political connections often matter more than financial ratios suggest.
For Foreign Investors
Understand Repatriation Rules: Pakistan maintains some capital control vestiges despite liberalization. While foreign portfolio investors can generally repatriate proceeds, sudden policy reversals during crises have occurred historically. Size positions accordingly.
Consider Fund Routes: Emerging market funds or Pakistan-focused funds provide professional management, local expertise, and reduced administrative burden compared to direct investing. Several international fund managers now include Pakistan in frontier market allocations.
Monitor Geopolitics: Political risk isn’t diversifiable in Pakistan—a military coup, India-Pakistan crisis, or IMF program collapse would affect all holdings simultaneously. Maintain hedges or view Pakistan as a small, speculative allocation.
For Policymakers and Regulators
Accelerate Institutional Development: Strengthen pension funds, insurance companies, and mutual funds to provide domestic institutional ballast. Currently, foreign investors and retail traders drive volatility; strong local institutions provide stability.
Enhance Transparency: Mandate beneficial ownership disclosure, strengthen auditor liability, and enforce insider trading penalties rigorously. Governance credibility determines whether Pakistan attracts long-term capital or remains a tactical trade.
Build Financial Literacy: Expand investor education beyond cities. Partner with universities, civil society organizations, and religious institutions to reach populations traditionally excluded from financial systems.
Conclusion: Democracy of Capital in Action
When Saba Ahmed checked her CDC mobile app in December 2025 and saw her modest portfolio up 35% in nine months, she joined millions of Pakistanis experiencing a rare moment—when government policy, market forces, and individual agency aligned to create genuine opportunity.
The Pakistan Stock Exchange’s 2025 renaissance isn’t merely a financial phenomenon. It represents a test of whether structural reform can broaden prosperity beyond elites, whether digital infrastructure can overcome historical exclusion, and whether a frontier market can sustain momentum against formidable headwinds.
Analysts forecast the KSE-100 Index could reach 170,000 points if macroeconomic stability and reform progress continue—a target already achieved, prompting revised estimates above 180,000 for 2026. Yet the more important question isn’t whether markets rally further, but whether this rally reflects and reinforces genuine economic transformation.
For the global community, Pakistan’s experiment offers lessons about IMF program design, financial inclusion strategies, and the political economy of reform. For investors, it presents a high-risk, high-reward opportunity in one of the world’s last major frontier markets. For Pakistanis, it offers something more fundamental—a stake in their nation’s future.
The democratization of capital is never smooth. Markets will correct, disappointments will occur, and risks will materialize. But the principle that ordinary citizens should participate in economic growth, not merely observe it from afar, represents a worthy aspiration. Whether Pakistan’s stock market revolution delivers on that promise will define more than investment returns—it will help shape a nation’s trajectory.
DISCLAIMER: This analysis is for informational and educational purposes only and should not be construed as investment advice. All investments carry risk, including potential loss of principal. Pakistan’s market involves heightened political, currency, and liquidity risks. Readers should conduct their own due diligence and consult qualified financial advisors before making investment decisions. The author has no financial interest in Pakistani securities or companies mentioned.
SOURCES & CITATIONS:
- Pakistan Stock Exchange Official Data Portal (dps.psx.com.pk)
- Central Depository Company of Pakistan (cdcpakistan.com)
- International Monetary Fund Country Reports and Press Releases (2024-2025)
- Securities and Exchange Commission of Pakistan (secp.gov.pk)
- Trading Economics Pakistan Indicators
- Bloomberg, Reuters market data
- Pakistan Bureau of Statistics
- World Bank Pakistan Development Updates
Discover more from The Economy
Subscribe to get the latest posts sent to your email.


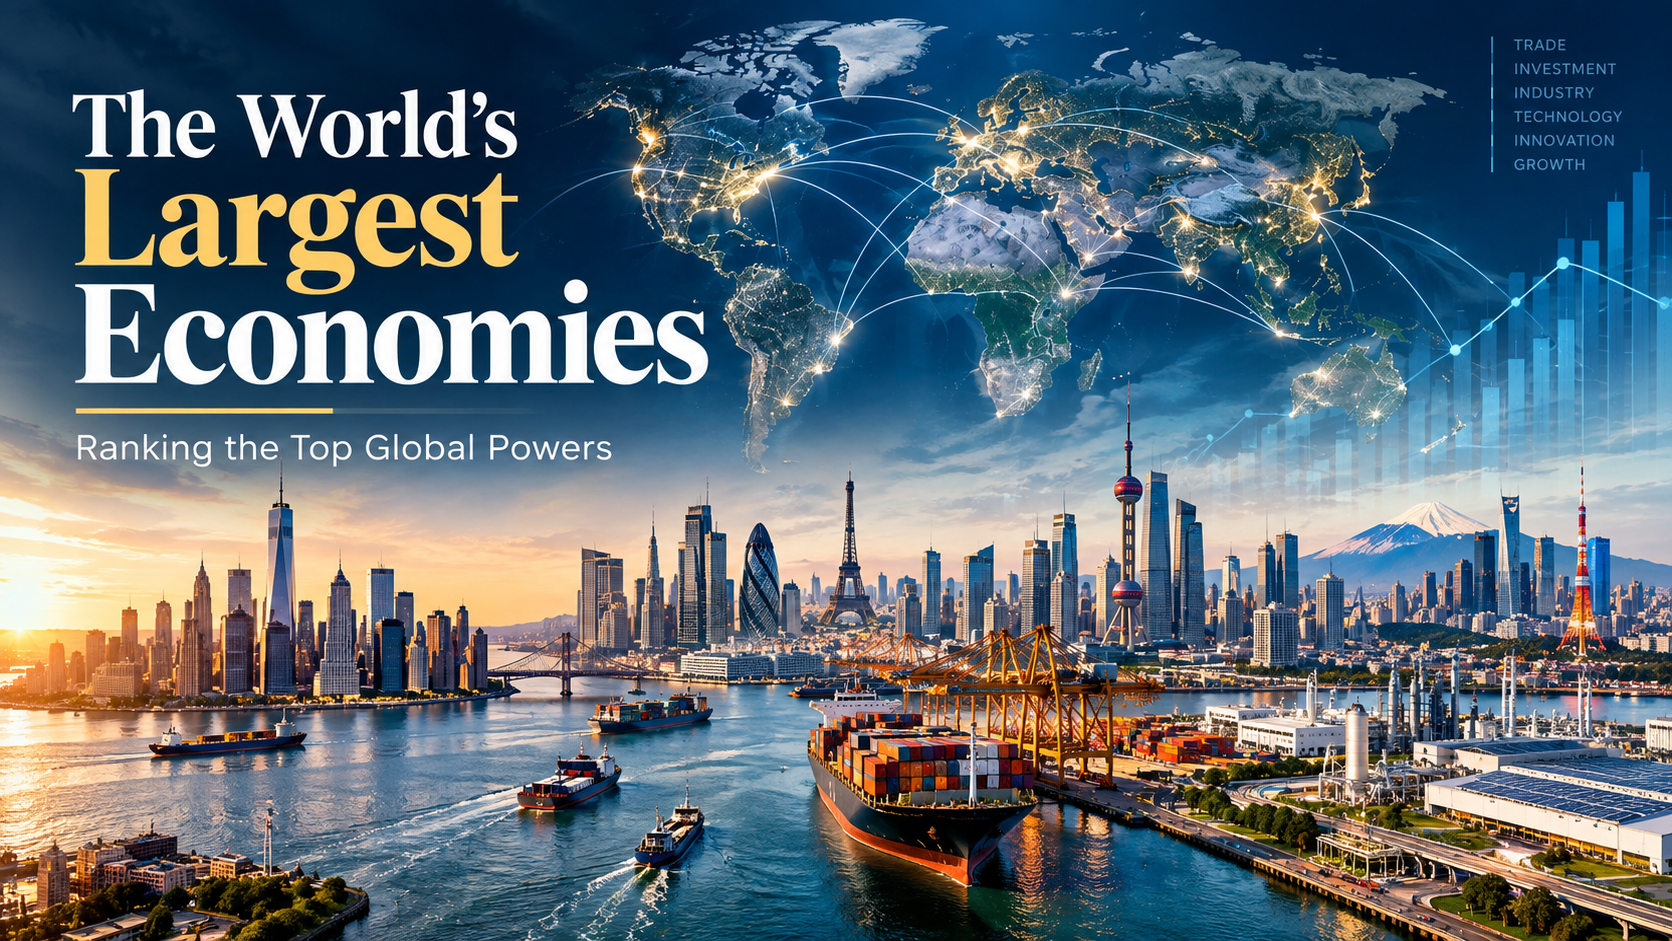
Executive Summary & Key Takeaways
The global macroeconomic landscape is defined by monetary policy shifts, technological supply chain realignments, and shifting demographic dynamics. According to official economic monitoring by the International Monetary Fund (IMF World Economic Outlook) and the World Bank Group, global GDP exceeds $125 trillion in nominal terms.
- Top Position: The United States maintains its position as the largest nominal economy at $32.38 trillion, driven by tech innovation, resilient consumer demand, and deep capital markets, as highlighted by the U.S. Bureau of Economic Analysis.
- PPP Leader: China dominates Purchasing Power Parity (PPP) with an output of $44.30 trillion, reflecting its massive industrial capacity and domestic consumption scale.
- European Dynamics: Germany holds the 3rd spot nominally ($5.45 trillion), navigating energy transitions and industrial re-tooling ahead of Japan ($4.38 trillion).
- Emerging Growth Engines: India leads among major emerging markets with real GDP growth expanding above 6.4%, positioning it to challenge top-tier positions over the coming decade.
Global GDP Ranking Matrix: Top 10 Economies
Below is a comparative breakdown of the top 10 economies, combining Nominal GDP, PPP GDP, Nominal GDP Per Capita, and Real GDP Growth Rates aggregated from primary statistical repositories including Eurostat and the Federal Reserve Economic Data (FRED).
| Rank | Country | Nominal GDP (USD)∣PPPGDP(Int.) | Nominal GDP Per Capita | Real Growth Rate (%) | Key Dominant Sector |
| 1 | United States | $32.38 Trillion | $32.38 Trillion | $94,430 | 2.32% |
| 2 | China | $20.85 Trillion | $44.30 Trillion | $14,874 | 4.41% |
| 3 | Germany | $5.45 Trillion | $6.41 Trillion | $65,303 | 0.79% |
| 4 | Japan | $4.38 Trillion | $7.26 Trillion | $35,703 | 0.72% |
| 5 | United Kingdom | $4.26 Trillion | $4.72 Trillion | $61,056 | 0.80% |
| 6 | India | $4.15 Trillion | $18.90 Trillion | $2,813 | 6.48% |
| 7 | France | $3.60 Trillion | $4.73 Trillion | $52,083 | 0.86% |
| 8 | Italy | $2.74 Trillion | $3.87 Trillion | $46,505 | 0.52% |
| 9 | Russia | $2.66 Trillion | $7.53 Trillion | $18,525 | 1.09% |
| 10 | Brazil | $2.64 Trillion | $5.23 Trillion | $12,313 | 1.91% |
In-Depth Profile of the Top 10 Economies
1. United States
- Nominal GDP: $32.38 Trillion | PPP GDP: $32.38 Trillion | Per Capita: $94,430
- Growth Rate: 2.32%
- Economic Analysis: The U.S. economy remains the world’s chief financial powerhouse. Its growth is underpinned by flexible labor markets, dominant technology giants, and capital allocation mechanisms tracked by the Federal Reserve System. The nation’s strength in artificial intelligence, software infrastructure, biotechnology, and energy self-sufficiency shields it against foreign supply chokepoints.
- Macro Risk: High national debt levels and elevated interest rates aimed at controlling service-sector inflation.
2. China
- Nominal GDP: $20.85 Trillion | PPP GDP: $44.30 Trillion | Per Capita: $14,874
- Growth Rate: 4.41%
- Economic Analysis: China is the world’s industrial foundation and the largest economy measured by Purchasing Power Parity. According to global trade documentation from UNCTAD, China leads in global manufacturing export volumes, electric vehicle supply chains, solar tech, and rare earth processing.
- Macro Risk: Real estate market structural adjustments, local government debt debt-servicing burdens, and demographic headwinds from an aging workforce.
3. Germany
- Nominal GDP: $5.45 Trillion | PPP GDP: $6.41 Trillion | Per Capita: $65,303
- Growth Rate: 0.79%
- Economic Analysis: Germany serves as the industrial core of the European Union. Supported by a specialized network of medium-sized industrial leaders (Mittelstand), Germany excels in high-precision engineering, chemical processing, and industrial machinery.
- Macro Risk: Transitioning away from historically cheap pipeline gas toward green hydrogen/renewable infrastructure, combined with structural labor shortages.
4. Japan
- Nominal GDP: $4.38 Trillion | PPP GDP: $7.26 Trillion | Per Capita: $35,703
- Growth Rate: 0.72%
- Economic Analysis: Known for technological innovation and precision manufacturing, Japan benefits from high foreign assets, advanced robotics, and heavy domestic research investment. Trade flows published by the OECD iLibrary highlight Japan’s high value-add manufacturing integration across Asia and the Americas.
- Macro Risk: Persistent demographic contraction and high public debt-to-GDP ratios managed by the Bank of Japan.
5. United Kingdom
- Nominal GDP: $4.26 Trillion | PPP GDP: $4.72 Trillion | Per Capita: $61,056
- Growth Rate: 0.80%
- Economic Analysis: The UK relies heavily on services, which account for roughly 80% of total economic output. London remains one of the world’s premier financial centers, excelling in asset management, insurance, cross-border fintech, and legal services.
- Macro Risk: Supply-chain re-anchoring post-Brexit and sluggish domestic capital investment rates.
6. India
- Nominal GDP: $4.15 Trillion | PPP GDP: $18.90 Trillion | Per Capita: $2,813
- Growth Rate: 6.48%
- Economic Analysis: India is the world’s fastest-growing major economy. Driven by rapid digital public infrastructure expansion, nationwide transport investments, and expanding manufacturing under global supply chain diversification strategies (“China + 1”), India is rapidly scaling up both domestic consumption and industrial exports.
- Macro Risk: Job creation for a massive young workforce and infrastructure expansion bottlenecks.
7. France
- Nominal GDP: $3.60 Trillion | PPP GDP: $4.73 Trillion | Per Capita: $52,083
- Growth Rate: 0.86%
- Economic Analysis: France operates a diversified economy featuring strong tourism, aerospace (Airbus), luxury consumer conglomerates (LVMH, Kering), and nuclear energy generation. Its low-carbon electricity grid provides cost-stability advantages over neighboring industrial markets.
- Macro Risk: Public deficit management and rigid labor market structural adjustments.
8. Italy
- Nominal GDP: $2.74 Trillion | PPP GDP: $3.87 Trillion | Per Capita: $46,505
- Growth Rate: 0.52%
- Economic Analysis: Italy’s economy relies on an export-oriented manufacturing base in its northern regions, specializing in luxury automobiles, industrial automation, pharmaceutical production, and high-end textiles.
- Macro Risk: Public sector debt servicing and structural regional economic disparities between North and South.
9. Russia
- Nominal GDP: $2.66 Trillion | PPP GDP: $7.53 Trillion | Per Capita: $18,525
- Growth Rate: 1.09%
- Economic Analysis: Russia’s economy is anchored by natural resources, defense-industrial state expenditures, and energy commodity exports to non-Western trading partners across Eurasia and Africa.
- Macro Risk: International financial restrictions, currency volatility, and sanctions-driven technology supply constraints.
10. Brazil
- Nominal GDP: $2.64 Trillion | PPP GDP: $5.23 Trillion | Per Capita: $12,313
- Growth Rate: 1.91%
- Economic Analysis: Brazil dominates Latin America’s economic landscape, propelled by agricultural exports (soybeans, beef, sugar), iron ore extraction via Vale, deepwater oil exploration, and a sophisticated fintech banking sector.
- Macro Risk: Fiscal deficit volatility and vulnerability to global commodity price cycles.
Methodology: How Economic Output is Measured
Evaluating economic scale requires understanding three primary economic indicators:
                  ┌────────────────────────────────────────────────┐
                  │          Gross Domestic Product (GDP)          │
                  └───────────────────────┬────────────────────────┘
                                          │
            ┌─────────────────────────────┼─────────────────────────────┐
            ▼                             ▼                             ▼
┌───────────────────────┐     ┌───────────────────────┐     ┌───────────────────────┐
│     Nominal GDP       │     │        PPP GDP        │     │    GDP Per Capita     │
├───────────────────────┤     ├───────────────────────┤     ├───────────────────────┤
│ Expressed in current  │     │ Adjusted for local    │     │ Total output divided  │
│ USD exchange rates.   │     │ purchasing power.     │     │ by population.        │
│ Identifies global     │     │ Reflects internal     │     │ Measures average      │
│ capital power.        │     │ economic scale.       │     │ living standard.      │
└───────────────────────┘     └───────────────────────┘     └───────────────────────┘
- Nominal GDP (Current Prices in USD): Measures the market value of all final goods and services produced within a country in a given year. Nominal values convert domestic output using prevailing market exchange rates. While ideal for assessing international purchasing power, it fluctuates with currency market swings.
- Purchasing Power Parity (PPP): Adjusts for relative price levels and local living costs using an international basket of goods. According to data methodology guides from the Bank for International Settlements (BIS), PPP offers a realistic view of domestic production capability and domestic consumer capacity.
- GDP Per Capita: Divides total economic output by total population. This distinguishes between sheer economic scale (e.g., India or China) and individual living standards (e.g., Switzerland, Luxembourg, or the United States).
Key Takeaways for Global Economic Trends
- The Shift Toward Multipolar Growth: Asia’s expanding market share—led by China, India, Indonesia, and Vietnam—continues to outpace global growth averages, shifting the center of gravity of manufacturing and consumption.
- Energy Transition Dynamics: Nations with sovereign clean tech supply chains (China) or independent nuclear grids (France) gain structural cost advantages over those dependent on imported fossil fuels.
- Demographics vs. Productivity: Aging populations across Europe and East Asia mean future expansion depends heavily on capital deployment into automation, AI infrastructure, and high-margin service exports.
Discover more from The Economy
Subscribe to get the latest posts sent to your email.
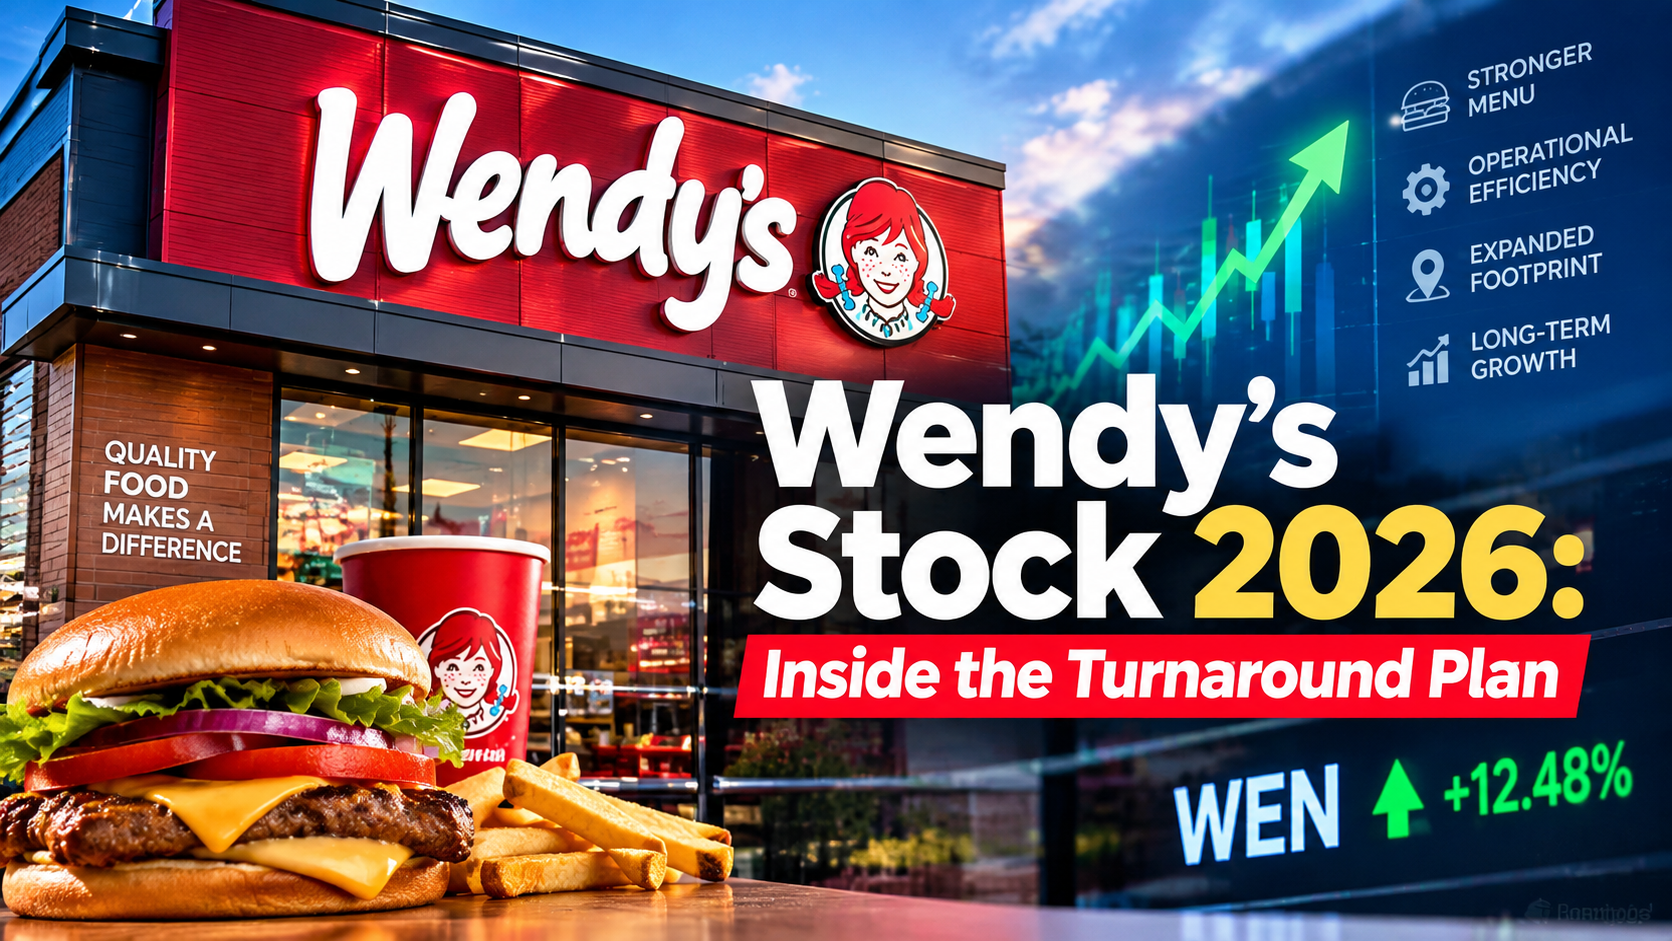
Why did Wendy’s stock fall in 2026? The Wendy’s Company withdrew its full-year 2026 financial outlook and cut its dividend to help fund a turnaround effort after reporting second-quarter results showing global systemwide sales down 6.5% year-over-year, according to the company’s official second-quarter earnings release. The decline was driven by an 8.2% drop in U.S. sales, only partially offset by 3.4% growth internationally — a split that has defined the company’s story for most of the year.
New leadership has been blunt about the scale of the problem. President and CEO Bob Wright, who returned to the company to lead the turnaround, said directly that traffic, the brand’s value proposition, and franchisee economics were not meeting expectations, while outlining five specific areas of focus: rebuilding a quality menu at compelling value, marketing that drives demand, operational excellence, a stronger digital experience, and turning restaurants themselves into a growth engine.
The Numbers Behind the Turnaround
Featured Snippet Target: Wendy’s Q2 2026 results showed revenue of $571 million, net income of $32.6 million, and adjusted EBITDA of $124.1 million, but global systemwide sales fell 6.5% year-over-year — driven primarily by an 8.2% U.S. sales decline — prompting the company to withdraw its full-year guidance and cut its dividend.
The pressure had been building for several quarters before the Q2 announcement. In the first quarter of 2026, Wendy’s reported revenue of $541 million (up 3.3% year-over-year) but adjusted earnings per share of just $0.12 — down 40% from $0.20 in the same quarter of 2025 — as global systemwide sales fell 5.5% on a constant-currency basis, driven by a 7.8% drop in U.S. same-restaurant sales, according to financial analysis from TIKR. Management attributed part of that decline to severe winter weather in January and February, alongside intentional operating-hour reductions tied to the company’s store-footprint optimization initiative, known internally as Project Fresh.
International growth has been the one consistent bright spot. Wendy’s international business delivered 6% systemwide sales growth in the first quarter, powered by new restaurant development in the Philippines and Mexico — a pattern that continued into the second quarter, when international sales grew 3.4% even as the U.S. business contracted sharply.
Is Project Fresh Actually Working?
Company-operated restaurants that have fully implemented the Project Fresh operational playbook outperformed the broader U.S. system by 310 basis points in same-restaurant sales during the first quarter, according to comments from Interim CEO and CFO Ken Cook on the Q1 earnings call — an early data point management has pointed to as evidence the turnaround approach works where it has actually been rolled out. On the subsequent Q4 earnings call, Cook told analysts that October marked the low point for the business, with sequential improvement through late 2025 and early 2026, before adverse January weather disrupted that recovery trend, according to call notes compiled by StockStory.
The restructuring has a real physical footprint: roughly 5% to 6% of U.S. Wendy’s locations are set to close, with most of those closures concentrated in the first half of 2026 — building on 240 U.S. location closures the chain had already carried out the prior year, according to reporting picked up by Fast Company. Franchisee buy-in has been a recurring analyst question on earnings calls, with Cook emphasizing frequent communication and flexibility as franchisees weigh whether the new operational playbook genuinely improves their unit economics.
What Wall Street Thinks
Analyst sentiment on Wendy’s stock has remained genuinely split rather than converging on a clear verdict. Coverage compiled by Barchart noted that the stock trades at roughly 12 times current-year earnings and under eight times 2030 forecasts — a valuation implying significant potential upside if the turnaround succeeds — but also flagged that the number of analysts covering the stock rose 30% in the first quarter of 2026 alone, with the resulting consensus landing on a “Hold” rating and a roughly even split between Buy and Sell recommendations. That’s an unusually wide disagreement for a large-cap consumer stock, reflecting genuine uncertainty about whether management’s turnaround playbook can offset structural share losses to competitors such as McDonald’s.
Rising beef costs added a separate layer of margin pressure through the first half of the year. Wendy’s Chief Accounting Officer and Global Head of FP&A Suzanne Thuerk indicated commodity inflation would run in the high single digits during the first half of 2026 due to double-digit beef inflation, before moderating to a low single-digit pace in the back half of the year as the company began cycling past the prior year’s elevated beef costs.
The Bottom Line
Wendy’s 2026 story is a genuine turnaround-in-progress rather than a settled outcome in either direction. The company has been transparent about the scale of its U.S. traffic and value-proposition problems, has a specific operational framework (Project Fresh) with early data suggesting it improves results where implemented, and has an international business that continues to grow steadily even as the U.S. core contracts. But the dividend cut, withdrawn guidance, and split analyst sentiment all signal that management itself is not yet confident enough in the pace of recovery to make firm forward commitments.
Next step: Investors and franchise-industry watchers should track same-restaurant sales trends specifically at fully-converted Project Fresh locations in upcoming quarters — that cohort, more than the blended company-wide average, is the clearest read on whether the turnaround strategy itself is working.
Discover more from The Economy
Subscribe to get the latest posts sent to your email.
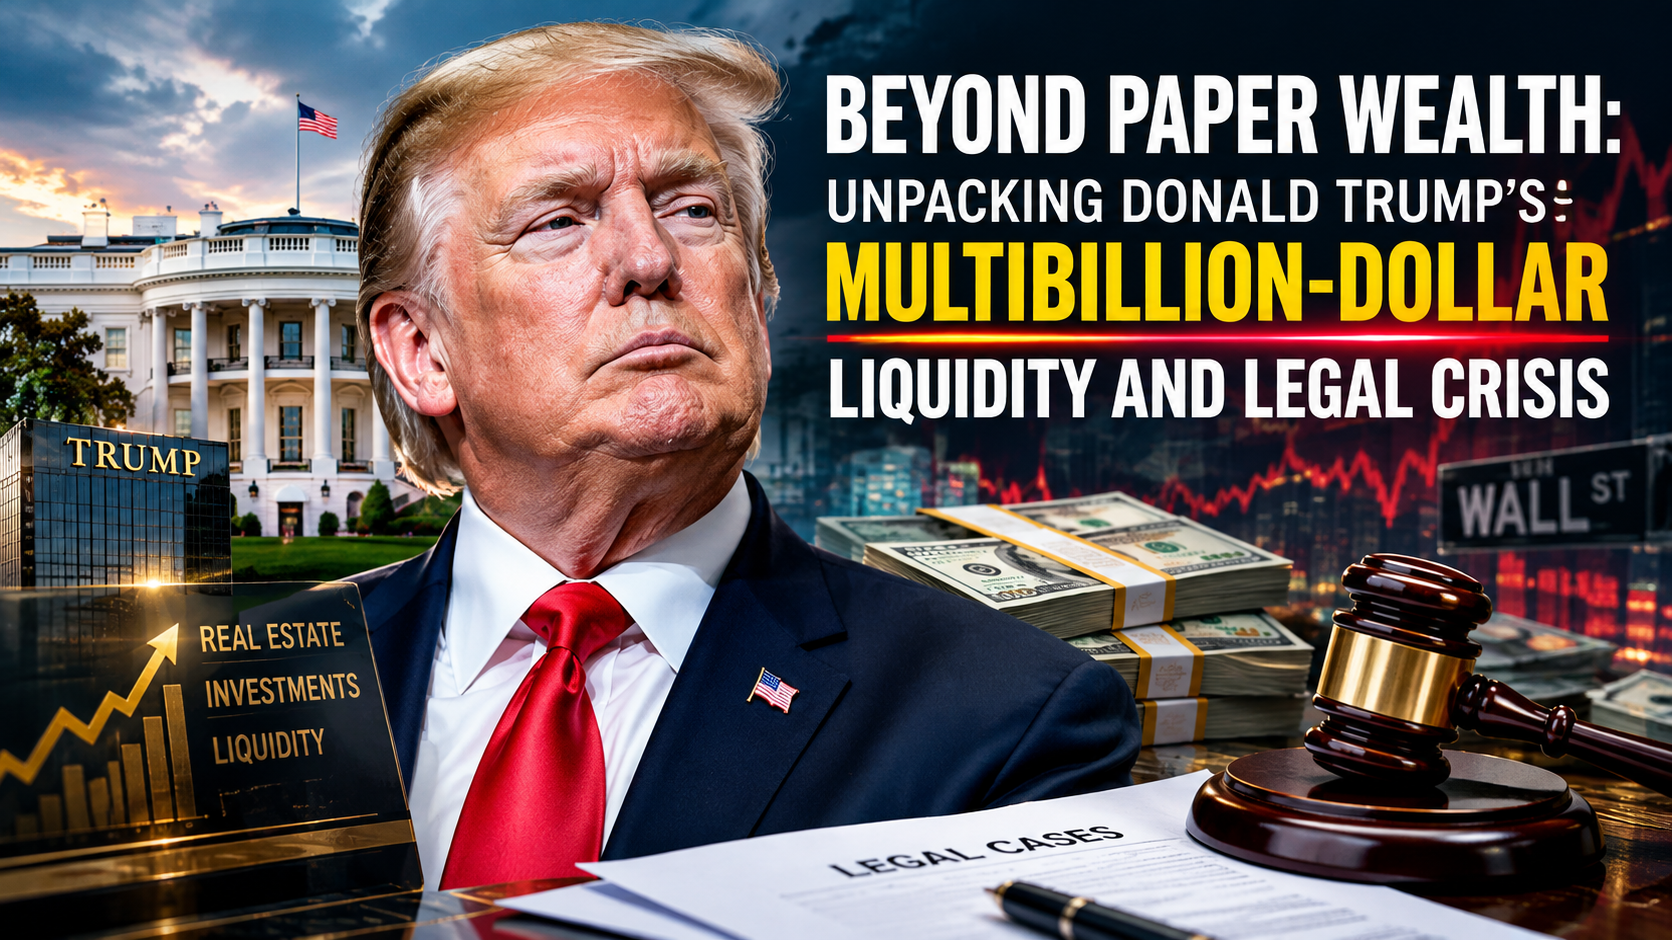
Former President Donald Trump’s financial balance sheet is undergoing unprecedented pressure. While his estimated net worth fluctuated dramatically following the public listing of Trump Media & Technology Group (TMTG), his real-world liquidity faces severe headwinds from court-ordered judgments, mounting interest, commercial real estate debt maturities, and escalating legal fees.
Understanding the magnitude of Trump’s financial landscape requires separating volatile paper equity from available cash, real estate assets, and legal liabilities.
1. The $454 Million Civil Fraud Judgment and Appeal Bond Dynamics
The largest immediate financial threat stems from New York State Supreme Court Judge Arthur Engoron’s ruling in the civil fraud lawsuit brought by New York Attorney General Letitia James.
- Initial Ruling: Trump was found liable for systematically inflating asset values to secure favorable loan terms and insurance rates.
- Financial Penalty: The court ordered disgorgement of approximately $354 million in ill-gotten gains, plus pre-judgment interest that pushed the initial obligation past $454 million.
- Accruing Interest: Statutory post-judgment interest accrues at 9% per annum (roughly $112,000 per day), steadily increasing the total debt while appeals proceed.
According to legal reporting from [Reuters], securing an appeal bond proved exceptionally difficult. Over 30 surety companies rejected Trump’s requests to guarantee the full amount without liquid collateral, as insurers overwhelmingly refuse to accept real estate as bond backing. An appellate bench subsequently allowed a reduced bond of $175 million, which Trump posted via Knight Specialty Insurance Company to stay enforcement while the appellate division reviews the merit of the ruling.
2. E. Jean Carroll Defamation Verdicts: $88.3 Million in Liability
In addition to state-level regulatory judgments, federal jury decisions in New York have created substantial financial commitments:
| Case | Jury Award | Status / Collateral Mechanism |
| Carroll I (Sexual Abuse & Defamation) | $5.0 Million | Placed in court-monitored escrow during appeal. |
| Carroll II (Defamation) | $83.3 Million | Secured via an $91.6 million appeal bond posted through Federal Insurance Co. (Chubb). |
As detailed by [CNBC], these judgments require collateralization regardless of ongoing appeals. Trump was forced to lock up cash or liquid securities to secure these bonds, directly contracting his available operational liquid reserves.
3. Trump Media (DJT): Paper Billions vs. Realizable Cash
The public debut of Trump Media & Technology Group Corp. (NASDAQ: DJT) via a SPAC merger briefly added billions to Trump’s paper net worth. However, financial analysts at [Forbes] note that transforming paper valuation into usable cash presents critical structural obstacles:
- Fundamental Disconnect: TMTG’s multi-billion-dollar valuation stands in stark contrast to its underlying balance sheet, which showed modest revenues against notable operational expenses.
- Market Impact of Cashing Out: Trump owns roughly 57% to 60% of the company. Any large-scale liquidation of his shares to cover cash liabilities risks signaling a loss of confidence, potentially triggering a sharp price decline before significant volume can be sold.
- Lock-Up Agreement Expirations: While lock-up restrictions initially prevented insider selling, the expiration of these periods subjects the stock to heightened market volatility and short-selling pressure.
4. Commercial Real Estate Exposure & Refinancing Headwinds
A substantial portion of Trump’s traditional wealth remains tied up in commercial real estate—a sector currently suffering from high interest rates, declining office occupancies, and tightened banking credit standards.
Trump Asset Portfolio Exposure
├── Commercial Properties (High debt exposure / Refinancing risk)
│   ├── 40 Wall Street (NYC)
│   └── Trump Tower Commercial Space (NYC)
├── Golf Courses & Resorts (Stable cash flow / High capital expenditure)
└── Brand Licensing & Cash Equivalents (Encumbered by legal escrow/bonds)
Key commercial debt obligations reported by [The Wall Street Journal] highlight specific vulnerabilities:
- 40 Wall Street (New York): The property’s debt was placed on lender watchlists in recent years due to rising vacancy rates, falling net operating income (NOI), and elevated ground-lease costs.
- Refinancing Risks: With commercial mortgage-backed securities (CMBS) debt maturing across several properties, refinancing in a high-rate environment significantly increases debt service payments, squeezing operational margins.
5. Political Action Committee (PAC) Legal Expense Drain
Legal fees have consumed a massive share of Trump’s available political fundraising funds. As documented by [The New York Times], Donald Trump’s leadership PAC, Save America, has spent tens of millions of dollars funding legal defense fees for the former president and co-defendants across multiple jurisdictions.
This drain on donor funds creates a dual liability:
- It diverts resources away from political field operations and advertising.
- It exposes the campaign structure to ongoing cash demands as criminal and civil proceedings drag on.
Financial Outlook & Solvency Risks
Trump’s asset portfolio is characterized by a strong imbalance between illiquid real estate equity and immediate cash demands.
Total Cash Demands (Judgments + Bonds Posted) : ~$260M+ Cash Restricted/Encumbered
Pending Liabilities (If Appeals Fail)        : ~$540M+ Total Direct Civil Cash Penalties
While Trump’s overall asset base—including golf courses, residential property, and brand licensing—remains valuable, his immediate solvency depends heavily on appellate court decisions. Should the appellate courts uphold the full civil fraud judgment without reduction, the need for immediate cash could force distressed asset sales or high-cost private equity financing, fundamentally altering the Trump Organization’s financial baseline.
Discover more from The Economy
Subscribe to get the latest posts sent to your email.

Solar Panel Installation Cost in 2026: Why the Math Changed Overnight

Business Insurance: What Coverage You Actually Need and What It Costs in 2026

Auto Insurance Quotes: How to Get the Lowest Rate Without Losing Coverage

Huntington Online Banking: Full Features, Fees, and How It Compares in 2026

Apply for a Bank Account Online: What You Need and How Long It Actually Takes

World’s Largest Economies: Ranking the Top Global Powers

Business Loan: A Complete 2026 Guide to Rates, Types, and Qualifying

Fast Invoice Factoring: How to Turn Unpaid Invoices Into Cash Within 24 Hours

Investment Banking Services: What They Cost and How to Choose the Right Firm in 2026

Structured Settlement Loan: What “Cash Now” Offers Actually Cost You

DUI Attorney: Why Your First Call After an Arrest Should Never Be to the Court

Personal Injury Lawyer: A Complete Guide to Filing Your Claim in 2026

Commercial Vehicle Accident Lawyer: Holding Companies Accountable Beyond the Driver

Inside the White House Feud: How Trump’s Allies Are Painting Anthropic’s Dario Amodei as the Face of ‘AI Doomerism’

Top 30 Stocks for Investment in PSX for Massive ROI in 2026

SpaceX Starship Flight 14: First Orbital Attempt & Starlink V3 Launch Explained

Oil Prices Break $100 in 2026: Middle East Conflict & Energy Markets

AI Chip Stocks 2026: The Best Semiconductor Investments Beyond Marvell

Fidelity Investments Review 2026: SPAXX Yields & Zero-Fee Funds

BRICS+ Cross-Border Payments 2026: Interoperability Explained

Tween Back-to-School Trends 2026: What’s Driving the $85B Season

10-Year Treasury Yield Hits 4.80%: What It Means for Rates & Portfolios

Shein Clothes Quality & Safety in 2026: What Lab Tests Show

China’s US$10.8 Billion Trade Shortcut: Why the Pinglu Canal Matters

MRVL Earnings 2026: Why Marvell Sank Despite Beating Estimates

IMF & World Bank 2026 Global Economic Outlook: Growth, Inflation, Debt

High-CPM Finance Niches 2026: Publisher Monetization Blueprint

Middle East War Economics 2026: Oil Prices & Energy Markets
-

 Markets & Finance9 months ago
Top 15 Stocks for Investment in 2026 in PSX: Your Complete Guide to Pakistan’s Best Investment Opportunities
-

 Analysis7 months ago
Johor’s Investment Boom: The Hidden Costs Behind Malaysia’s Most Ambitious Economic Surge
-

 Analysis7 months ago
Top 10 Stocks for Investment in PSX for Quick Returns in 2026
-

 Banks8 months ago
Best Investments in Pakistan 2026: Top 10 Low-Price Shares and Long-Term Picks for the PSX
-

 Analysis8 months ago
Brazil’s Rare Earth Race: US, EU, and China Compete for Critical Minerals as Tensions Rise
-

 Investment9 months ago
Top 10 Mutual Fund Managers in Pakistan for Investment in 2026: A Comprehensive Guide for Optimal Returns
-

 Global Economy9 months ago
15 Most Lucrative Sectors for Investment in Pakistan: A 2025 Data-Driven Analysis
-

 Global Economy9 months ago
Pakistan’s Export Goldmine: 10 Game-Changing Markets Where Pakistani Businesses Are Winning Big in 2025