
Analysis
America’s AI Engine Meets the China Fault Line: Can Growth Outrun Geopolitics in 2026?

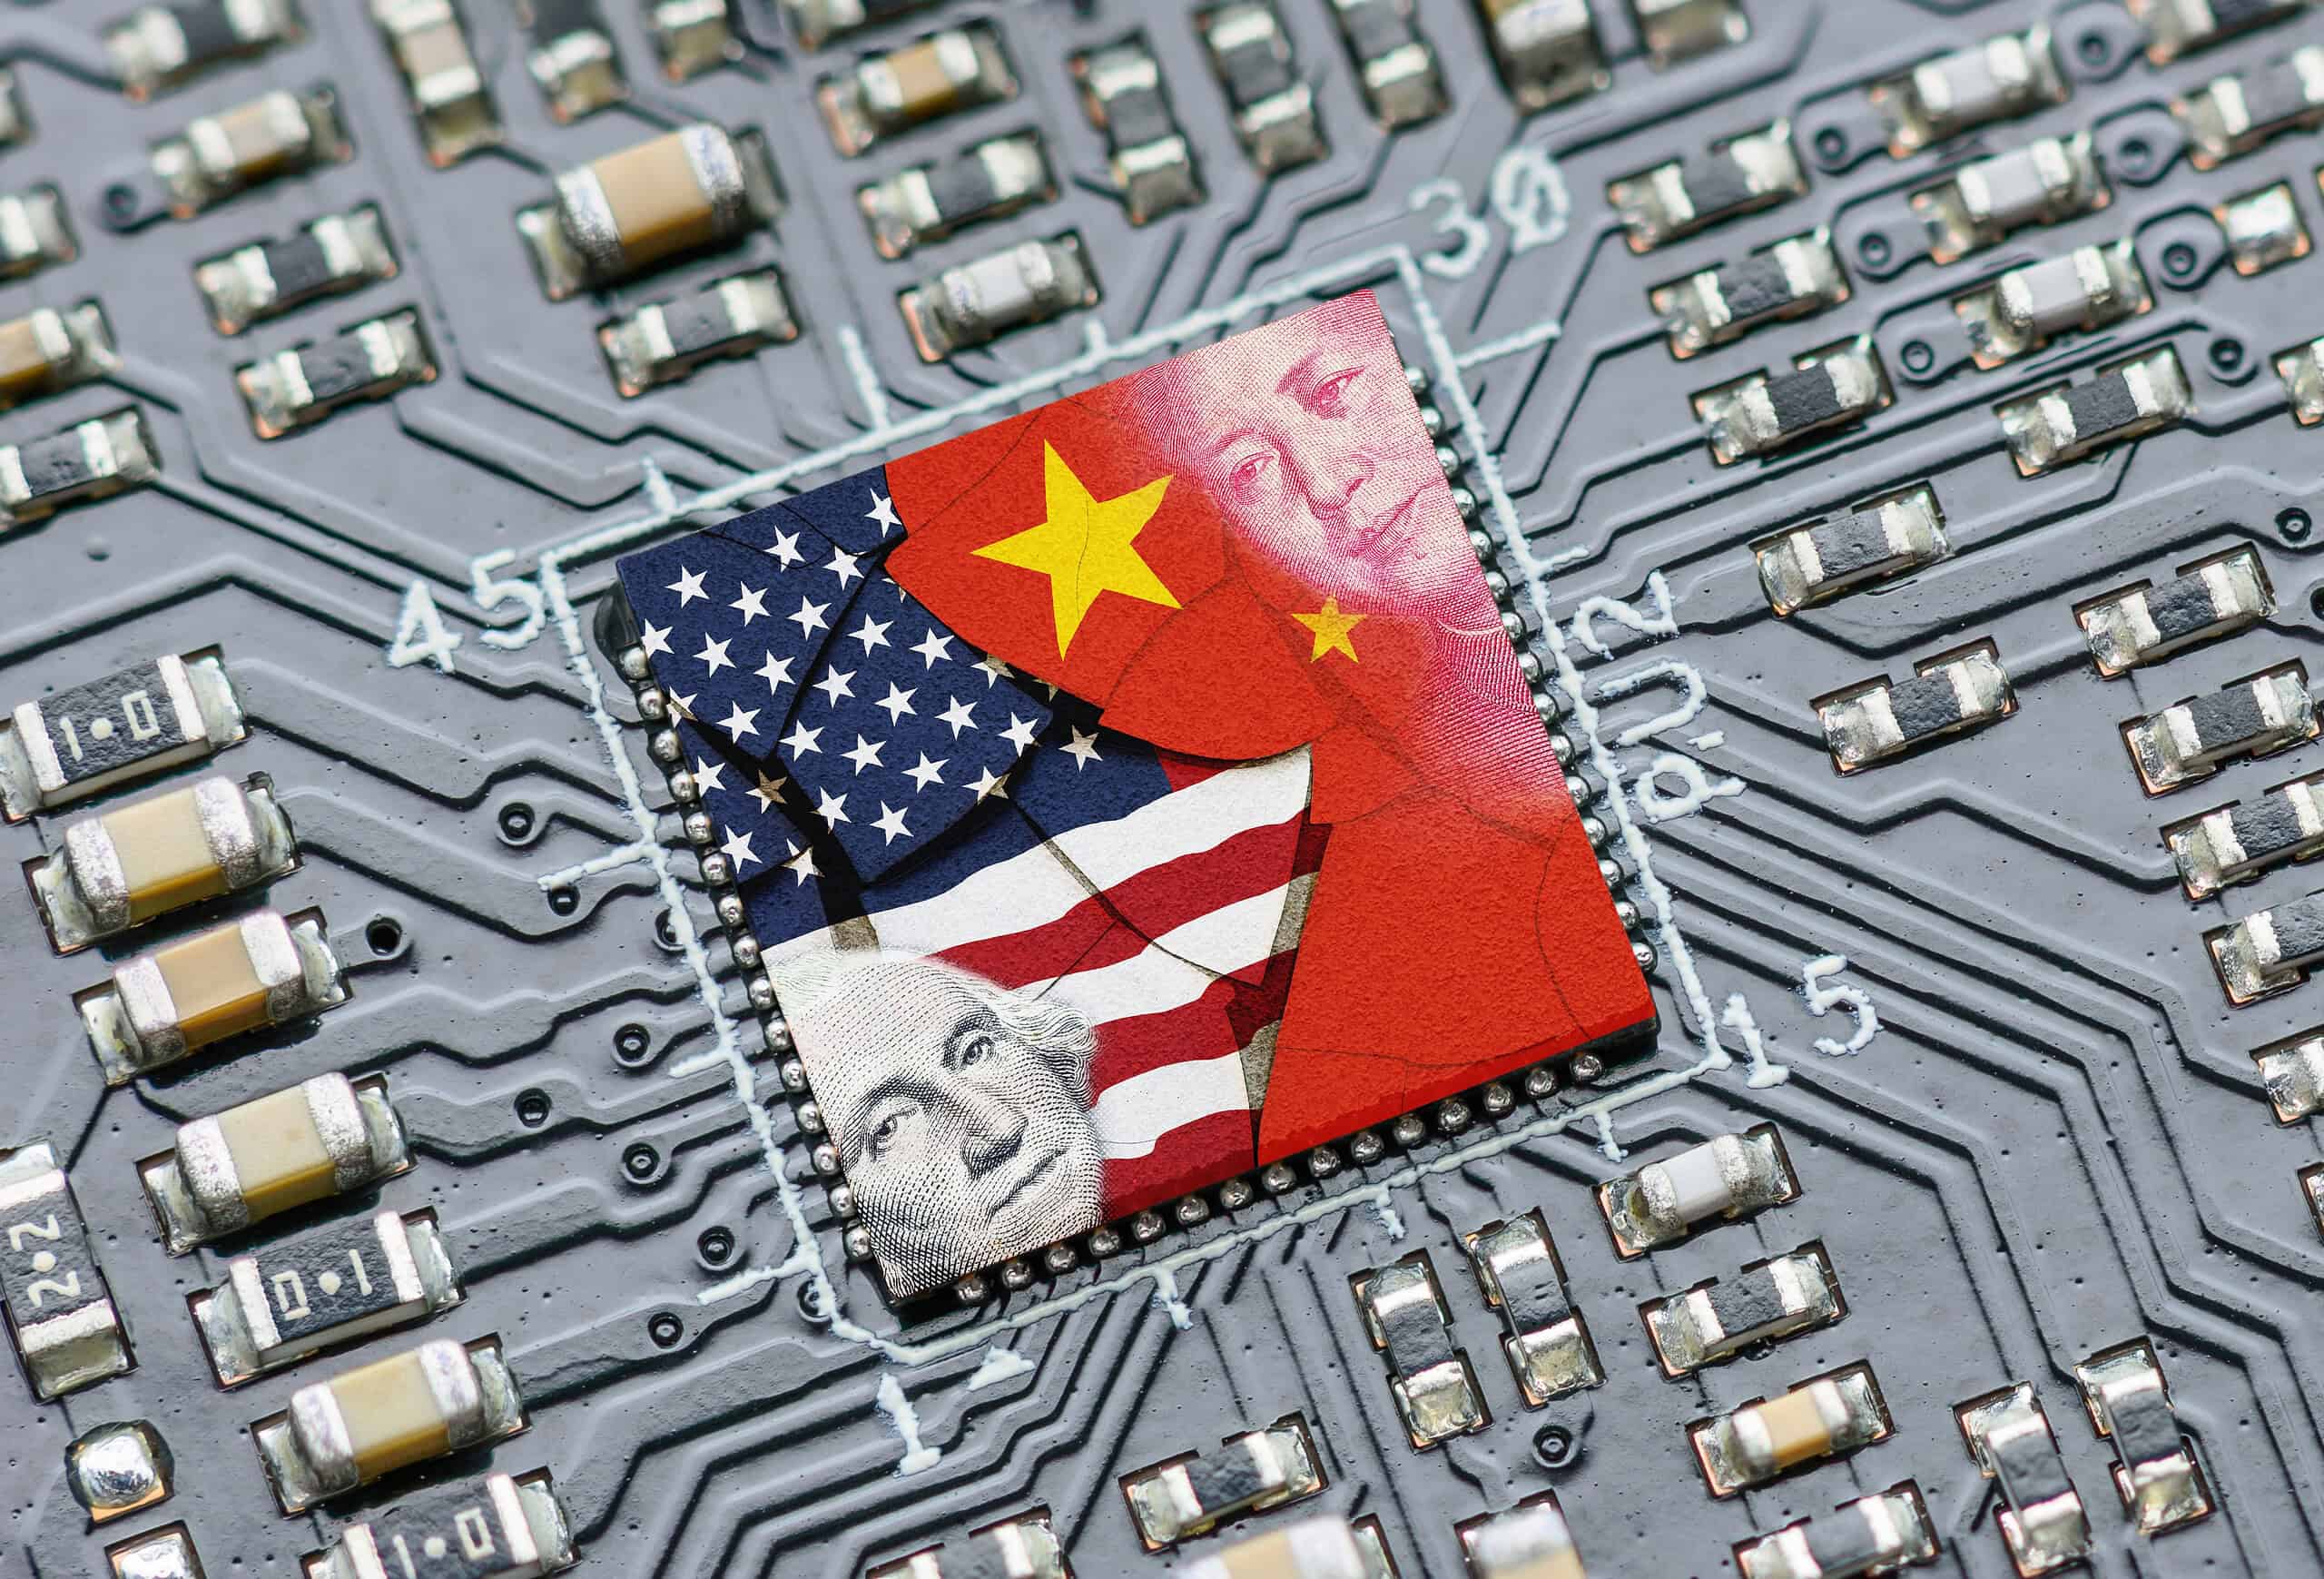
US GDP rebounded to 2.0% in Q1 2026 on AI investment, while jobless claims hit a 57-year low. But can America’s AI-driven growth outlast the fragile US-China trade truce and global uncertainty?
On the same Thursday morning that the Bureau of Economic Analysis confirmed America’s economic rebound, the Labor Department delivered a figure that made analysts double-check their screens: 189,000 initial jobless claims for the week ending April 25 — the lowest reading since September 1969, when Neil Armstrong’s moonwalk was still fresh in the national memory. Set against a backdrop of an active conflict with Iran, persistent inflation, and some of the most contentious trade diplomacy since the Cold War, the US economy’s resilience borders on the paradoxical.
The headline GDP number — a 2.0% annualized growth rate in Q1 2026, according to the BEA’s advance estimate — was slightly below the 2.2-2.3% consensus, and skeptics rightly note the mechanical lift from post-shutdown federal payroll normalization. But the number that deserves greater analytical weight is hidden deeper in the national accounts: business investment in equipment, particularly computers and AI-related infrastructure, surged to become the economy’s single most dynamic engine of demand. According to the Federal Reserve Bank of St. Louis, AI-related investment in software, specialized processing equipment, and data center buildout accounted for roughly 39% of the marginal growth in US GDP over the last four quarters — a contribution that exceeds even the tech sector’s peak impact during the dot-com boom of 2000.
That is an extraordinary fact. It is also a strategically dangerous one.
The AI Boost Behind US GDP Resilience
The private-sector numbers are staggering in their ambition. Microsoft has earmarked approximately $190 billion in capital expenditure for 2026. Alphabet is targeting $180–190 billion. Amazon is maintaining a near-$200 billion capex envelope. Meta projects $125–145 billion. At the midpoint, these four hyperscalers alone represent capital deployment equivalent to roughly 2.2% of annualized US nominal GDP — before a single smaller competitor, startup, or government AI initiative is counted.
The real-economy effects are tangible. Data center-related spending alone added approximately 100 basis points to US real GDP growth, according to Morgan Stanley’s chief investment officer. In Gallatin, Tennessee, Meta’s $1.5 billion hyperscale data center revitalized a local economy that had previously depended on declining manufacturing. In Washington, D.C., AI infrastructure investment materially buffered the regional economy during the federal government shutdown that dragged Q4 2025 GDP to a near-stall of 0.5%. The BEA’s own Q1 2026 data confirms that investment led the recovery, driven by equipment — computers and peripherals — and intellectual property products including software.
Oxford Economics chief US economist Michael Pearce summed it up with characteristic precision: “The core of the economy remained solid in Q1, driven by the AI buildout and the tax cuts beginning to feed through.” Cornell economist Eswar Prasad, Wells Fargo’s Shannon Grein, and Brookings’ Mark Muro have reached similar conclusions, though Muro’s framing is more pointed: “This AI gold rush is generating all the excitement and papering over a drift in the rest of the economy.”
That is the first tension embedded in America’s resilience story. The growth is real. Its distribution is not.
A Labor Market Defying Gravity — For Now
The jobless claims figure deserves its own moment of pause. Initial claims fell by 26,000 to 189,000 in the week ended April 25, according to Labor Department data — well below the 212,000 median forecast from Bloomberg’s economist survey. Continuing claims simultaneously dropped to 1.79 million, a two-year low. High Frequency Economics’ chief economist Carl Weinberg called it a clean report. “There is nothing to worry about in this report. YET!,” he wrote to clients, with the emphasis and punctuation entirely deliberate.
That caveat matters. The job market’s tightness reflects AI-driven demand for power engineers, data center technicians, and specialized researchers — occupational categories experiencing wage inflation that lifts aggregate statistics while leaving large swaths of traditional workers in wage stagnation. A “two-track economy,” as Brookings put it, rarely remains politically stable. And with the PCE price index — the Federal Reserve’s preferred inflation gauge — jumping to a 4.5% annualized rate in Q1 2026, real purchasing power erosion is biting even as employment remains robust. The Fed, under pressure not to cut rates into an inflationary surge, is boxed in.
This is the macroeconomic paradox of 2026: an economy generating headline strength through concentrated private investment and a historically tight labor market, while consumers decelerate, inflation accelerates, and geopolitical shocks keep piling up at the margins.
Navigating US-China Trade Diplomacy in Volatile Times
Against this domestic backdrop, the diplomatic chessboard between Washington and Beijing has been moving rapidly — and not always in predictable directions.
The arc of the past eighteen months reads like a crisis management manual. In April 2025, the Trump administration’s “Liberation Day” tariff regime ignited a full escalation, with mutual tariffs between the US and China ultimately exceeding 100% before a Geneva truce in May 2025 brought temporary de-escalation. That truce frayed quickly. By October 2025, Washington imposed additional 100% duties on Chinese goods alongside expanded export controls on critical software. Beijing countered with non-tariff measures — canceling orders, restricting rare earth exports, and tightening end-use disclosure requirements for American firms dependent on Chinese inputs.
Then came the Busan inflection point. At their summit in South Korea in late October 2025, Trump and Xi agreed to a new trade truce that suspended US escalatory tariffs through November 2026 and delivered Chinese commitments on fentanyl, rare earth pauses, and soybean purchases. The deal was described by analysts as tactical rather than structural — a détente without a doctrine. Persistent friction in technology, semiconductors, and strategic manufacturing was pointedly left unresolved.
In February 2026, the dynamics shifted again when the US Supreme Court ruled that the executive branch could not use the International Emergency Economic Powers Act (IEEPA) to impose tariffs, obligating the government to refund affected businesses and forcing the administration to shift to a 10% global tariff under Section 122 of the Trade Act of 1974. It was a legal earthquake that simultaneously constrained White House trade leverage and injected fresh legal uncertainty into bilateral negotiations.
Senior trade officials from both countries have since engaged in multiple rounds of talks — Paris in February, with both sides describing the discussions as “constructive,” a diplomatic adjective that in this context carries approximately the same information content as “ongoing.” President Trump’s planned visit to China in 2026 — his first trip in eight years — represents the highest-stakes diplomatic moment in the relationship since the first-term Phase One deal, and arguably since the 2001 WTO accession itself.
De-Risking, Decoupling, and the Silicon Chessboard
The language in this debate matters enormously. “Decoupling” — the full bifurcation of US and Chinese economic systems — is a fantasy embraced primarily by those who have not priced its consequences. The US imported over $400 billion in goods from China in 2024, from consumer electronics to pharmaceutical precursors to the very servers and peripherals that are now driving American GDP growth. The BEA noted that the Q1 2026 surge in goods imports was led by computers, peripherals, and parts — meaning that America’s AI boom is, in part, being assembled with Asian supply chains that run through Taiwan, South Korea, and yes, mainland China.
This is the central irony of US-China relations in 2026: the technology sector powering America’s economic resilience is also the sector most exposed to geopolitical disruption. Advanced semiconductors, rare earth magnets essential for defense and clean energy systems, and the specialized capital equipment for AI training clusters — all exist at the intersection of national security and economic interdependence.
The USTR’s 2026 Trade Policy Agenda explicitly frames the goal as “managing trade with China for reciprocity and balance” — a formulation that signals the administration understands full decoupling is neither achievable nor desirable, even as it maintains sweeping Section 301 tariffs inherited from the first Trump term and pursues new Section 301 investigations into Chinese semiconductor practices. The more honest strategic concept is “de-risking”: maintaining commercial engagement while systematically reducing dependencies in sectors where a supply shock could compromise national security or economic function.
That is, in principle, the correct instinct. The difficulty is execution. Export controls on advanced AI chips — the Nvidia H200 episode, where the administration allowed sales to China while collecting 25% of proceeds, drew fierce bipartisan criticism for precisely the reason that critics of managed trade always articulate: when economic and security concessions become transactional, you erode the credibility of both. Former senior US officials, quoted in Congressional Research Service analysis, noted that the decision “contradicts past US practice” of separating national security decisions from trade negotiations.
Risks and Opportunities in Bilateral Economic Ties
The structural risks are not hypothetical. They are identifiable, measurable, and — for policymakers willing to look — actionable.
On the American side, the AI buildout has created three distinct vulnerabilities. First, energy infrastructure: data centers are projected to require upwards of 25 gigawatts of new grid capacity by decade’s end, already driving electricity prices up 5.4% in 2025. A supply chain in which compute capacity races ahead of grid investment is a supply chain that will eventually encounter a hard ceiling. Second, talent concentration: the AI economy has generated insatiable demand for a narrow band of specialists — power engineers, ML researchers, data center architects — while leaving broader labor markets structurally unchanged. This is not a foundation for durable political economy. Third, import exposure: as Oxford Economics’ Pearce noted, the AI boom is partly self-limiting because US firms send substantial money abroad to import chips and components from South Korea and Taiwan — a geographic concentration that creates fragility precisely where resilience is most needed.
On the diplomatic side, the fragility of the current truce is not in dispute. The November 2026 deadline on the Busan commitments will arrive fast, and the structural issues — Chinese overcapacity in electric vehicles, solar, and steel; American restrictions on semiconductor exports and connected vehicle technology; Beijing’s tightening of rare earth export controls — will not have resolved themselves in the interim. A Trump-Xi meeting in May 2026 offers the possibility of extending the détente, perhaps structuring a more durable “managed trade” framework. But managed trade, when both parties define “management” differently, has a well-documented tendency to collapse at precisely the moment it is most needed.
The Iran war — now in its ninth week, with crude oil trading near $104 per barrel — adds a layer of global volatility that is already showing up in energy prices and consumer sentiment, and will appear in Q2 data. The Conference Board has warned that higher energy costs and supply chain disruptions are likely to weigh on GDP growth and keep the Fed on hold, further tightening the policy space available to manage whatever comes next.
The Path Forward: Smart Diplomacy or Missed Opportunity?
The case for measured optimism is real but requires specificity to be credible. The US holds asymmetric advantages in this competition: the frontier AI research ecosystem, the dollar’s reserve currency status, the depth of its capital markets, and the extraordinary private-sector energy now channeled into technological infrastructure. These are genuine strengths. They confer strategic leverage. They also, if mismanaged, create complacency — the assumption that technological lead translates automatically into diplomatic leverage, or that economic dynamism renders geopolitical risk management optional.
It does not. The Reagan-era trade disputes with Japan, the Clinton-era engagement with China, and the first-term Trump tariff campaigns all demonstrate that economic power and diplomatic sophistication must operate in tandem. The current moment calls for exactly that combination: a framework that protects semiconductor supply chains and critical technology leadership without sacrificing the commercial relationships that make the AI buildout itself possible. “Friend-shoring” — the deliberate diversification of supply chains toward allied democracies — is a genuine and necessary strategy, but it takes a decade to build what markets created over forty years.
The diplomats who navigate this most successfully will be those who resist the binary of engagement versus confrontation, and instead build durable, enforceable rules in the specific sectors where rivalry is sharpest: advanced chips, rare earths, AI governance, and data security. The USTR’s ambitious Reciprocal Trade Agreement program, which seeks binding market access commitments from partners across Asia and Europe, points in roughly the right direction — provided it does not inadvertently impose costs that undermine the private investment driving the very GDP growth policymakers are celebrating today.
America’s AI-driven resilience is real, and this week’s data — a 2.0% rebound from near-stall, jobless claims at a 57-year low — deserves genuine recognition. But economies, like tectonic plates, can appear stable right up to the moment they are not. The fault line running beneath the current recovery is not primarily technological. It is geopolitical. Managing it demands the same ambition and precision that the private sector is currently bringing to the AI buildout. There is, in 2026, no reason to believe it cannot be done. There is also no reason to assume it will be done automatically.
That, ultimately, is the work.
FAQ: US-China Relations, GDP Growth, and the AI Economy in 2026
Q: What drove US GDP growth in Q1 2026? The BEA’s advance estimate showed 2.0% annualized growth, driven by surging business investment in AI equipment, computers, and software, alongside a rebound in government spending following the end of the Q4 2025 federal government shutdown. Consumer spending and exports also contributed, while elevated imports — largely computers and AI-related parts — partially offset those gains.
Q: Why did US initial jobless claims fall to 189,000 in April 2026? The week ending April 25 saw claims fall by 26,000 to 189,000, the lowest since September 1969. The drop reflects a tight labor market in which layoff announcements — from companies like Meta and Nike — have not yet translated into actual terminations. AI-driven sectors are generating strong demand for specialized workers, keeping aggregate layoff rates historically low despite broader economic uncertainty.
Q: What is the current state of US-China trade relations in 2026? Relations are in a fragile détente. The Trump-Xi Busan summit in late 2025 produced a truce suspending escalatory US tariffs until November 2026 in exchange for Chinese commitments on fentanyl, rare earths, and agricultural purchases. However, structural disputes over semiconductors, technology export controls, Chinese industrial overcapacity, and rare earth access remain unresolved. A Trump visit to China in 2026 may seek to extend or deepen this framework.
Q: What does “de-risking” versus “decoupling” mean in the US-China context? Decoupling refers to a full economic separation — ending significant trade and investment ties between the two countries. De-risking is the more pragmatic approach: maintaining commercial engagement while systematically reducing dependencies in sectors critical to national security, such as advanced semiconductors, rare earth materials, and connected technology. The current US administration’s policy formally targets the latter, though execution remains contested.
Q: How much of US GDP growth is driven by AI investment? The Federal Reserve Bank of St. Louis estimates that AI-related investment in software, specialized equipment, and data centers accounted for approximately 39% of marginal US GDP growth over the four quarters through Q3 2025 — surpassing the tech sector’s contribution at the peak of the dot-com boom. Major tech companies have collectively planned over $700 billion in capital expenditure for 2026, much of it AI-related.
Q: What are the key risks to US economic resilience in 2026? The main risks include: elevated inflation (PCE at 4.5% annualized in Q1 2026) constraining consumer spending and Federal Reserve flexibility; the Iran war driving energy prices higher; AI investment’s over-concentration in a single sector; grid capacity failing to keep pace with data center energy demand; and the potential collapse of the US-China trade truce ahead of its November 2026 deadline.
Q: What is the outlook for a Trump-Xi summit in 2026? President Trump’s planned visit to China — his first in eight years — is expected in 2026 and would represent the most significant bilateral diplomatic moment since the Phase One trade deal. Analysts broadly expect any summit outcome to be tactical rather than structural: a potential extension of the tariff truce, some progress on fentanyl and agricultural trade, but no resolution of deeper disputes over technology, Taiwan, or the strategic competition in advanced manufacturing.
Discover more from The Economy
Subscribe to get the latest posts sent to your email.



Key Takeaways
- Rolex’s secondary market rose approximately 7.9% year-over-year as of 2026 (per WatchCharts data) — trailing Patek Philippe (+16.2%) and Tudor (+11.4%) but still outperforming Audemars Piguet (+3.4%).
- Rolex raised U.S. retail prices 4–9% in January 2026 (steel models ~5.6%, gold models ~8.7%), narrowing the historical gap between retail and pre-owned pricing.
- Not every model appreciates: steel sports references (Submariner, GMT-Master II, Daytona) have held value far better than two-tone or widely available dress references like the standard Datejust.
- The Lady-Datejust posted the sharpest 2026 gain among tracked collections — up 22.73%, from roughly $9,269 to $11,376 — driven by demand for smaller, “everyday luxury” watches.
- Gold’s rise past $2,400/oz has directly lifted the investment case for Rolex’s precious-metal references (Day-Date, Sky-Dweller, Yacht-Master).
The Model-by-Model Picture
| Category | 2026 Trend |
|---|---|
| Lady-Datejust | +22.73% (strongest performer among tracked collections) |
| Steel sports models (Submariner, GMT-Master II) | Held value well; corrected from 2022 peak but stabilized above retail |
| Daytona | Corrected from highs above $50,000 to the mid-$30,000s; still among the most sought-after references |
| Two-tone/widely available Datejust | Flat to negative — “holds value” is an overstatement for this category |
| Gold references (Day-Date, Sky-Dweller) | Lifted by gold’s rise above $2,400/oz |
Why the “Rolex Always Appreciates” Myth Is Fading
The pandemic-era boom pushed some references — the Daytona above all — to speculative highs disconnected from historical norms. Since the March 2022 peak, steel sports models have compressed meaningfully, and dealers who bought inventory near the top have in some cases faced 20–40% markdowns on liquidation. The lesson for 2026 buyers: Rolex as a category is not a monolith. Value retention depends heavily on specific reference, condition, and whether the piece comes with box and papers (“full set”).
What’s Actually Driving 2026 Strength
- Retail price increases raise the floor. When a new Submariner retails at $10,050 (up from $9,500), a pre-owned example at $11,000–$12,000 suddenly represents a smaller premium — narrowing the gap without secondary prices actually moving.
- Supply discipline remains Rolex’s core lever. The brand has never confirmed production numbers, and secondary-market premiums remain entirely a function of Rolex’s own manufacturing decisions — a risk factor as much as a support.
- Certified Pre-Owned rollout. Rolex’s now fully rolled-out CPO program has changed how buyers transact in the used market, adding a layer of brand-verified legitimacy that supports pricing.
The Case for Rolex as a Portfolio Diversifier
Financial advisors increasingly frame luxury watches not as a replacement for equities or bonds, but as a tangible, historically low-correlation diversifier — one that carries its own risks (illiquidity, condition-dependent pricing, no yield) but has demonstrated multi-decade resilience for specific references.
Is Rolex a good investment in 2026?
It depends heavily on the specific reference. Steel sports models like the Submariner and Daytona have held or grown in value; two-tone and widely available dress models generally have not. Overall, Rolex’s secondary market rose about 7.9% year-over-year in 2026, trailing Patek Philippe but ahead of Audemars Piguet.
Discover more from The Economy
Subscribe to get the latest posts sent to your email.

Navigating Mortgage and Loan Refinancing in a High-Yield Environment
Global public debt crossing critical thresholds has kept central bank policies volatile, resulting in fluctuating US Treasury yields throughout 2026. For homeowners and commercial property holders burdened by previous high-interest borrowing cycles, finding optimal refinance windows has become a high-stakes financial puzzle. Stalled disinflation and stubborn employment numbers mean rate cuts are incremental, requiring borrowers to act with precision.
Timing your mortgage or commercial loan refinance in this environment requires a deep understanding of yield curve movements and lender risk appetites.
Decoding 2026 Refinance Dynamics
The 10-Year Treasury Yield Benchmark
Mortgage rates continue to track closely with the 10-year US Treasury yield. When macroeconomic anxiety spikes debt issuance, yields rise, tightening consumer borrowing capacity. Savvy borrowers monitor weekly Treasury auctions to lock in rates during brief dip windows.
Hybrid ARMs and Alternative Structures
With fixed rates remaining elevated, 7/1 and 10/1 adjustable-rate mortgages (ARMs) have surged in popularity. These products offer lower initial monthly payments, giving borrowers breathing room until central bank easing cycles fully materialize.
| Loan Product | Current Rate Range | Best For | Key Risk Factor |
| 30-Year Fixed Mortgage | 6.2% – 6.8% | Long-term predictability | Higher initial monthly outlay |
| 7/1 Hybrid ARM | 5.5% – 5.9% | Short-term ownership / flipping | Rate reset risk after year 7 |
| Commercial Refinance | 7.0% – 8.2% | Corporate asset restructuring | Strict DSCR lender covenants |
Actionable Steps for Successful Refinancing
To maximize your chances of securing favorable refinance terms in a volatile market, follow a disciplined preparation strategy.
Boost Your Credit Score Immediately: Lenders in 2026 are applying stringent credit tiering; a 20-point increase can drop your APR by a crucial quarter-point.
Shop Regional Credit Unions: Smaller financial institutions often offer portfolio loans with more flexible underwriting than major national banks.
Calculate the Break-Even Point: Ensure your total closing costs are recouped through monthly savings within 24 months of closing.
“Market Strategist View: Refinancing in 2026 is an exercise in opportunistic timing. Borrowers must maintain immaculate financial profiles ready to strike the moment Treasury yields dip.”
Mastering the complexities of today’s debt environment ensures you can successfully lower your debt service costs and protect your long-term financial stability.
Discover more from The Economy
Subscribe to get the latest posts sent to your email.

The days of pulling generic auto insurance quotes based purely on your zip code and age are officially over. In 2026, insurance comparison engines are powered entirely by generative AI and real-time telematics. These platforms digest thousands of live data points—ranging from your driving smoothness via connected vehicle sensors to real-time traffic congestion patterns—to generate hyper-personalized premiums instantly.
For consumers, this evolution represents both a massive opportunity for savings and a hidden trap for penalty pricing. Understanding how AI algorithms evaluate risk is essential for anyone looking to lower their monthly auto insurance premiums.
How AI Comparison Engines Evaluate Your Risk Profile
Behavioral Telematics and Connected Cars
Modern cars stream performance data directly to insurance aggregators. Generative AI models analyze braking sharpness, acceleration curves, cornering G-forces, and phone distraction metrics. Drivers who maintain smooth, defensive habits are rewarded with dynamic rate cuts of up to 40% compared to traditional rating tiers.
Predictive Traffic and Weather Modeling
AI tools now cross-reference your daily commute route with predictive weather and accident probability models. If your standard parking location or driving corridor has a statistically higher incidence of uninsured motorist claims, your quotes will reflect that hyper-local risk assessment.
| Comparison Factor | Traditional Rating Model | 2026 Generative AI Model | Impact on Premium |
| Mileage & Usage | Annual estimated odometer reading | GPS tracking & live trip duration | High (up to 35% savings) |
| Driving Behavior | MVR driving record & accidents | Real-time braking, speed, & G-force | Critical (determines tier) |
| Vehicle Tech | Make, model, and safety rating | ADAS calibration & repair cost data | Moderate |
Strategies to Lower Your AI-Driven Insurance Quote
To outsmart the algorithm and secure the lowest possible premium in 2026, drivers must proactively manage their digital footprint on insurance platforms.
Opt-In for Telematics Trial Periods: Many insurers offer immediate 15% discounts just for installing their driving app; let it track safe habits for 30 days to lock in permanent savings.
Scrub Unverified Public Records: Ensure your motor vehicle report is free of clerical errors that AI risk models misinterpret as reckless behavior.
Compare AI Aggregators: Use platforms that integrate multi-carrier API feeds rather than single-brand comparison sites to find the best risk-adjusted rate.
“Industry Note: AI-driven pricing rewards transparency and precision. Drivers who actively manage their telematics data consistently out-save those relying on legacy quote calculators.”
Embracing AI comparison tools allows savvy policyholders to customize coverage limits precisely to their driving habits, eliminating wasted premium spend while ensuring robust protection.
Discover more from The Economy
Subscribe to get the latest posts sent to your email.

Global Pension Systems Ranked: The World’s Best and Worst Retirement Frameworks

Global Supply Chain Vulnerabilities: From Eurasian Trade Corridors to Food Consumer Recalls

Why 5% U.S. Treasury Yields Signal a Global Market Regime Shift.

Federal Reserve Defies White House Pressure: Inside Trump’s Demand for Sub-1% Interest Rates After Historic 2026 Rate Hike

How Rising Interest Rates Impact Gig Economy Apps: DoorDash, Uber, and Urban Services

GasBuddy Market Insights: How Crude Price Shifts Impact Local Fuel Cost Averages

DoorDash Driver Payouts, Fee Structures, and Market Competition Analysis

OPINION:Breaking the 3.5% Growth Trap: How Pakistan Can Build a High-Productivity Export Economy

Global Equity Market Divergence: US Tech vs. European Dividend Stocks vs. Asian Growth

Asian Markets Analysis: Navigating Volatility in China, Japan, and Singapore Stocks

Stagflation vs. Soft Landing: How Central Bank Rates Are Reshaping European and Asian Economies

IMF & World Bank Global Economic Outlook: Growth Forecasts Across Europe and Asia

Fed Rate Hike Projections vs. Trump’s Interest Rate Policy: What Global Markets Expect Next

Singapore Stocks: The Ultimate Safe Haven for Markets and Finance in 2026?

State Farm’s $5B Dividend 2026: Who Qualifies & Payout Dates

US-China Relations in Q3 2026: Trade Tariffs and Supply Chain Risks

SpaceX Starship Flight 14: First Orbital Attempt & Starlink V3 Launch Explained

Top 30 Stocks for Investment in PSX for Massive ROI in 2026

The 2026 Crypto Regulatory Shift: What It Means for Institutional Investors

AI Chip Stocks 2026: The Best Semiconductor Investments Beyond Marvell

AI-Powered Training: The Next Multi-Billion Dollar Ecosystem in Fitness

Tween Back-to-School Trends 2026: What’s Driving the $85B Season

10-Year Treasury Yield Hits 4.80%: What It Means for Rates & Portfolios

Oil Prices Break $100 in 2026: Middle East Conflict & Energy Markets

Shein Clothes Quality & Safety in 2026: What Lab Tests Show

Fidelity Investments Review 2026: SPAXX Yields & Zero-Fee Funds

MRVL Earnings 2026: Why Marvell Sank Despite Beating Estimates

China’s US$10.8 Billion Trade Shortcut: Why the Pinglu Canal Matters
-

 Markets & Finance9 months ago
Top 15 Stocks for Investment in 2026 in PSX: Your Complete Guide to Pakistan’s Best Investment Opportunities
-

 Analysis7 months ago
Johor’s Investment Boom: The Hidden Costs Behind Malaysia’s Most Ambitious Economic Surge
-

 Analysis7 months ago
Top 10 Stocks for Investment in PSX for Quick Returns in 2026
-

 Analysis7 months ago
Brazil’s Rare Earth Race: US, EU, and China Compete for Critical Minerals as Tensions Rise
-

 Banks8 months ago
Best Investments in Pakistan 2026: Top 10 Low-Price Shares and Long-Term Picks for the PSX
-

 Investment8 months ago
Top 10 Mutual Fund Managers in Pakistan for Investment in 2026: A Comprehensive Guide for Optimal Returns
-

 Global Economy9 months ago
15 Most Lucrative Sectors for Investment in Pakistan: A 2025 Data-Driven Analysis
-

 Global Economy9 months ago
Pakistan’s Export Goldmine: 10 Game-Changing Markets Where Pakistani Businesses Are Winning Big in 2025