
Global Economy
Pakistan’s $250M Panda Bond: A Calculated Bet on Beijing—Or a Currency Time Bomb?
How Pakistan’s first yuan-denominated bond exposes the rupee to a new geopolitical and financial calculus
When Finance Minister Muhammad Aurangzeb announced in December that Pakistan would issue its first Panda Bond in January 2026—raising $250 million from Chinese investors—the headlines trumpeted financial diversification. But beneath the diplomatic niceties lies a far more consequential question: Is Pakistan trading one form of dollar dependency for a potentially more dangerous yuan exposure, and what does this mean for the already fragile Pakistani rupee?
The answer matters not just for Islamabad’s 240 million citizens, but for every emerging economy watching China’s expanding financial footprint across the developing world. As Western capital markets remain skeptical of Pakistan’s fiscal stability, this yuan gambit represents both opportunity and risk—a high-stakes wager that could either stabilize the rupee or accelerate its decline.
The Panda Bond Explained: More Than Just Another Loan
A Panda Bond is not your typical international debt instrument. Unlike Eurobonds denominated in dollars or euros, these are yuan-denominated bonds issued within China’s domestic market by foreign entities. Pakistan will borrow directly in Chinese currency, selling debt to Chinese institutional investors who are eager to diversify portfolios and support Beijing’s broader strategy of internationalizing the renminbi.
The mechanics are deceptively simple: Pakistan issues bonds worth approximately 1.8 billion yuan, Chinese investors buy them, and three years later Pakistan must repay both principal and interest—all in yuan. The inaugural $250 million tranche is just the opening salvo in a $1 billion program that Finance Ministry officials confirmed is already preparing a “Panda Series II” issuance.
What makes this significant is the currency risk transfer. While dollar-denominated debt exposes Pakistan to Federal Reserve policy and global liquidity conditions, yuan debt ties Pakistan’s fortunes to the People’s Bank of China’s monetary decisions and the bilateral exchange rate between the rupee and yuan—a relationship that has been anything but stable.
The Rupee’s Precarious Position: Why Currency Matters Now More Than Ever
To understand the Panda Bond’s implications, consider Pakistan’s currency dynamics heading into 2026. The rupee currently trades around 280 to the dollar, having depreciated roughly 1% over the past year despite claims of stabilization. More critically, Pakistan’s foreign exchange reserves—while improved to approximately $20 billion after recent IMF disbursements—still cover barely three months of imports, a razor-thin buffer that leaves the currency vulnerable to external shocks.
Pakistan’s forex reserves crossed $20 billion in December 2025 after receiving roughly $1.2 billion from the IMF, but this improvement masks deeper structural vulnerabilities. The country faces $1 billion in Eurobond repayments in April 2026, with total external debt servicing obligations that consume more than 100% of annual tax revenue.

Here’s where the Panda Bond calculus gets complicated. Pakistan earns most of its foreign exchange through exports priced in dollars and remittances sent home in various currencies—but predominantly converted through the dollar. Now it’s adding debt obligations in yuan, creating a triple currency exposure: earning in dollars and rupees, while owing dollars, euros, and increasingly, yuan.
The historical correlation between the Pakistani rupee and Chinese yuan offers little comfort. Over the past five years, the yuan has fluctuated between 6.2 and 7.3 to the dollar, while the rupee has steadily depreciated from roughly 160 to 280 against the greenback. If the yuan strengthens against both the dollar and rupee—as Chinese policymakers desire for international credibility—Pakistan’s debt servicing burden in rupee terms could spike dramatically.
Consider a scenario: If Pakistan borrowed 1.8 billion yuan when the exchange rate was 40 rupees per yuan, but must repay when it’s 50 rupees per yuan, the real cost in local currency terms jumps 25%. That’s not theoretical risk—it’s the lived reality of currency mismatch that has devastated emerging market borrowers from Turkey to Argentina.
The China Debt Overhang: Already $30 Billion and Growing
Pakistan’s Panda Bond doesn’t exist in isolation—it’s the latest chapter in a debt relationship with Beijing that has already reached concerning proportions. China-Pakistan Economic Corridor financing now constitutes approximately $30 billion of Pakistan’s external debt, making China the largest bilateral creditor by far.
The CPEC megaproject, launched in 2013 with promises of transformative infrastructure and energy generation, has delivered some tangible benefits: 14 power projects have added nearly 8,700 megawatts of electricity production capacity. But these gains came at steep cost. The power plants rely on imported coal from Indonesia, South Africa, and Australia, increasing Pakistan’s fuel import bill while producing expensive electricity that consumers struggle to afford. By July 2025, unpaid bills to Chinese power companies had reached $1.5 billion, violating contractual obligations and straining diplomatic relations.
Of the 90 planned CPEC projects, only 38 have been completed. The flagship Gwadar Port operates on a limited scale. Security concerns have forced delays and cancellations, with militant attacks targeting Chinese personnel feeding Beijing’s growing wariness about expanding exposure to Pakistan.
The Panda Bond, in this context, represents both a vote of confidence and a potential pressure point. Chinese officials reportedly showed “strong interest” in the bond during investor engagement, according to Finance Ministry briefings. But investor appetite doesn’t necessarily translate to favorable long-term outcomes for Pakistan’s currency stability.
The IMF Tightrope: Balancing Beijing and Washington
Pakistan’s economic policy is currently shaped by two competing gravitational forces: a $7 billion IMF Extended Fund Facility approved in September 2024, and deepening financial integration with China. The IMF program requires fiscal consolidation, revenue enhancement, privatization of state-owned enterprises, and exchange rate flexibility—measures designed to build Pakistan’s capacity to manage debt independently.
The IMF’s second review, completed in December 2025, released approximately $1 billion under the Extended Fund Facility and $200 million under the Resilience and Sustainability Facility, bringing total IMF disbursements to $3.3 billion. These funds are critical for maintaining reserve buffers and signaling creditworthiness to international markets.
But here’s the tension: IMF programs emphasize debt transparency and sustainability analysis, including scrutiny of bilateral lending terms. China’s lending practices—often characterized by opaque contracts, collateral requirements, and policy conditionalities—have raised concerns among Western creditors about Pakistan’s ability to meet all obligations simultaneously.
The Panda Bond, denominated in yuan and sold exclusively to Chinese investors, falls into a regulatory grey zone. While technically market-based financing, it deepens financial interdependence with Beijing at precisely the moment when IMF staff are pushing for broader creditor base diversification. Pakistan owes roughly 22-30% of its $135 billion external debt to China—a concentration risk that debt sustainability analyses flag as problematic.
If Pakistan were forced into debt restructuring—not an implausible scenario given its thin reserve coverage and massive rollover requirements—would Chinese bondholders accept haircuts alongside Paris Club creditors? The lack of historical precedent creates uncertainty that could, ironically, weaken the rupee by spooking other investors.
Currency Hedging: The Hidden Cost Nobody’s Discussing
One critical detail buried in the technical aspects of Panda Bond issuance: currency hedging costs. Pakistan doesn’t generate significant yuan revenues domestically, meaning it must either earn yuan through exports to China, swap currencies in financial markets, or purchase yuan using dollar reserves when debt comes due.
Each option carries costs and risks. China-Pakistan bilateral trade reached $23 billion in 2023, but Pakistan runs a massive deficit—importing far more from China than it exports. This means Pakistan can’t naturally generate sufficient yuan through trade to service Panda Bond obligations.
Currency swap markets for PKR/CNY are thin and expensive compared to PKR/USD markets. Hedging a $250 million yuan obligation over three years could cost anywhere from 2-5% annually, depending on market conditions and counterparty availability. That’s a substantial hidden expense that doesn’t appear in initial borrowing cost calculations.
Without proper hedging, Pakistan faces direct currency risk. With hedging, it faces potentially prohibitive costs that erode any interest rate advantage the Panda Bond might offer over dollar-denominated alternatives. Finance Ministry officials have not publicly disclosed the hedging strategy, leaving analysts to wonder whether this risk is being managed or simply accepted.
The rupee’s stability—or instability—becomes central to this calculation. A 10% rupee depreciation against the yuan would increase debt servicing costs by 10% in local currency terms. Given the rupee’s track record of steady devaluation, this isn’t alarmist speculation—it’s mathematical probability requiring serious policy attention.
The Geopolitical Dividend: What Beijing Really Wants
To fully understand the Panda Bond’s implications for Pakistan’s currency, we must acknowledge the geopolitical dimension. China’s encouragement of Panda Bond issuances isn’t purely altruistic—it serves Beijing’s strategic objective of yuan internationalization.
Currently, the yuan accounts for roughly 3% of global foreign exchange reserves and about 2% of international payments, far below the dollar’s 60% and 40% shares respectively. Every Panda Bond issued by a sovereign borrower like Pakistan legitimizes yuan-denominated debt, creates precedent for other emerging economies, and gradually builds the infrastructure for yuan-based international finance.
For Pakistan, tapping Chinese capital markets demonstrates political alignment with Beijing at a time of intensifying US-China rivalry. The timing is particularly notable: as Pakistan navigates relationships with both Washington and Beijing, financial choices send signals. Issuing dollar-denominated Eurobonds tilts toward Western markets; issuing Panda Bonds signals comfort with Chinese financial integration.
This political calculus has currency implications. If Pakistan is perceived as moving decisively into China’s financial orbit, Western investors may demand higher risk premiums on dollar-denominated Pakistani debt, effectively raising borrowing costs across the board. Conversely, if Chinese support is seen as a backstop against default risk, it could paradoxically stabilize the rupee by reducing overall risk perception.
The outcome depends on credibility. Does China’s willingness to buy Pakistani Panda Bonds indicate genuine confidence in economic reforms, or is it diplomatic lending that prioritizes geopolitical goals over financial returns? Market participants are watching closely, and their conclusions will influence capital flows that directly impact the rupee’s value.
Regional Precedents: Lessons From Other Emerging Markets
Pakistan isn’t the first emerging economy to issue Panda Bonds. Egypt issued Africa’s first Sustainable Panda Bond worth 3.5 billion yuan in 2023, backed by guarantees from the African Development Bank and Asian Infrastructure Investment Bank. The AAA-rated guarantees were crucial for securing favorable terms and crowding in investors.
Pakistan’s Panda Bond carries no such multilateral guarantees. While the Finance Ministry secured “approvals from multilateral partners,” these appear to be non-objection clearances rather than credit enhancements. Without guarantee backing, Pakistan must rely on its own credit profile—currently rated ‘CCC+’ by S&P and ‘Caa3’ by Moody’s, deep in junk territory indicating substantial credit risk.
The Egyptian precedent also illustrates potential benefits: diversified funding sources, access to Chinese savings pools, and demonstration effects that can improve subsequent market access. Egypt successfully used Panda Bond proceeds for sustainable development objectives under a transparent framework that helped rebuild investor confidence.
But Egypt’s macroeconomic fundamentals differ significantly from Pakistan’s. Egypt’s external debt-to-GDP ratio, while elevated, isn’t concentrated as heavily with a single creditor. Its foreign exchange reserves, though pressured, weren’t as perilously thin at the time of issuance. These baseline differences matter for how currency markets interpret similar financing decisions.
More cautionary tales come from countries like Sri Lanka, which became heavily indebted to China through infrastructure projects and faced severe balance of payments crises when dollar earnings couldn’t cover debt servicing. While Sri Lanka didn’t issue Panda Bonds specifically, its experience with concentrated Chinese debt exposure offers sobering lessons about currency vulnerability and loss of policy autonomy.
The State Bank’s Dilemma: Monetary Policy in a Yuan-Exposed World
For Pakistan’s central bank, the Panda Bond creates new complications in an already challenging mandate. The State Bank of Pakistan has cut policy rates by 1,100 basis points since June 2025, bringing rates down as inflation moderated to low single digits. This easing cycle aims to stimulate economic growth while maintaining currency stability.
But yuan-denominated debt adds a new variable to the policy equation. If the State Bank needs to defend the rupee through interest rate increases—whether to combat inflation resurgence or prevent capital flight—higher domestic rates could paradoxically worsen the yuan debt burden by widening interest rate differentials and attracting speculative flows that create volatility.
The central bank’s exchange rate flexibility, a key IMF program requirement, also becomes more constrained. With significant yuan obligations coming due in 2029, the State Bank must consider not just the rupee-dollar rate, but also the rupee-yuan cross rate. Smoothing rupee volatility against one currency might inadvertently create volatility against the other, complicating monetary policy implementation.
Foreign exchange market operations become more complex too. The State Bank typically intervenes using dollar reserves to influence the rupee-dollar rate. Managing yuan exposure may require developing yuan liquidity management tools, currency swap facilities, and deeper yuan foreign exchange markets—capabilities that Pakistan’s financial infrastructure currently lacks.
These technical challenges have real economic consequences. If the central bank is constrained in its policy choices by external debt composition, it loses degrees of freedom in responding to domestic shocks. That reduced policy flexibility can itself become a source of currency instability, as markets recognize the central bank’s limited room for maneuver.
The $1 Billion Question: What Happens After January?
The $250 million inaugural tranche is explicitly framed as the first step in a $1 billion Panda Bond program. Finance Ministry officials confirmed that “preparatory work for subsequent issuances under Panda Series II is already underway,” with Chinese regulators fully briefed on the multi-tranche structure.
This scaling ambition raises the stakes considerably. A quarter-billion dollar yuan obligation is manageable, even for Pakistan’s strained finances. But $1 billion in yuan debt—roughly 7 billion yuan at current exchange rates—represents a material shift in debt composition that could influence currency market dynamics.
Each subsequent Panda Bond issuance will face market scrutiny about how Pakistan managed the previous one. If early tranches are serviced smoothly, with stable exchange rates and no hedging issues, subsequent issuances become easier and potentially cheaper. But if problems emerge—payment difficulties, currency pressures, or policy conflicts with other creditors—the Panda Bond program could become a source of financial stress rather than relief.
The timing of future tranches also matters. Issuing during periods of rupee strength locks in better exchange rates for repayment. Issuing during currency weakness or reserve pressure could signal desperation, triggering adverse market reactions that become self-fulfilling. Pakistan’s track record of economic volatility suggests future issuances won’t all occur under favorable conditions.
There’s also the question of investor appetite beyond the inaugural issuance. Chinese institutional investors buying the first Panda Bond are making a bet not just on Pakistan’s creditworthiness, but on the bilateral relationship’s durability. Each subsequent issuance tests that confidence anew. One security incident targeting Chinese nationals, one CPEC project cancellation, one political shift in Islamabad—any could chill investor sentiment and make future issuances difficult or impossible.
The Unspoken Alternative: What If Pakistan Had Chosen Differently?
It’s worth examining the counterfactual: What if Pakistan had raised $250 million through traditional Eurobonds instead? The answer illuminates what’s truly at stake in the Panda Bond decision.
Dollar-denominated Eurobonds would maintain Pakistan’s existing currency risk profile without adding yuan exposure. The country already earns dollars through exports and remittances, creating natural revenue streams to service dollar debt. Hedging isn’t necessary—the currency match is inherent in the business model of a dollar-dependent economy.
But Eurobond yields for Pakistani sovereign debt have hovered between 8-12% in recent years, reflecting elevated credit risk. Panda Bond interest rates, while not yet disclosed publicly, are likely lower—perhaps 5-7% given Chinese government policy support for such issuances. That spread represents real savings: on $250 million over three years, a 3% interest rate difference saves roughly $22 million in interest payments.
However, this comparison ignores currency risk. A 10% rupee depreciation against the yuan (entirely plausible given historical volatility) would increase the real cost of Panda Bond servicing by $25 million—wiping out the interest savings and then some. Factor in hedging costs, and the supposed advantage of cheaper Chinese financing evaporates quickly.
The alternative comparison is actually with Chinese bilateral loans, which Pakistan has accessed extensively through CPEC and other channels. Bilateral loans typically carry concessional terms but also policy conditions—project approvals, contractor selection, strategic access agreements. Panda Bonds, being market instruments, theoretically avoid such conditionalities.
But do they really? The bonds are sold exclusively to Chinese investors, priced in yuan, governed by Chinese law, and subject to Chinese regulatory oversight. While legally distinct from bilateral loans, Panda Bonds create dependencies that policy conditions might also impose. The difference is one of form rather than substance—and currency risk remains constant across both.
Three Scenarios for the Rupee: Where We Go From Here
Looking ahead to 2026-2029, three plausible scenarios emerge for how the Panda Bond shapes rupee dynamics:
Best Case: Strategic Stabilization
Pakistan successfully uses Panda Bond proceeds to finance productive investments that generate returns. Economic reforms under the IMF program take hold, export growth accelerates, and forex reserves build to comfortable levels above $30 billion. The yuan obligation becomes one manageable component of a diversified debt portfolio. Currency markets interpret Chinese investor confidence as validation, reducing risk premiums and stabilizing the rupee between 275-285 to the dollar. Yuan-rupee rates remain relatively stable, and Pakistan successfully rolls over Panda Bonds at maturity without stress.
Probability: 25%. This requires nearly everything to go right—sustained political stability, disciplined fiscal policy, favorable global conditions, and no major external shocks. Pakistan’s recent history suggests this optimistic scenario is possible but unlikely.
Base Case: Muddling Through With Elevated Risk
The Panda Bond provides temporary liquidity relief but doesn’t fundamentally alter Pakistan’s fiscal trajectory. Structural reforms progress slowly, growth remains anemic around 2-3%, and debt sustainability concerns persist. The rupee continues gradual depreciation to 300-320 against the dollar, with periodic volatility spikes. Yuan debt servicing becomes more expensive in local currency terms but remains manageable through reserve drawdowns and additional borrowing. Each Panda Bond rollover requires careful negotiation, and Pakistan alternates between IMF programs and bilateral support packages.
Probability: 50%. This represents continuity with Pakistan’s recent economic management—avoiding disaster but never quite achieving breakthrough. Currency pressure remains chronic but controlled.
Worst Case: Currency Crisis and Debt Distress
A confluence of negative shocks—oil price spike, political instability, major security incident, or adverse global monetary tightening—triggers a balance of payments crisis. Forex reserves plummet below $10 billion, the rupee crashes toward 350-400 to the dollar, and Pakistan faces difficulty servicing all external obligations. The yuan debt, now much more expensive in rupee terms, becomes a flashpoint. Chinese bondholders demand repayment while Pakistan lacks yuan or the dollars to convert. Emergency IMF support requires debt restructuring negotiations that include Chinese creditors. The rupee destabilizes further as market confidence collapses.
Probability: 25%. Pakistan has weathered similar crises before, but each one leaves the economy more vulnerable to the next. The addition of yuan-denominated obligations adds a new dimension of complexity to crisis management.
Policy Recommendations: What Pakistan Must Do Next
For Pakistani policymakers, several imperatives follow from this analysis:
First, develop a comprehensive currency hedging strategy immediately. Whether through derivative contracts, currency swaps with the People’s Bank of China, or natural hedges through yuan-earning initiatives, Pakistan cannot afford to remain naked to yuan-rupee exchange rate risk. The cost of hedging may be high, but the cost of not hedging could be catastrophic.
Second, accelerate export diversification with specific focus on yuan-earning opportunities. Pakistan should aggressively pursue export markets in China, structure trade deals denominated in yuan, and develop business relationships that create natural currency matches for debt obligations. This requires moving beyond traditional export sectors to identify value-added goods and services that Chinese markets demand.
Third, improve debt data transparency through regular reporting on currency composition, maturity profiles, and hedging positions. Markets punish opacity—Pakistan should proactively disclose Panda Bond terms, repayment schedules, and risk management approaches to build credibility with all investor classes.
Fourth, maintain IMF program discipline while managing Chinese creditor relationships. These aren’t inherently contradictory goals, but they require deft diplomacy and consistent policy implementation. Any perception that Pakistan is prioritizing one creditor group over another will trigger adverse market reactions.
Fifth, build yuan market infrastructure including deeper foreign exchange trading platforms, yuan clearing arrangements, and regulatory frameworks for yuan financial products. Pakistan cannot manage yuan exposure effectively without developed yuan financial markets.
For the international community, Pakistan’s Panda Bond experiment offers important data points about emerging market debt dynamics in an era of rising Chinese financial influence. Multilateral institutions should monitor outcomes closely, provide technical assistance for currency risk management, and work toward debt transparency standards that encompass all creditor types.
For China, sustainable lending practices require recognizing the currency risks that yuan-denominated debt imposes on non-yuan-earning economies. Beijing’s interest in yuan internationalization shouldn’t come at the expense of borrower debt sustainability. Currency swap facilities, technical support, and flexible rollover terms could help Pakistan manage yuan obligations while advancing China’s strategic goals.
The Verdict: High-Stakes Financial Statecraft
Pakistan’s $250 million Panda Bond represents high-stakes financial statecraft—a calculated bet that Chinese capital markets offer a viable alternative to traditional Western financing, with acceptable currency risks and manageable geopolitical implications. The rupee’s fate over the next three to five years will substantially determine whether that bet succeeds.
The optimist’s case holds merit: diversifying funding sources reduces dependence on any single creditor, accessing Chinese savings pools taps enormous liquidity, and deepening ties with the world’s second-largest economy makes strategic sense. Lower nominal interest rates could deliver real fiscal savings if managed properly.
But the skeptic’s concerns deserve equal weight: yuan-denominated debt exposes Pakistan to currency mismatches it’s ill-equipped to manage, deepens financial dependence on China when concentration risk is already elevated, and constrains monetary policy flexibility at a time when the economy needs maximum policy space.
The truth, as often, lies between extremes. Pakistan’s Panda Bond isn’t inherently catastrophic or miraculous—it’s a tool whose outcomes depend entirely on how policymakers wield it. Used alongside comprehensive economic reforms, prudent debt management, and strategic currency hedging, it could contribute to fiscal stabilization. Used as a short-term liquidity fix without addressing underlying structural weaknesses, it risks becoming another debt burden that hastens rather than prevents crisis.
For the rupee, the implications are clear: more variables now influence its value, more creditors have stakes in Pakistan’s economic performance, and more complexity surrounds debt sustainability analysis. Whether that complexity proves manageable or overwhelming will define not just Pakistan’s economic trajectory, but potentially set precedents for dozens of other emerging economies watching this experiment unfold.
As Finance Minister Aurangzeb prepares for the January issuance, he should remember that successful debt management isn’t measured by funds raised, but by obligations met. The Panda Bond’s true test won’t come at issuance, when Chinese investors enthusiastically buy Pakistani debt. It will come in 2029, when those bonds mature and Pakistan must deliver yuan it may or may not have, at exchange rates it cannot predict, in a geopolitical environment it cannot control.
That’s not an argument against issuing Panda Bonds—it’s an argument for approaching them with clear-eyed recognition of the risks, comprehensive management strategies, and realistic contingency planning. Pakistan’s currency stability, its fiscal sustainability, and ultimately its economic sovereignty depend on getting these calculations right.
The world is watching. So is the rupee market.
About the Author: This analysis draws on three decades of experience covering emerging market debt crises, currency dynamics, and Sino-Pakistani economic relations. The views expressed are the author’s own and do not represent any institutional affiliation.
Discover more from The Economy
Subscribe to get the latest posts sent to your email.


Economic Reforms
Argentina Economy 2026: Milei’s Fiscal Surplus, Inflation Drop to 29%, and What Comes Next

Argentina has achieved its first primary fiscal surplus in over a decade and cut inflation from 300% to a projected 29.4% in 2025. But the structural challenge of 2026 tests whether the transformation is real.No economy in the world has undergone a more dramatic reversal in such a compressed timeframe — and no economy in the world inspires more analytical caution about whether that reversal will hold.
Argentina enters the second half of 2026 having achieved something that eluded every previous government for over a decade: a primary fiscal surplus of 1.8% of GDP, maintained through austerity measures, deregulation, and structural reforms that President Javier Milei forced through against sustained political opposition. Inflation, which peaked near 300% in 2024 — one of the highest rates recorded by any major economy in modern history — is projected to fall to 29.4% in 2025 and 13.7% in 2026, a disinflation trajectory that most conventional economists did not believe was achievable without a social or political rupture.
The Policy Architecture That Produced the Turnaround
Milei‘s programme launched in December 2023 combined fiscal consolidation, the elimination of central bank monetary financing, and a managed exchange-rate regime that began with a sharp devaluation and continued with a gradual crawl to anchor inflation expectations. The approach was deliberately abrupt — a shock therapy designed to quickly eliminate the deficit that had sustained years of money printing and debt accumulation.
Deloitte’s 2026 global economic outlook characterises the result as “two years of profound macroeconomic adjustment that reshaped its policy framework and restored a degree of stability to an economy long challenged by chronic imbalances.” Monthly inflation, which had been running at rates exceeding 20% per month at the peak, had stabilised to approximately 2% by late 2025 — still elevated by international standards, but representing a near-complete dismantling of the hyperinflationary momentum that had been building for years.
The nominal anchors that have underpinned this disinflation include tight monetary policy from the central bank, the crawling peg exchange rate regime, and credible commitment to the fiscal surplus as a non-negotiable political line. The international investment community has responded: Argentine sovereign spreads have narrowed materially, and the country’s ability to access capital markets — previously constrained by its serial default history — has improved.
What Structural Reforms and Deregulation Have Changed
Beyond the macroeconomic stabilisation, Milei has pursued a broader structural reform agenda encompassing labour market deregulation, privatisation of state enterprises, elimination of energy subsidies, and reductions in public employment. These reforms carry distributional consequences — real wages fell sharply during the adjustment period, and social safety nets came under pressure — but Milei argued that the alternative was economic collapse rather than a managed adjustment.
The political durability of this programme remains the central uncertainty. Argentina has a long history of economic reform cycles that stabilise inflation and public finances in the short run before unravelling under political pressure, social protest, or an adverse external shock. The Iran war-related global slowdown represents exactly the kind of external headwind that has historically tested the resilience of Argentine stabilisation programmes — higher commodity prices support agricultural export revenues (a tailwind) but global demand uncertainty weighs on growth prospects.
The 2026 Challenge: Converting Stabilisation to Growth
Stabilisation is not growth. The Milei programme has restored macroeconomic credibility but the private investment and productivity gains that translate credibility into sustainable prosperity require additional time and policy continuity. Deloitte notes that the 2026 economic trajectory will rely on whether “other drivers” of demand beyond inventory rebuilding can sustain momentum — export diversification, foreign direct investment, and domestic consumption recovery all remain works in progress.
The comparison that Milei’s critics and supporters both invoke is Chile in the 1970s and 1980s, where a comparable shock therapy produced long-run macroeconomic stability at significant short-term social cost. The comparison that Milei’s critics prefer is the Argentine convertibility programme of the 1990s, which also achieved price stability and fiscal balance before collapsing in the 2001 default crisis. The distinction between the two outcomes depends on variables — debt dynamics, exchange rate flexibility, and external conditions — that will not be resolved in 2026.
The Lesson Argentina Offers Emerging Markets
Whether or not Argentina‘s transformation proves durable, the speed and scale of the disinflation has attracted analytical attention from economists studying how much inflation can be unwound through institutional commitment and fiscal discipline alone. The answer in Argentina’s case — from 300% to a projected 13.7% within approximately two years — challenges some prior assumptions about the minimum time horizon required for disinflation.
Deloitte’s global team places Argentina alongside France, Germany, and the US in their comparative country outlooks — a recognition that this formerly crisis-ridden economy is now generating analysis that other nations find instructive rather than merely cautionary. The hardest part of Argentina‘s economic story may not be what has already happened. It may be what sustaining the turnaround requires in 2027 and beyond.
Discover more from The Economy
Subscribe to get the latest posts sent to your email.
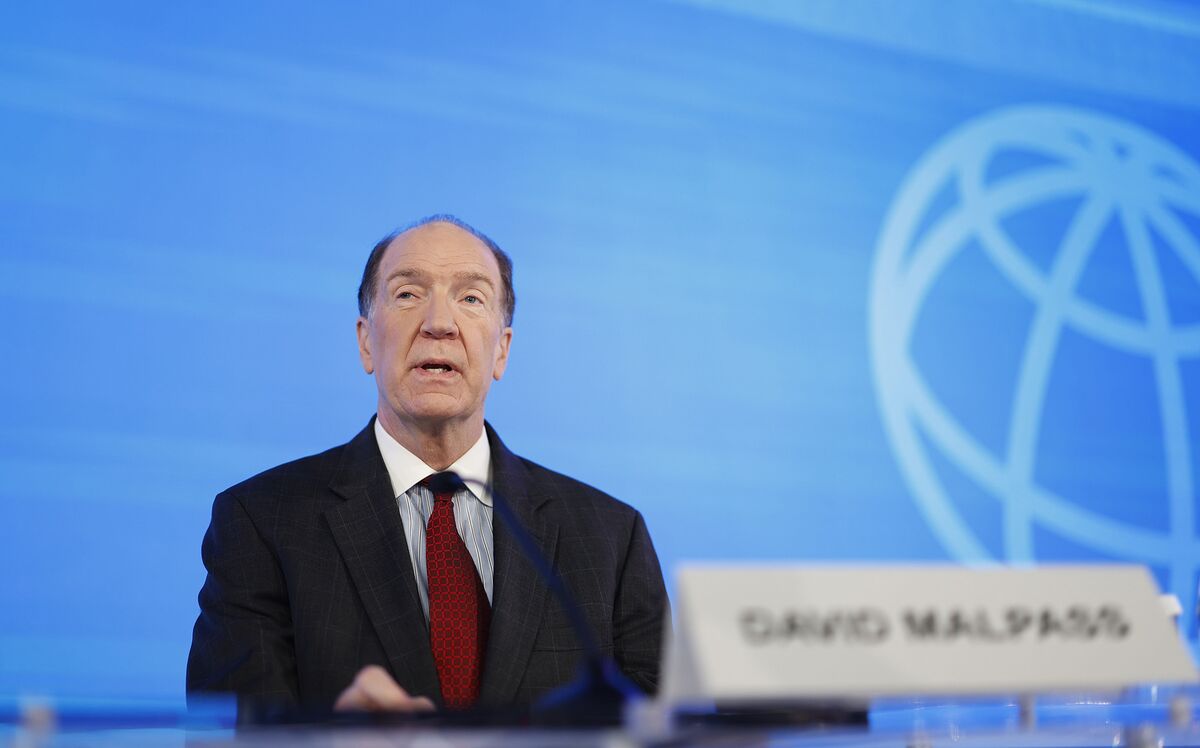
The World Bank projects global growth at 2.5% in 2026, the weakest since the pandemic, as the US-Iran conflict drives energy price spikes, inflation, and tighter monetary policy worldwide.The World Bank’s mid-2026 baseline carries a number that markets have had to absorb slowly: global GDP growth of 2.5% this year — the weakest since the pandemic — and the culprit is clear.
The World Bank’s latest Global Economic Prospects report identifies the US-Iran conflict that began in late February 2026 as the central shock reshaping the international economic outlook. Energy prices have risen sharply, inflation has re-accelerated across multiple continents, and central banks that had been on the verge of easing cycles have instead begun signalling hikes. The combination has compressed household incomes, widened fiscal deficits, and created a global policy dilemma — fight inflation or protect growth — that has no clean answer.
The Anatomy of the Slowdown
Emerging market and developing economies (EMDEs) face what the World Bank characterises as their weakest per capita income growth since the pandemic era. Growth is projected to decelerate across all EMDE regions in 2026, with the Middle East, North Africa, Afghanistan, and Pakistan bearing the worst damage given direct exposure to the conflict, higher energy import costs, and disrupted shipping. South Asia remains the fastest-growing EMDE region but has nonetheless seen forecasts revised downward.
The mechanism of transmission is threefold. Direct energy price exposure drives headline inflation and suppresses real consumer spending. Disruptions to Strait of Hormuz shipping — which handles roughly 20% of global oil trade — have compressed supply chains and added a risk premium to shipping costs more broadly. And the expectation of prolonged tighter monetary policy has pushed sovereign borrowing costs higher for indebted developing economies.
The Rio Times Global Economy Briefing captured the daily rhythm of the uncertainty: “Whether the US-Iran ceasefire holds. Renewed strikes would push oil higher and add to the inflation problem the Fed is already confronting.” As of the week of June 28, markets remained on edge about the durability of the ceasefire following reports of Iranian targeting of US military assets, which temporarily pushed Brent crude higher and triggered a brief equity sell-off before the market recovered.
Advanced Economies: Slow But Not Collapsing
Advanced nations face a different but related challenge: growth that was already below trend has been further dragged by energy costs and the policy response to inflation. Deloitte’s 2026 Global Economic Outlook noted that after years of disruptive US trade policy, the global trading system has partially reorganised — with numerous bilateral trade deals struck between non-US countries as an alternative to the US-centric framework.
France is projecting GDP growth of just 0.9% in 2026, according to Banque de France, with the contribution of net exports turning negative. Germany and Japan face their own exposure to the China Shock 2.0, as Chinese high-tech exports crowd into categories where both countries previously held competitive advantage. The US itself is navigating a narrowing current account deficit that reflects weaker domestic demand rather than export strength — an ambiguous signal that the Federal Reserve has explicitly flagged as complicating its rate decisions.
Fiscal Pressure and the Poverty Gap
One consequence of the conflict-driven slowdown that policy discussions often underweigh is the distributional impact on the world’s poorest economies. Low-income countries are projected to grow at 5.4% in 2026 — 0.3 percentage points below prior forecasts — as energy import costs consume fiscal space that would otherwise go to infrastructure, healthcare, and education. The World Bank projects that gains in per capita income, averaging 2.7% annually through 2027–28, will be “insufficient to significantly reduce poverty” given the breadth of the setback.
Fiscal pressures will limit governments’ ability to reduce food insecurity and create jobs — a combination the World Bank regards as a medium-term political risk as well as a humanitarian one. A newly identified Ebola outbreak in a low-income economy adds a further downside tail to the forecast.
The 2027 Recovery Thesis
The World Bank’s forward guidance is that a recovery should materialise in 2027–28, driven by an assumed decline in energy prices as supply adjusts and the conflict’s acute phase passes, and a rebound in global trade activity. That recovery is explicitly conditional on the ceasefire holding and conflict not escalating to involve Gulf oil infrastructure more directly. Recoveries are projected across all EMDE regions in 2027–28, but the pace will depend heavily on policy buffers — many of which were depleted fighting the post-pandemic inflation.
The upside scenario, acknowledged in the World Bank report, involves broader AI adoption lifting productivity and economic activity. Estimates of the productivity impact of AI vary “widely,” and the report notes that different scenarios “could lead to markedly different growth paths.” The AI tailwind is real but front-loaded in advanced economies, and access to the technology in lower-income countries remains constrained by infrastructure gaps and digital divides.
Discover more from The Economy
Subscribe to get the latest posts sent to your email.
In the autumn of 1956, British Prime Minister Anthony Eden received a phone call that ended an empire. The military operation in Egypt had succeeded. The Suez Canal was under Anglo-French control. And Washington told London to stop.
The United States, alarmed by Soviet threats of intervention and unwilling to see its Cold War allies destabilize the Middle East, forced Britain and France to withdraw. Within a decade, the British Empire was in managed retreat. The pound sterling—for over a century the world’s reserve currency—began its long slide. It took thirty years for the cycle to complete: George Soros finally drove the final stake through the Bank of England in 1992.
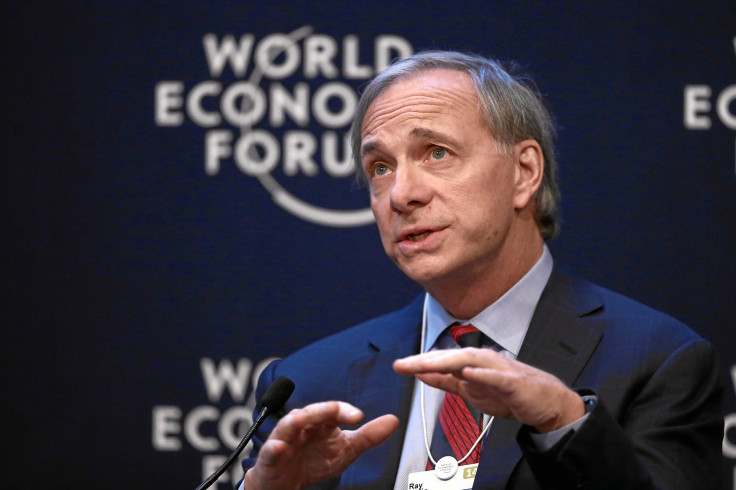
Ray Dalio did not write that history as a lesson about Britain. He wrote it as a warning about the United States in March 2026. And this week, Fortune published his most comprehensive articulation yet of why he believes America has just lived through its own version of that afternoon.
The Hormuz Parallel
The Bridgewater Associates founder has spent decades mapping what he calls the Big Debt Cycle—the rise and fall of reserve-currency empires over five centuries of financial history. The pattern, he argues, is consistent across cases: a dominant power overextends militarily over a critical trade route, suffers a loss of geopolitical face despite tactical success, and watches allies and creditors quietly recalibrate their confidence.
The 2026 U.S.-led bombing campaign against Iran fits that template, Dalio contends. The strikes degraded Iranian military capacity but did not topple the regime. The Strait of Hormuz—through which roughly a fifth of the world’s daily oil supply moves—was disrupted for weeks, sending energy prices surging and triggering a global inflation shock. Negotiations produced a stalemate rather than a decisive resolution.
“It all comes down to who controls the Strait of Hormuz,” Dalio wrote on X. The motivational asymmetry, he argued, was stark: for Iran’s leadership, the conflict was existential. For American voters, it was gas prices and midterm politics.
The Debt Foundation Is Already Cracked
What makes Dalio’s warning more than historical analogy is the fiscal backdrop against which the Hormuz crisis played out. U.S. federal debt crossed $39 trillion on March 18, 2026, with the latest trillion accumulating in record time—driven by tax reductions that eroded revenues and war expenditures that accelerated spending. All three major credit ratings agencies have now downgraded U.S. sovereign debt: S&P in 2011, Fitch in 2023, and Moody’s in May 2025.
The dollar’s share of global foreign exchange reserves has fallen to 56.9%, its lowest level since 1995 and down from a peak of 72% in 2001. Capital and technology spending by the top five U.S. mega-cap technology companies now represent roughly 30% of the entire S&P 500—a concentration of financial weight last seen half a century ago.
NVIDIA alone has surpassed a $5 trillion market capitalization, making it worth more than the entire GDP of most nations. Microsoft, Alphabet, Amazon, and Meta are projected to spend between $660 billion and $700 billion on AI infrastructure in 2026 alone. Dalio sees this as a dangerous divergence: financial markets increasingly levitating above an economy where households are under acute pressure, real wages have declined because of energy shock, and consumption—which accounts for 67% of U.S. GDP—faces structural headwinds.
The Dollar Isn’t Collapsing—Yet
Dalio is careful about what he is and is not claiming. Britain’s sterling did not collapse at Suez. It bled for three decades before the final break. The dollar today is still, as Wall Street analysts say, the “cleanest dirty shirt” in the global monetary wardrobe. No alternative reserve currency exists at anything close to the scale that would be required to replace it.
But the trajectory, Dalio argues, is what matters—not the current position. He draws a direct structural comparison: allies stopped deferring to London after Suez; creditors quietly reassessed British debt; the currency’s global role eroded steadily even as the British economy remained functional and respected. The analogy, he acknowledges, has limits. He frames this as contingent possibility, not inevitability.
Asian leaders Dalio has spoken with recently—he described spending a month in Asia, including ten days in China, in early 2026—have reached a collective conclusion that the U.S. can no longer credibly project military force across multiple theaters simultaneously. “It’s clear that the United States cannot fight a war,” he told Bloomberg Television in early June, citing public unwillingness to absorb casualties. He flagged Taiwan as the most acute potential flashpoint, noting that Beijing could trigger a global market crash by signaling a semiconductor blockade without firing a single shot.
What to Watch—and What to Hold
Dalio is not prescribing specific trades, but the historical pattern points in a consistent direction. In prior empire-transition periods, the indicators to monitor are: allies and creditors losing confidence, erosion of reserve currency status, selling of sovereign debt assets, and currency weakness—especially against gold.
Gold has already tracked that roadmap. Prices surged approximately 60% in the twelve months through March 2026. Goldman Sachs has revised its year-end 2026 gold price target to $4,900 per troy ounce—down from an earlier $5,400 forecast, reflecting the expectation that the Fed will not cut rates this year—but remains constructive on the long-term outlook.
“People don’t have, typically, an adequate amount of gold in their portfolio,” Dalio told CNBC in a February 2025 interview. “When bad times come, gold is a very effective diversifier.”
Dalio has identified the window between the 2026 U.S. midterm elections and the 2028 presidential election as a period of particular vulnerability, when debt pressures and intensifying political conflict over taxes and spending will converge. The outcome is not predetermined. Empires do extend their lives through what Dalio calls “life-extending” measures: prudent debt management, inflation control, and national unity. But with U.S. interest payments alone projected to exceed $1 trillion annually, those measures feel increasingly aspirational.
Discover more from The Economy
Subscribe to get the latest posts sent to your email.

AI Infrastructure Debt Bubble 2026: $570 Billion in Global Debt Issuance Raises Systemic Risk Alarm

Argentina Economy 2026: Milei’s Fiscal Surplus, Inflation Drop to 29%, and What Comes Next

Global Economic Growth 2026: World Bank Cuts Forecast to 2.5%

Gold Price 2026: J.P. Morgan Forecasts $6,000/oz as Inflation, Iran War

US Section 301 Tariffs 2026: 60 Countries Face 12.5% Duties on Forced Labour Goods

China Economy 2026: 87% Semiconductor Surge, Property Crisis

Kevin Warsh Fed 2026: Rate Hold, Hawkish Dot Plot, and the End of Forward Guidance

SpaceX IPO 2026: $2 Trillion Valuation, Retail Frenzy, and the Risks

Oracle AI Debt Crisis 2026: $130 Billion Gamble Triggers Worst Stock Crash Since Dot-Com Bust

Male Labor Force Participation Rate 2026: Why Men Are Leaving & Economic Impact

Trump Tariffs 2026: Economic Impact, Household Costs & Trade War Outlook

China Economy 2026: Export Boom Masks Property Crisis & Investment Slump

US Inflation 4% May 2026: Is the Worst Over? Fed, Oil Prices

AI Memory Chip Shortage 2026: Nvidia, Apple & What Comes Next

PwC China Partner Payouts Cut Amid Evergrande Audit Fraud

Broadcom Market Value Loss: Revenue Forecast Disappoints

Investors Pile Into Bullish Dollar Bets as ‘US Exceptionalism’ Trade Returns

Here’s How Much It’ll Cost You to Be Part of SpaceX’s Record-Breaking $75 Billion IPO

Nasdaq Tumbles 4% as Chip and Memory Stocks Sink: A $1.2 Trillion Wipeout

How to Fix Pakistan’s Debt Economy: A Structural Blueprint

Smash Capital Leads $200M Funding for Allen Control Systems

Democrats Draw a Red Line Around Military AI — And the Pentagon Is Already Pushing Back

New Investment Super-Cycle: AI, Green Energy & Re-Shoring

Xponential Fitness Franchise Lawsuit: The $3.97M Judgment

Middle East Conflict Oil Prices: The $4 Surge Explained

Grinding the Already Ground: Pakistan’s Inflation Crisis

The End of the Chatbot: Why OpenAI is Tearing Up Its Most Successful Product

Musk’s SpaceX Lines Up Retail Investors for Record IPO Allocation
-

 Markets & Finance6 months ago
Top 15 Stocks for Investment in 2026 in PSX: Your Complete Guide to Pakistan’s Best Investment Opportunities
-

 Analysis4 months ago
Top 10 Stocks for Investment in PSX for Quick Returns in 2026
-

 Analysis5 months ago
Brazil’s Rare Earth Race: US, EU, and China Compete for Critical Minerals as Tensions Rise
-

 Analysis4 months ago
Johor’s Investment Boom: The Hidden Costs Behind Malaysia’s Most Ambitious Economic Surge
-

 Banks5 months ago
Best Investments in Pakistan 2026: Top 10 Low-Price Shares and Long-Term Picks for the PSX
-

 Investment6 months ago
Top 10 Mutual Fund Managers in Pakistan for Investment in 2026: A Comprehensive Guide for Optimal Returns
-

 Global Economy6 months ago
15 Most Lucrative Sectors for Investment in Pakistan: A 2025 Data-Driven Analysis
-

 Global Economy6 months ago
Pakistan’s Export Goldmine: 10 Game-Changing Markets Where Pakistani Businesses Are Winning Big in 2025