
Global Economy
The Knowledge Economy Revolution: Ten Ways Education Is Rewriting the Economic Destiny of Developing Nations


In a weathered classroom in Kigali, 23-year-old Grace Uwimana debugs Python code on a refurbished laptop—one of thousands distributed through Rwanda’s digital literacy initiative. Five years ago, she was contemplating a career in subsistence farming. Today, she leads a 15-person software team building agricultural technology solutions, earning eight times her country’s median income. Her transformation isn’t exceptional—it’s emblematic.
Grace’s journey mirrors a profound economic metamorphosis unfolding across the Global South. While developed economies grapple with automation anxiety and stagnant productivity, developing nations from Dhaka to Bogotá are systematically converting educational investments into knowledge economy infrastructure. According to the World Bank’s latest data, education generates a 9% increase in hourly earnings for every additional year of schooling globally—a return that reaches 15% in emerging markets. As knowledge economies now contribute at least 7% of global GDP and grow at approximately 10% annually, the question isn’t whether education drives economic transformation, but how developing nations can accelerate this conversion at scale.
This isn’t cheerleading for an inevitable future. The path from classroom to competitiveness is fraught with financing gaps, infrastructure deficits, and persistent inequalities. Yet the evidence from Rwanda’s 9.7% GDP growth in early 2024, Vietnam’s digital transformation, and India’s $283 billion IT sector tells a compelling story: education has become the primary mechanism through which developing nations build comparative advantage in the 21st century.
1. Closing the Digital Skills Gap Drives Tech Sector Employment
The most immediate impact of education investment appears in technology employment statistics. India’s IT-BPM sector, which employed just 2.8 million people in 2010, now sustains 5.4 million workers directly and contributes 7.5% to national GDP—approximately $194 billion in export revenue in fiscal year 2024. This didn’t happen by accident. India’s emphasis on STEM education, with IT graduates reaching 68.44% employability rates compared to 54% for traditional engineering fields, created a talent pipeline that global companies couldn’t ignore.
The correlation extends beyond India. Rwanda’s investment in digital literacy—targeting 60% of adults by 2024—has positioned the country to attract technology investments that seemed unthinkable a decade ago. The World Bank’s recent $200 million Priority Skills for Growth and Youth Empowerment project aims to provide 200,000 vulnerable youth with market-demanded digital skills. Early results show promise: participants in similar programs have seen income increases of 700-800% within five years of completing digital training.
Vietnam’s National Digital Transformation Programme projects 400 million job opportunities globally will be driven by digital innovations by 2035. By emphasizing digital skills from primary education through tertiary institutions, Vietnam positioned itself as a manufacturing and technology hub beyond China’s shadow. The payoff? GDP growth projected at 6% annually through 2026, with technology and services driving the expansion.
The skeptic might argue that technology jobs represent a tiny fraction of developing nation workforces. True—but they create multiplier effects. Every tech job generates approximately 4.3 additional jobs in supporting sectors, from logistics to hospitality. More critically, digital skills enable productivity improvements across traditional sectors. Kenyan farmers using mobile payment systems and agricultural apps demonstrate how basic digital literacy transforms even subsistence economies.
2. Innovation Ecosystems Flourish Where STEM Education Thrives
Patent applications and startup density provide harder metrics of innovation capacity. Countries that invested heavily in STEM education over the past two decades now harvest measurable innovation outputs. China’s transition from manufacturing hub to innovation powerhouse correlates directly with tertiary STEM enrollment that expanded from 1.4 million in 2000 to over 10 million today.
The pattern repeats at smaller scales. Rwanda’s emphasis on STEM—with “Tech Enabled STEM Teaching” programs incorporating virtual reality, gamification, and robotics—created conditions for startup ecosystems to emerge where none existed. The country now hosts innovation hubs like kLab, which has supported over 1,000 digital entrepreneurs, many focused on solving local challenges through technology.
India’s innovation metrics tell a similar story. The country ranks 39th in the Global Innovation Index 2024, climbing six positions in a single year. This improvement coincides with expanded higher education capacity and improved quality metrics. With over 76 crore citizens (760 million) connected to the internet—supported by some of the world’s lowest data costs at $0.12 per gigabyte—India created conditions where educated entrepreneurs could rapidly scale innovations.
The returns materialize in concrete outcomes. Bangalore, Hyderabad, and Pune now compete with Silicon Valley for certain categories of technology talent. This wasn’t inevitable—it resulted from decades of investment in Indian Institutes of Technology, engineering colleges, and technical training institutions that produced over 1.5 million engineering graduates annually by 2024.
Critics correctly note that many developing nation startups struggle with scaling and that brain drain remains persistent. Yet the trend line suggests improvement. Foreign direct investment in developing nation innovation increased 8.6% annually from 2002-2022, outpacing the 4.4% growth in total global FDI. Investors increasingly recognize that well-educated populations in emerging markets offer innovation opportunities previously unavailable.
3. Foreign Direct Investment Follows Human Capital Concentrations
Multinational corporations deploy capital where they find skilled workforces. This isn’t ideology—it’s arithmetic. A 2024 Kearney survey of 536 senior executives at global corporations found that talent and skill of labor pools ranked as the strongest factor attracting FDI to India and Mexico. The message: education infrastructure increasingly determines capital allocation decisions.
The numbers substantiate this logic. Emerging markets drew $430 billion in foreign direct investment in 2022. Countries with robust education systems captured disproportionate shares. Singapore’s emphasis on STEM education—with electronics engineering graduates directly supporting a $2 billion sector—explains why it received $140 billion in FDI in 2022 despite its small population.
Cambodia’s emergence as a top FDI destination for 2024 correlates with its education reforms and 6.1% projected GDP growth. The Philippines, ranking second in FDI momentum, benefited from its educated, English-speaking workforce and saw public and private investment reinforced by opening renewable energy sectors to foreign capital.
The mechanism is straightforward: companies prefer to invest where local managers, engineers, and technicians can operate sophisticated facilities. Ethiopia and Rwanda attracted significant manufacturing FDI partly because they invested heavily in technical and vocational education training (TVET). Rwanda’s Digital Skills for Employability program, targeting 10,000 young people with software development, cybersecurity, and data analysis training, directly responds to investor requirements.
The counterargument deserves consideration: FDI to emerging markets has faced headwinds, declining 9% to $841 billion in 2023, with major Asian markets experiencing a 12% drop. India saw a 47% decline in FDI inflows in 2023. However, this reflects macroeconomic conditions—rising interest rates, geopolitical tensions—rather than education capacity. The long-term trajectory remains clear: the most educated emerging markets capture FDI during expansions and weather contractions better than peers with weaker human capital foundations.
4. Export Diversification Follows Education-Driven Comparative Advantage
Developing economies historically exported commodities and low-skill manufactures. Education enables more sophisticated exports. India’s transformation from textile-focused to IT services exports—reaching $224 billion in FY25—demonstrates how tertiary education creates new export categories entirely.
The World Bank documents this pattern globally: education expenditure correlates with export complexity and diversification. Countries that invested 4-5% of GDP in education over sustained periods now export knowledge-intensive services, advanced manufactures, and technology solutions rather than primarily raw materials or simple manufactures.
Vietnam’s export profile shifted dramatically as education improved. Once dependent on agricultural exports, Vietnam now produces sophisticated electronics, with companies like Samsung establishing major manufacturing operations contingent on availability of trained engineers and technicians. The transformation required sustained investment in technical education—Vietnam trained over 2,000 teachers in digital skills, though challenges remain in rural areas.
Bangladesh provides another example. Its education reforms, particularly expansion of tertiary enrollment from 6% to 20% over two decades, enabled its pharmaceutical sector to compete globally. Bangladeshi manufacturers now export medications to 157 countries, a feat impossible without chemists, quality control specialists, and regulatory experts produced by university programs.
Trade skeptics note that global value chains remain dominated by advanced economies and China. True, but the gap narrows. Developing nations with strong education systems increasingly capture higher-value segments of global value chains. Mexico’s automotive engineers design components locally rather than simply assembling parts designed elsewhere. Indian software architects create original solutions rather than merely executing specifications from foreign clients.
5. Demographic Dividends Materialize Only With Education Investment
Developing nations possess young populations—a potential economic advantage if those populations acquire skills. Without education, youthful demographics become liabilities rather than assets. The contrast between countries that invested in education versus those that didn’t illuminates this reality starkly.
South Asia, home to the world’s largest youth population, faces divergent outcomes. India’s 18 million annual emigrants reflect both opportunity and challenge—many leave for better opportunities, but the educated workforce remaining drives domestic growth. India’s emphasis on skills development through initiatives like the Skill India Digital Hub aims to provide continuous learning in AI, machine learning, and automation.
Kenya, with 35.6% of youth aged 16-30 categorized as neither in employment, education, nor training (NEET) in 2022, demonstrates the cost of insufficient education investment. Rwanda, facing similar demographic pressures but investing aggressively in education, shows an alternative path. Its Vision 2050 explicitly targets becoming a “Globally Competitive Knowledge-based Economy,” with education as the primary mechanism.
The gender dimension matters enormously. Rwanda’s NEET rate shows stark disparities: 41% for young women versus 29.9% for young men. Educational initiatives targeting young women—like Rwanda’s Digital Skills for Employability program with its strong focus on female participation—directly address this gap. Research consistently shows that educating women generates higher returns than educating men in developing economies, with multiplier effects on health, family planning, and next-generation education.
Employment statistics reveal education’s impact. In India, salaried jobs—the most stable employment category—account for only one in five workers, or 130 million people. However, in urban areas where education levels are higher, half of all jobs are salaried, concentrated in manufacturing, education, health, trade, and technology. The correlation between education and stable employment couldn’t be clearer.
6. Spillover Effects Transform Healthcare and Agricultural Productivity
Education’s returns extend beyond the sectors we typically associate with knowledge economies. Healthcare and agriculture—traditionally low-productivity sectors in developing nations—experience transformative improvements when educational levels rise.
The mechanism operates through multiple channels. Educated healthcare workers improve diagnostic accuracy and treatment outcomes. Research from the World Bank indicates that education correlates with significant reductions in infant mortality, maternal death rates, and disease prevalence. Countries that achieved universal primary education saw healthcare outcomes improve even before healthcare infrastructure investments took effect.
Agriculture demonstrates even more dramatic transformations. In Ethiopia, where 98% of agricultural workers haven’t completed primary school, productivity remains stagnant. Contrast this with India, where educated farmers increasingly use precision agriculture, weather forecasting apps, and modern farming techniques. The productivity gap between educated and uneducated farmers in the same regions often exceeds 200%.
Kenya’s agricultural transformation, supported by $500 million in pharmaceutical FDI from companies like Moderna, illustrates how education enables sectoral convergence. Vaccine production requires sophisticated cold chain logistics, quality control, and regulatory compliance—capabilities that emerge only with educated workforces.
Vietnam’s success in agricultural technology exports similarly reflects its education investments. Vietnamese agricultural engineers develop irrigation systems, develop crop varieties, and create supply chain solutions exported throughout Southeast Asia—capabilities unimaginable without sustained education investment.
The cross-sectoral learning matters profoundly. Engineers trained for IT sectors apply problem-solving skills to agricultural challenges. Healthcare workers with data analysis training improve epidemiological surveillance. These spillovers represent education’s compounding returns—benefits that narrow cost-benefit analyses miss entirely.
7. Gender Equality Through Education Unlocks Economic Participation
Perhaps no single intervention generates higher returns than educating women in developing economies. The World Bank estimates returns to female education in developing countries often exceed 15% annually—higher than returns to male education—yet girls and women face persistent barriers to educational access.
The economic logic is compelling. Educated women participate in formal labor markets at significantly higher rates. They earn substantially more than uneducated women—the wage premium for tertiary education exceeds 60% in most developing nations. They have fewer children, space births further apart, and invest more in their children’s education, creating intergenerational benefits.
Countries that achieved gender parity in education reaped measurable economic rewards. Vietnam’s emphasis on gender equality in education correlates with its manufacturing competitiveness—factory managers cite the educated female workforce as a key advantage. Bangladesh’s garment sector, which employs predominantly women and generates $40 billion in annual exports, became globally competitive partly because educational improvements enabled women to enter the workforce.
Rwanda’s aggressive pursuit of gender equality in education—with explicit targets in programs like Priority Skills for Growth and Youth Empowerment—reflects understanding that excluding women from education means foregoing roughly half of potential human capital. The country’s 9.7% GDP growth in 2024 coincides with near-gender-parity in secondary and tertiary enrollment.
The return on investment statistics tell the story quantitatively. The World Bank calculates that the public net financial returns from tertiary education average $127,000 for men versus $60,600 for women in OECD countries—but this gap reflects persistent discrimination and opportunity constraints rather than inherent differences in education’s productivity. In developing countries where discrimination gradually diminishes, returns to female education increasingly match or exceed returns to male education.
India’s persistently low female labor force participation—four in ten working-age women versus eight in ten men—represents massive foregone economic output. If India achieved female labor force participation rates comparable to China or Vietnam, GDP would increase by an estimated 25-30%. Education represents the most powerful lever for achieving this.
8. Climate Adaptation and Green Technology Require Educated Workforces
The climate crisis demands technological solutions that developing nations must both adopt and increasingly produce. This transition requires educated workforces capable of installing solar panels, maintaining wind turbines, designing climate-resilient infrastructure, and managing increasingly complex environmental systems.
Green FDI flows to emerging markets demonstrate the connection between education and climate action. Research from the IMF shows that closing the climate policy gap between the average developing economy and the average advanced economy would triple green FDI inflow-to-GDP ratios. However, these investments materialize only where educated workforces exist to implement green technologies.
Kenya’s $2.29 billion green hydrogen project in Mombasa, announced by Dubai-based AMEA Power, exemplifies this dynamic. The investment hinges on availability of engineers, technicians, and project managers capable of operating cutting-edge renewable energy infrastructure. Kenya’s investments in STEM education directly enabled this opportunity.
The Philippines’ opening of renewable energy sectors to foreign investment generated significant FDI partly because its educated workforce could staff renewable projects. Countries with weak education systems cannot credibly offer to host green manufacturing or renewable energy installations regardless of natural resource endowments or favorable geography.
India’s IndiaAI Mission, with $1.2 billion allocated for AI development, positions the country to develop climate solutions at scale. AI applications in agriculture, energy management, and climate modeling require educated workers across multiple disciplines. India’s IT sector provides the talent foundation for these initiatives.
The critique that developing nations shouldn’t bear climate transition costs has merit. However, green technology represents economic opportunity, not merely obligation. Countries with educated populations can manufacture solar panels, wind turbines, and electric vehicles for export while simultaneously reducing domestic emissions. The renewable energy sector is projected to create millions of jobs globally—disproportionately benefiting nations that invested in relevant education.
9. Governance Quality Improves With Education, Attracting Investment
Corruption indices and governance quality metrics consistently correlate with education levels. The mechanism operates through multiple channels: educated citizens demand better governance, educated bureaucrats implement policies more effectively, and educated business leaders operate more transparently.
Research published in the Journal of the Knowledge Economy demonstrates that education expenditure improves labor market outcomes only when institutional quality reaches sufficient thresholds. Conversely, improving education strengthens institutions. This creates a virtuous cycle: education improves governance, which attracts investment, which funds further education.
Rwanda’s dramatic transformation from post-genocide chaos to relative stability and rapid growth illustrates this dynamic. Sustained education investment, combined with governance reforms, created conditions for economic development. The country’s ability to attract $200 million from the World Bank for skills development reflects investor confidence in Rwanda’s institutional capacity—confidence grounded partly in its educated bureaucracy and leadership.
Singapore’s trajectory—from developing nation to advanced economy in a single generation—demonstrates how education and governance reinforce each other. Its strategic focus on STEM education created a skilled workforce, while good governance created stable conditions for leveraging that workforce. The result: $140 billion in FDI in 2022, a sum that exceeds many much larger economies.
India’s complex federal system creates governance challenges, but states with stronger education systems consistently outperform peers on corruption and institutional quality metrics. Karnataka and Maharashtra, home to major IT hubs, demonstrate higher governance quality than less-educated states—partly because educated populations demand accountability.
The counterargument—that autocratic regimes sometimes deliver rapid educational improvements—has historical precedent. However, long-term evidence suggests that sustained education gains require governance systems responsive to citizen demands. Education creates pressures for political participation and transparency that autocratic systems ultimately cannot accommodate.
10. Global Value Chain Integration Follows Education-Driven Capabilities
The most sophisticated global value chains—semiconductors, aerospace, pharmaceuticals, advanced manufacturing—concentrate in countries with highly educated workforces. Developing nations that achieved sufficient education levels now participate in these chains, capturing higher-value activities.
Mexico’s automotive sector illustrates this progression. Initially focused on basic assembly, Mexican facilities increasingly handle design, engineering, and advanced manufacturing because of investments in technical education. Major automakers now locate R&D facilities in Mexico, confident that local engineers can handle sophisticated development work.
Vietnam’s integration into electronics supply chains follows similar logic. Companies like Samsung didn’t just seek cheap labor—they required educated workers capable of operating automated production lines and quality control systems. Vietnam’s education investments made this feasible, transforming it into a major electronics exporter.
The semiconductor sector provides perhaps the clearest example. India’s recent emergence as a potential semiconductor hub reflects both government incentives and availability of educated engineers. The Production-Linked Incentive scheme for IT Hardware generated Rs. 10,014 crore ($1.14 billion) in production as of December 2024, but these investments materialized only because educated workers existed to staff facilities.
Research from McKinsey Global Institute identifies 18 “future arenas” that could account for one-third of GDP growth by 2040, including AI services, semiconductors, robotics, and advanced manufacturing. These sectors demand educated workforces. Countries that invested in education over the past two decades position themselves to capture these opportunities; those that didn’t face exclusion from the most dynamic sectors of the global economy.
The critique that global value chains remain dominated by advanced economies and China has validity. However, the composition of participants evolves. Twenty years ago, developing nations beyond a few Asian tigers captured negligible shares of sophisticated value chains. Today, India, Vietnam, Mexico, and others participate meaningfully. Education enabled this transformation.
The 2030 Inflection Point
These ten dynamics converge toward a conclusion that should alarm complacent policymakers and energize reformers: education increasingly determines which nations prosper in coming decades. The World Bank’s projections that developing economy growth will hold steady at 4% through 2026 masks enormous variation—between countries that invested in education and those that didn’t.
The arithmetic is unforgiving. The World Bank estimates a $97 billion annual financing gap exists for achieving Sustainable Development Goal 4 (quality education) by 2030, with Sub-Saharan Africa accounting for $70 billion of this shortfall. Countries that close these gaps through domestic resource mobilization, innovative financing, and improved efficiency will build knowledge economy capabilities. Those that don’t will watch their educated citizens emigrate to countries that did.
The brain drain phenomenon—with India losing 18 million people annually, close to double any other nation—reflects both the success of education investments and the challenge of creating sufficient domestic opportunities for educated workers. Countries must not only educate populations but also create economic conditions that retain talent.
The equity dimension matters profoundly. If education access remains concentrated among elites, knowledge economy benefits will similarly concentrate. Rwanda’s emphasis on reaching 200,000 vulnerable youth through skills programs recognizes this reality. Vietnam’s efforts to extend digital education to rural areas, while facing infrastructure challenges, similarly acknowledge that broad-based education creates more robust economic transformation than elite-focused systems.
The quality versus quantity debate persists, but the evidence increasingly suggests both matter. Countries need more people with basic literacy and numeracy, more with secondary education, more with tertiary credentials, and more with advanced technical skills. The World Bank’s finding that 9% of returns accrue for each additional year of schooling indicates that marginal gains accumulate at all education levels.
The financing mechanisms will require innovation beyond traditional models. The World Bank’s first debt-for-education swap with Côte d’Ivoire demonstrates one approach—reducing costly debt to free resources for school investment. Public-private partnerships, particularly in technical education, offer another path. India’s industry-led Skills Councils, connecting education providers with employer demands, show how private sector engagement can improve relevance.
The measurement challenge persists. Global education spending increased steadily over the past decade, but spending per child stagnated or declined in many low-income countries with growing populations. Efficiency matters as much as total expenditure. Evidence from Brazil, Colombia, Indonesia, and Uganda shows ways to boost student achievement through budget-neutral policies like granting spending autonomy to subnational governments and reducing teacher absenteeism.
The Irreversible Momentum
Perhaps the most remarkable aspect of education’s role in knowledge economy development is its compounding nature. Unlike infrastructure that depreciates or commodities that exhaust, education creates lasting capabilities that strengthen over time. A well-educated 25-year-old contributes productively for four decades, mentors younger workers, and educates the next generation.
This compounding creates path dependencies. Rwanda’s education investments over the past 15 years position it to attract FDI, develop innovation capacity, and integrate into global value chains over the next 15 years. These developments will generate resources for further education investment, creating a virtuous cycle. Countries that delayed education investment face increasingly difficult catch-up challenges as leaders accumulate advantages.
The geopolitical implications merit attention. As knowledge economies grow to represent ever-larger shares of global GDP, economic power will shift toward nations that successfully built human capital. This represents a more fundamental transformation than shifts in manufacturing capacity or resource endowments. Education-driven competitive advantages persist longer and prove harder to replicate than advantages based on low wages or natural resource deposits.
The question facing policymakers in 2025 isn’t whether education drives knowledge economy development—the evidence overwhelmingly confirms this relationship. The question is whether countries can summon the political will and mobilize the resources to invest adequately and equitably in education over sustained periods. The returns justify the investment by every financial metric, but education requires patient capital and long time horizons often incompatible with political cycles.
For developing nations, the imperative is clear: invest in education or accept permanent second-tier economic status. For international financial institutions, the priority equally obvious: finance education with the same urgency previously reserved for infrastructure, understanding that education represents the most productive infrastructure investment available. For individuals in developing nations, the message is straightforward: education remains the most reliable path to economic advancement and personal opportunity.
The knowledge economy revolution doesn’t eliminate geography, history, or other structural factors shaping economic outcomes. But it provides a mechanism through which nations can transcend historical disadvantages and create new competitive advantages. Rwanda, Vietnam, Bangladesh, and others demonstrate this possibility. Their success stories share a common thread: sustained commitment to education as the foundation for economic transformation.
As we approach 2030, the divergence between educated and undereducated developing nations will likely accelerate. The fourth industrial revolution, artificial intelligence, and accelerating technological change reward education more than previous economic transitions. Countries that secured educational foundations will adapt and thrive. Those that didn’t will struggle to participate meaningfully in the global economy’s most dynamic sectors.
Grace Uwimana in Kigali, debugging code on her laptop, represents not just Rwanda’s transformation but a template available to any nation willing to invest systematically in its people. The technology changes, the specific skills evolve, but the fundamental equation remains constant: education transforms human potential into economic capability, and economic capability determines prosperity in the knowledge economy that increasingly defines our era.
Discover more from The Economy
Subscribe to get the latest posts sent to your email.


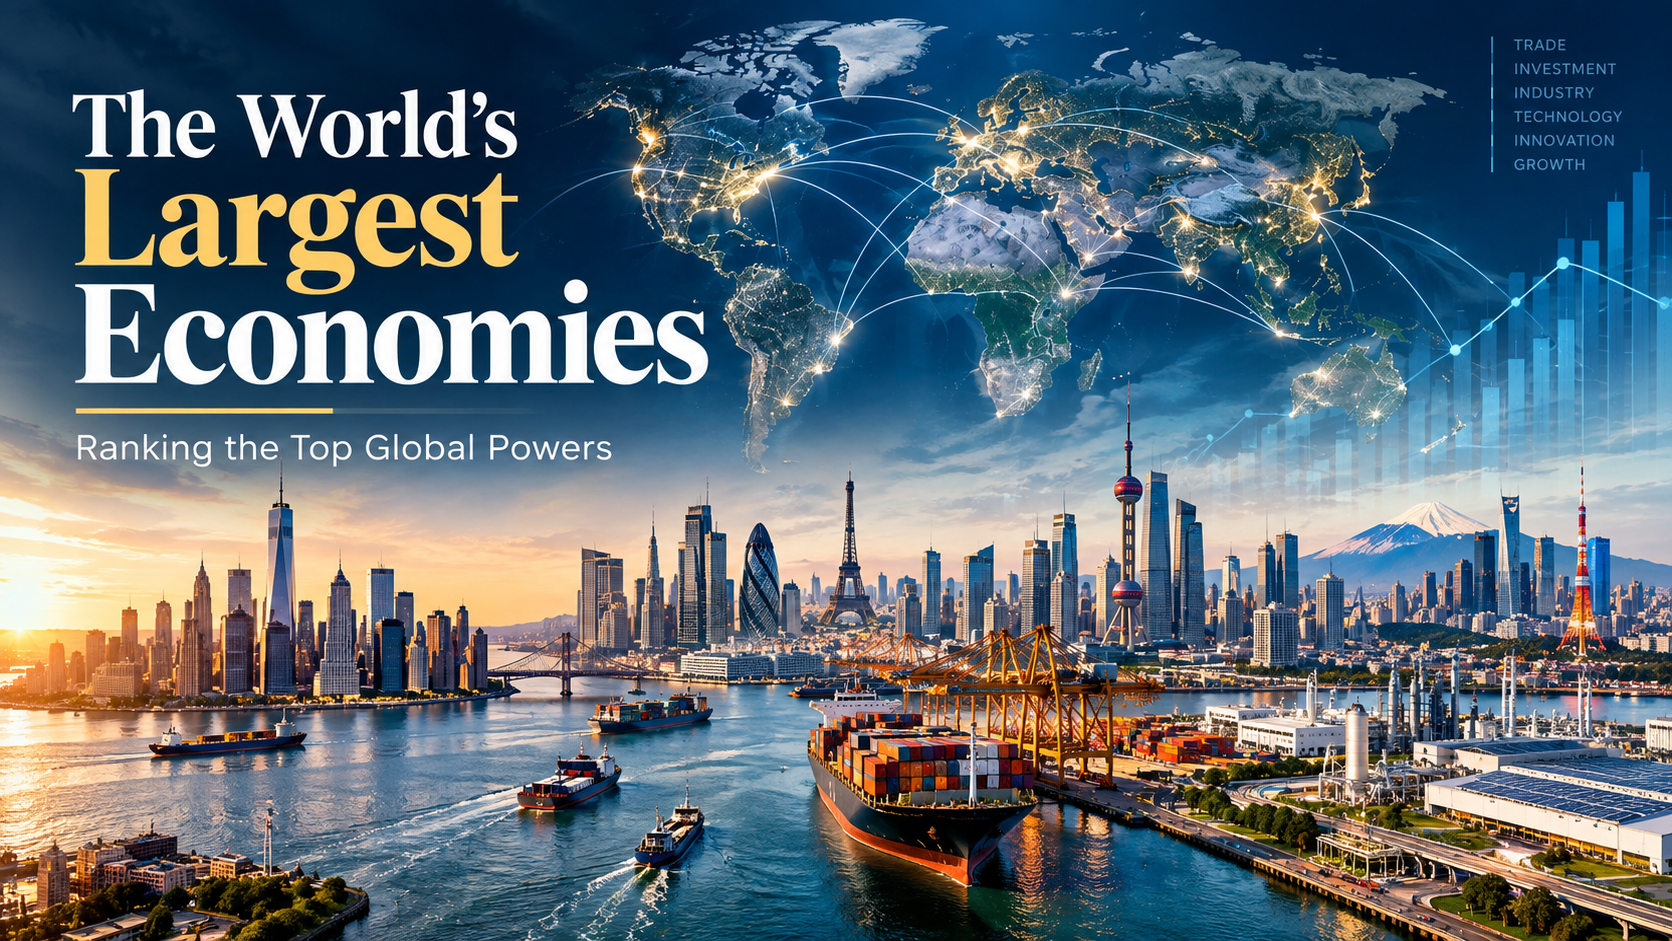
Executive Summary & Key Takeaways
The global macroeconomic landscape is defined by monetary policy shifts, technological supply chain realignments, and shifting demographic dynamics. According to official economic monitoring by the International Monetary Fund (IMF World Economic Outlook) and the World Bank Group, global GDP exceeds $125 trillion in nominal terms.
- Top Position: The United States maintains its position as the largest nominal economy at $32.38 trillion, driven by tech innovation, resilient consumer demand, and deep capital markets, as highlighted by the U.S. Bureau of Economic Analysis.
- PPP Leader: China dominates Purchasing Power Parity (PPP) with an output of $44.30 trillion, reflecting its massive industrial capacity and domestic consumption scale.
- European Dynamics: Germany holds the 3rd spot nominally ($5.45 trillion), navigating energy transitions and industrial re-tooling ahead of Japan ($4.38 trillion).
- Emerging Growth Engines: India leads among major emerging markets with real GDP growth expanding above 6.4%, positioning it to challenge top-tier positions over the coming decade.
Global GDP Ranking Matrix: Top 10 Economies
Below is a comparative breakdown of the top 10 economies, combining Nominal GDP, PPP GDP, Nominal GDP Per Capita, and Real GDP Growth Rates aggregated from primary statistical repositories including Eurostat and the Federal Reserve Economic Data (FRED).
| Rank | Country | Nominal GDP (USD)∣PPPGDP(Int.) | Nominal GDP Per Capita | Real Growth Rate (%) | Key Dominant Sector |
| 1 | United States | $32.38 Trillion | $32.38 Trillion | $94,430 | 2.32% |
| 2 | China | $20.85 Trillion | $44.30 Trillion | $14,874 | 4.41% |
| 3 | Germany | $5.45 Trillion | $6.41 Trillion | $65,303 | 0.79% |
| 4 | Japan | $4.38 Trillion | $7.26 Trillion | $35,703 | 0.72% |
| 5 | United Kingdom | $4.26 Trillion | $4.72 Trillion | $61,056 | 0.80% |
| 6 | India | $4.15 Trillion | $18.90 Trillion | $2,813 | 6.48% |
| 7 | France | $3.60 Trillion | $4.73 Trillion | $52,083 | 0.86% |
| 8 | Italy | $2.74 Trillion | $3.87 Trillion | $46,505 | 0.52% |
| 9 | Russia | $2.66 Trillion | $7.53 Trillion | $18,525 | 1.09% |
| 10 | Brazil | $2.64 Trillion | $5.23 Trillion | $12,313 | 1.91% |
In-Depth Profile of the Top 10 Economies
1. United States
- Nominal GDP: $32.38 Trillion | PPP GDP: $32.38 Trillion | Per Capita: $94,430
- Growth Rate: 2.32%
- Economic Analysis: The U.S. economy remains the world’s chief financial powerhouse. Its growth is underpinned by flexible labor markets, dominant technology giants, and capital allocation mechanisms tracked by the Federal Reserve System. The nation’s strength in artificial intelligence, software infrastructure, biotechnology, and energy self-sufficiency shields it against foreign supply chokepoints.
- Macro Risk: High national debt levels and elevated interest rates aimed at controlling service-sector inflation.
2. China
- Nominal GDP: $20.85 Trillion | PPP GDP: $44.30 Trillion | Per Capita: $14,874
- Growth Rate: 4.41%
- Economic Analysis: China is the world’s industrial foundation and the largest economy measured by Purchasing Power Parity. According to global trade documentation from UNCTAD, China leads in global manufacturing export volumes, electric vehicle supply chains, solar tech, and rare earth processing.
- Macro Risk: Real estate market structural adjustments, local government debt debt-servicing burdens, and demographic headwinds from an aging workforce.
3. Germany
- Nominal GDP: $5.45 Trillion | PPP GDP: $6.41 Trillion | Per Capita: $65,303
- Growth Rate: 0.79%
- Economic Analysis: Germany serves as the industrial core of the European Union. Supported by a specialized network of medium-sized industrial leaders (Mittelstand), Germany excels in high-precision engineering, chemical processing, and industrial machinery.
- Macro Risk: Transitioning away from historically cheap pipeline gas toward green hydrogen/renewable infrastructure, combined with structural labor shortages.
4. Japan
- Nominal GDP: $4.38 Trillion | PPP GDP: $7.26 Trillion | Per Capita: $35,703
- Growth Rate: 0.72%
- Economic Analysis: Known for technological innovation and precision manufacturing, Japan benefits from high foreign assets, advanced robotics, and heavy domestic research investment. Trade flows published by the OECD iLibrary highlight Japan’s high value-add manufacturing integration across Asia and the Americas.
- Macro Risk: Persistent demographic contraction and high public debt-to-GDP ratios managed by the Bank of Japan.
5. United Kingdom
- Nominal GDP: $4.26 Trillion | PPP GDP: $4.72 Trillion | Per Capita: $61,056
- Growth Rate: 0.80%
- Economic Analysis: The UK relies heavily on services, which account for roughly 80% of total economic output. London remains one of the world’s premier financial centers, excelling in asset management, insurance, cross-border fintech, and legal services.
- Macro Risk: Supply-chain re-anchoring post-Brexit and sluggish domestic capital investment rates.
6. India
- Nominal GDP: $4.15 Trillion | PPP GDP: $18.90 Trillion | Per Capita: $2,813
- Growth Rate: 6.48%
- Economic Analysis: India is the world’s fastest-growing major economy. Driven by rapid digital public infrastructure expansion, nationwide transport investments, and expanding manufacturing under global supply chain diversification strategies (“China + 1”), India is rapidly scaling up both domestic consumption and industrial exports.
- Macro Risk: Job creation for a massive young workforce and infrastructure expansion bottlenecks.
7. France
- Nominal GDP: $3.60 Trillion | PPP GDP: $4.73 Trillion | Per Capita: $52,083
- Growth Rate: 0.86%
- Economic Analysis: France operates a diversified economy featuring strong tourism, aerospace (Airbus), luxury consumer conglomerates (LVMH, Kering), and nuclear energy generation. Its low-carbon electricity grid provides cost-stability advantages over neighboring industrial markets.
- Macro Risk: Public deficit management and rigid labor market structural adjustments.
8. Italy
- Nominal GDP: $2.74 Trillion | PPP GDP: $3.87 Trillion | Per Capita: $46,505
- Growth Rate: 0.52%
- Economic Analysis: Italy’s economy relies on an export-oriented manufacturing base in its northern regions, specializing in luxury automobiles, industrial automation, pharmaceutical production, and high-end textiles.
- Macro Risk: Public sector debt servicing and structural regional economic disparities between North and South.
9. Russia
- Nominal GDP: $2.66 Trillion | PPP GDP: $7.53 Trillion | Per Capita: $18,525
- Growth Rate: 1.09%
- Economic Analysis: Russia’s economy is anchored by natural resources, defense-industrial state expenditures, and energy commodity exports to non-Western trading partners across Eurasia and Africa.
- Macro Risk: International financial restrictions, currency volatility, and sanctions-driven technology supply constraints.
10. Brazil
- Nominal GDP: $2.64 Trillion | PPP GDP: $5.23 Trillion | Per Capita: $12,313
- Growth Rate: 1.91%
- Economic Analysis: Brazil dominates Latin America’s economic landscape, propelled by agricultural exports (soybeans, beef, sugar), iron ore extraction via Vale, deepwater oil exploration, and a sophisticated fintech banking sector.
- Macro Risk: Fiscal deficit volatility and vulnerability to global commodity price cycles.
Methodology: How Economic Output is Measured
Evaluating economic scale requires understanding three primary economic indicators:
                  ┌────────────────────────────────────────────────┐
                  │          Gross Domestic Product (GDP)          │
                  └───────────────────────┬────────────────────────┘
                                          │
            ┌─────────────────────────────┼─────────────────────────────┐
            ▼                             ▼                             ▼
┌───────────────────────┐     ┌───────────────────────┐     ┌───────────────────────┐
│     Nominal GDP       │     │        PPP GDP        │     │    GDP Per Capita     │
├───────────────────────┤     ├───────────────────────┤     ├───────────────────────┤
│ Expressed in current  │     │ Adjusted for local    │     │ Total output divided  │
│ USD exchange rates.   │     │ purchasing power.     │     │ by population.        │
│ Identifies global     │     │ Reflects internal     │     │ Measures average      │
│ capital power.        │     │ economic scale.       │     │ living standard.      │
└───────────────────────┘     └───────────────────────┘     └───────────────────────┘
- Nominal GDP (Current Prices in USD): Measures the market value of all final goods and services produced within a country in a given year. Nominal values convert domestic output using prevailing market exchange rates. While ideal for assessing international purchasing power, it fluctuates with currency market swings.
- Purchasing Power Parity (PPP): Adjusts for relative price levels and local living costs using an international basket of goods. According to data methodology guides from the Bank for International Settlements (BIS), PPP offers a realistic view of domestic production capability and domestic consumer capacity.
- GDP Per Capita: Divides total economic output by total population. This distinguishes between sheer economic scale (e.g., India or China) and individual living standards (e.g., Switzerland, Luxembourg, or the United States).
Key Takeaways for Global Economic Trends
- The Shift Toward Multipolar Growth: Asia’s expanding market share—led by China, India, Indonesia, and Vietnam—continues to outpace global growth averages, shifting the center of gravity of manufacturing and consumption.
- Energy Transition Dynamics: Nations with sovereign clean tech supply chains (China) or independent nuclear grids (France) gain structural cost advantages over those dependent on imported fossil fuels.
- Demographics vs. Productivity: Aging populations across Europe and East Asia mean future expansion depends heavily on capital deployment into automation, AI infrastructure, and high-margin service exports.
Discover more from The Economy
Subscribe to get the latest posts sent to your email.

Why did Wendy’s stock fall in 2026? The Wendy’s Company withdrew its full-year 2026 financial outlook and cut its dividend to help fund a turnaround effort after reporting second-quarter results showing global systemwide sales down 6.5% year-over-year, according to the company’s official second-quarter earnings release. The decline was driven by an 8.2% drop in U.S. sales, only partially offset by 3.4% growth internationally — a split that has defined the company’s story for most of the year.
New leadership has been blunt about the scale of the problem. President and CEO Bob Wright, who returned to the company to lead the turnaround, said directly that traffic, the brand’s value proposition, and franchisee economics were not meeting expectations, while outlining five specific areas of focus: rebuilding a quality menu at compelling value, marketing that drives demand, operational excellence, a stronger digital experience, and turning restaurants themselves into a growth engine.
The Numbers Behind the Turnaround
Featured Snippet Target: Wendy’s Q2 2026 results showed revenue of $571 million, net income of $32.6 million, and adjusted EBITDA of $124.1 million, but global systemwide sales fell 6.5% year-over-year — driven primarily by an 8.2% U.S. sales decline — prompting the company to withdraw its full-year guidance and cut its dividend.
The pressure had been building for several quarters before the Q2 announcement. In the first quarter of 2026, Wendy’s reported revenue of $541 million (up 3.3% year-over-year) but adjusted earnings per share of just $0.12 — down 40% from $0.20 in the same quarter of 2025 — as global systemwide sales fell 5.5% on a constant-currency basis, driven by a 7.8% drop in U.S. same-restaurant sales, according to financial analysis from TIKR. Management attributed part of that decline to severe winter weather in January and February, alongside intentional operating-hour reductions tied to the company’s store-footprint optimization initiative, known internally as Project Fresh.
International growth has been the one consistent bright spot. Wendy’s international business delivered 6% systemwide sales growth in the first quarter, powered by new restaurant development in the Philippines and Mexico — a pattern that continued into the second quarter, when international sales grew 3.4% even as the U.S. business contracted sharply.
Is Project Fresh Actually Working?
Company-operated restaurants that have fully implemented the Project Fresh operational playbook outperformed the broader U.S. system by 310 basis points in same-restaurant sales during the first quarter, according to comments from Interim CEO and CFO Ken Cook on the Q1 earnings call — an early data point management has pointed to as evidence the turnaround approach works where it has actually been rolled out. On the subsequent Q4 earnings call, Cook told analysts that October marked the low point for the business, with sequential improvement through late 2025 and early 2026, before adverse January weather disrupted that recovery trend, according to call notes compiled by StockStory.
The restructuring has a real physical footprint: roughly 5% to 6% of U.S. Wendy’s locations are set to close, with most of those closures concentrated in the first half of 2026 — building on 240 U.S. location closures the chain had already carried out the prior year, according to reporting picked up by Fast Company. Franchisee buy-in has been a recurring analyst question on earnings calls, with Cook emphasizing frequent communication and flexibility as franchisees weigh whether the new operational playbook genuinely improves their unit economics.
What Wall Street Thinks
Analyst sentiment on Wendy’s stock has remained genuinely split rather than converging on a clear verdict. Coverage compiled by Barchart noted that the stock trades at roughly 12 times current-year earnings and under eight times 2030 forecasts — a valuation implying significant potential upside if the turnaround succeeds — but also flagged that the number of analysts covering the stock rose 30% in the first quarter of 2026 alone, with the resulting consensus landing on a “Hold” rating and a roughly even split between Buy and Sell recommendations. That’s an unusually wide disagreement for a large-cap consumer stock, reflecting genuine uncertainty about whether management’s turnaround playbook can offset structural share losses to competitors such as McDonald’s.
Rising beef costs added a separate layer of margin pressure through the first half of the year. Wendy’s Chief Accounting Officer and Global Head of FP&A Suzanne Thuerk indicated commodity inflation would run in the high single digits during the first half of 2026 due to double-digit beef inflation, before moderating to a low single-digit pace in the back half of the year as the company began cycling past the prior year’s elevated beef costs.
The Bottom Line
Wendy’s 2026 story is a genuine turnaround-in-progress rather than a settled outcome in either direction. The company has been transparent about the scale of its U.S. traffic and value-proposition problems, has a specific operational framework (Project Fresh) with early data suggesting it improves results where implemented, and has an international business that continues to grow steadily even as the U.S. core contracts. But the dividend cut, withdrawn guidance, and split analyst sentiment all signal that management itself is not yet confident enough in the pace of recovery to make firm forward commitments.
Next step: Investors and franchise-industry watchers should track same-restaurant sales trends specifically at fully-converted Project Fresh locations in upcoming quarters — that cohort, more than the blended company-wide average, is the clearest read on whether the turnaround strategy itself is working.
Discover more from The Economy
Subscribe to get the latest posts sent to your email.
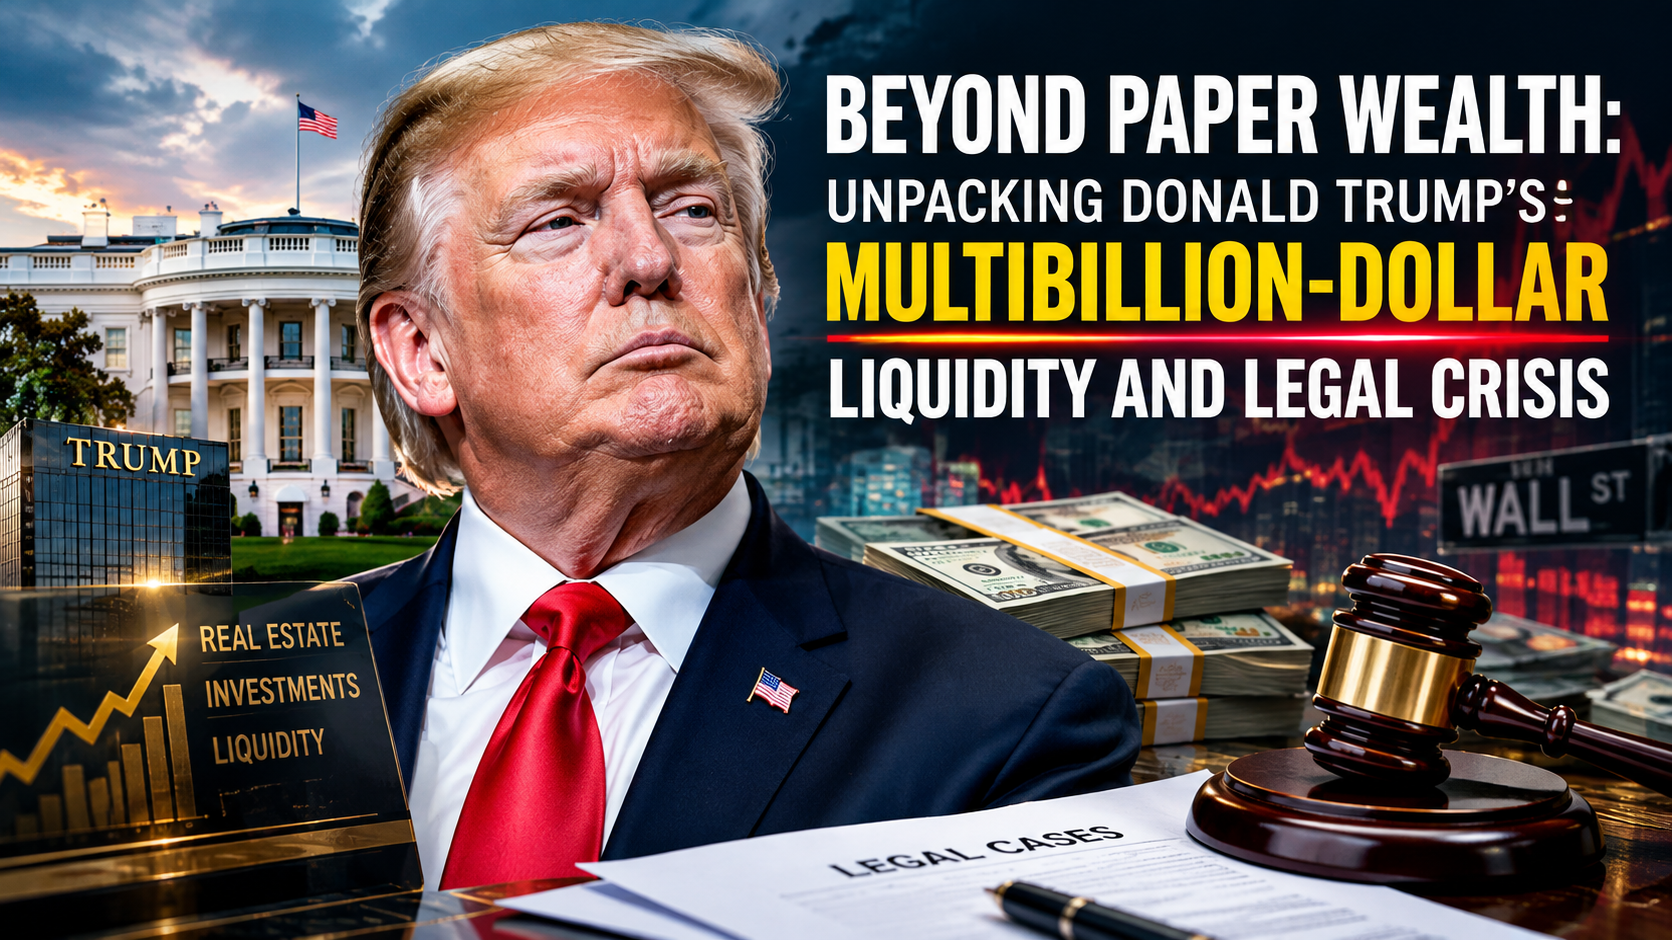
Former President Donald Trump’s financial balance sheet is undergoing unprecedented pressure. While his estimated net worth fluctuated dramatically following the public listing of Trump Media & Technology Group (TMTG), his real-world liquidity faces severe headwinds from court-ordered judgments, mounting interest, commercial real estate debt maturities, and escalating legal fees.
Understanding the magnitude of Trump’s financial landscape requires separating volatile paper equity from available cash, real estate assets, and legal liabilities.
1. The $454 Million Civil Fraud Judgment and Appeal Bond Dynamics
The largest immediate financial threat stems from New York State Supreme Court Judge Arthur Engoron’s ruling in the civil fraud lawsuit brought by New York Attorney General Letitia James.
- Initial Ruling: Trump was found liable for systematically inflating asset values to secure favorable loan terms and insurance rates.
- Financial Penalty: The court ordered disgorgement of approximately $354 million in ill-gotten gains, plus pre-judgment interest that pushed the initial obligation past $454 million.
- Accruing Interest: Statutory post-judgment interest accrues at 9% per annum (roughly $112,000 per day), steadily increasing the total debt while appeals proceed.
According to legal reporting from [Reuters], securing an appeal bond proved exceptionally difficult. Over 30 surety companies rejected Trump’s requests to guarantee the full amount without liquid collateral, as insurers overwhelmingly refuse to accept real estate as bond backing. An appellate bench subsequently allowed a reduced bond of $175 million, which Trump posted via Knight Specialty Insurance Company to stay enforcement while the appellate division reviews the merit of the ruling.
2. E. Jean Carroll Defamation Verdicts: $88.3 Million in Liability
In addition to state-level regulatory judgments, federal jury decisions in New York have created substantial financial commitments:
| Case | Jury Award | Status / Collateral Mechanism |
| Carroll I (Sexual Abuse & Defamation) | $5.0 Million | Placed in court-monitored escrow during appeal. |
| Carroll II (Defamation) | $83.3 Million | Secured via an $91.6 million appeal bond posted through Federal Insurance Co. (Chubb). |
As detailed by [CNBC], these judgments require collateralization regardless of ongoing appeals. Trump was forced to lock up cash or liquid securities to secure these bonds, directly contracting his available operational liquid reserves.
3. Trump Media (DJT): Paper Billions vs. Realizable Cash
The public debut of Trump Media & Technology Group Corp. (NASDAQ: DJT) via a SPAC merger briefly added billions to Trump’s paper net worth. However, financial analysts at [Forbes] note that transforming paper valuation into usable cash presents critical structural obstacles:
- Fundamental Disconnect: TMTG’s multi-billion-dollar valuation stands in stark contrast to its underlying balance sheet, which showed modest revenues against notable operational expenses.
- Market Impact of Cashing Out: Trump owns roughly 57% to 60% of the company. Any large-scale liquidation of his shares to cover cash liabilities risks signaling a loss of confidence, potentially triggering a sharp price decline before significant volume can be sold.
- Lock-Up Agreement Expirations: While lock-up restrictions initially prevented insider selling, the expiration of these periods subjects the stock to heightened market volatility and short-selling pressure.
4. Commercial Real Estate Exposure & Refinancing Headwinds
A substantial portion of Trump’s traditional wealth remains tied up in commercial real estate—a sector currently suffering from high interest rates, declining office occupancies, and tightened banking credit standards.
Trump Asset Portfolio Exposure
├── Commercial Properties (High debt exposure / Refinancing risk)
│   ├── 40 Wall Street (NYC)
│   └── Trump Tower Commercial Space (NYC)
├── Golf Courses & Resorts (Stable cash flow / High capital expenditure)
└── Brand Licensing & Cash Equivalents (Encumbered by legal escrow/bonds)
Key commercial debt obligations reported by [The Wall Street Journal] highlight specific vulnerabilities:
- 40 Wall Street (New York): The property’s debt was placed on lender watchlists in recent years due to rising vacancy rates, falling net operating income (NOI), and elevated ground-lease costs.
- Refinancing Risks: With commercial mortgage-backed securities (CMBS) debt maturing across several properties, refinancing in a high-rate environment significantly increases debt service payments, squeezing operational margins.
5. Political Action Committee (PAC) Legal Expense Drain
Legal fees have consumed a massive share of Trump’s available political fundraising funds. As documented by [The New York Times], Donald Trump’s leadership PAC, Save America, has spent tens of millions of dollars funding legal defense fees for the former president and co-defendants across multiple jurisdictions.
This drain on donor funds creates a dual liability:
- It diverts resources away from political field operations and advertising.
- It exposes the campaign structure to ongoing cash demands as criminal and civil proceedings drag on.
Financial Outlook & Solvency Risks
Trump’s asset portfolio is characterized by a strong imbalance between illiquid real estate equity and immediate cash demands.
Total Cash Demands (Judgments + Bonds Posted) : ~$260M+ Cash Restricted/Encumbered
Pending Liabilities (If Appeals Fail)        : ~$540M+ Total Direct Civil Cash Penalties
While Trump’s overall asset base—including golf courses, residential property, and brand licensing—remains valuable, his immediate solvency depends heavily on appellate court decisions. Should the appellate courts uphold the full civil fraud judgment without reduction, the need for immediate cash could force distressed asset sales or high-cost private equity financing, fundamentally altering the Trump Organization’s financial baseline.
Discover more from The Economy
Subscribe to get the latest posts sent to your email.

Silver Price Today: Why the Xi-Trump AI Standoff Is Fueling a Safe-Haven Rally

Citibank & Dólar Estadounidense: Forex Playbook After the Xi-Trump Truce

How the Trump-Xi White House Summit Is Reshaping Mortgage Rates Today for Real Estate Investors

Indonesia Navigates Mega-Project Risks as China and Russia Eye the 2,772km Trans-Kalimantan Railway

Trump-Xi 2026 Summit Takeaways: The Trade Truce, Taiwan, and the AI Divide

Solar Panel Installation Cost in 2026: Why the Math Changed Overnight

Business Insurance: What Coverage You Actually Need and What It Costs in 2026

Auto Insurance Quotes: How to Get the Lowest Rate Without Losing Coverage

Huntington Online Banking: Full Features, Fees, and How It Compares in 2026

Apply for a Bank Account Online: What You Need and How Long It Actually Takes

World’s Largest Economies: Ranking the Top Global Powers

Business Loan: A Complete 2026 Guide to Rates, Types, and Qualifying

Fast Invoice Factoring: How to Turn Unpaid Invoices Into Cash Within 24 Hours

Investment Banking Services: What They Cost and How to Choose the Right Firm in 2026

Top 30 Stocks for Investment in PSX for Massive ROI in 2026

SpaceX Starship Flight 14: First Orbital Attempt & Starlink V3 Launch Explained

Oil Prices Break $100 in 2026: Middle East Conflict & Energy Markets

BRICS+ Cross-Border Payments 2026: Interoperability Explained

AI Chip Stocks 2026: The Best Semiconductor Investments Beyond Marvell

Fidelity Investments Review 2026: SPAXX Yields & Zero-Fee Funds

Tween Back-to-School Trends 2026: What’s Driving the $85B Season

10-Year Treasury Yield Hits 4.80%: What It Means for Rates & Portfolios

Shein Clothes Quality & Safety in 2026: What Lab Tests Show

China’s US$10.8 Billion Trade Shortcut: Why the Pinglu Canal Matters

MRVL Earnings 2026: Why Marvell Sank Despite Beating Estimates

IMF & World Bank 2026 Global Economic Outlook: Growth, Inflation, Debt

Middle East War Economics 2026: Oil Prices & Energy Markets

High-CPM Finance Niches 2026: Publisher Monetization Blueprint
-

 Markets & Finance9 months ago
Top 15 Stocks for Investment in 2026 in PSX: Your Complete Guide to Pakistan’s Best Investment Opportunities
-

 Analysis7 months ago
Johor’s Investment Boom: The Hidden Costs Behind Malaysia’s Most Ambitious Economic Surge
-

 Analysis7 months ago
Top 10 Stocks for Investment in PSX for Quick Returns in 2026
-

 Banks8 months ago
Best Investments in Pakistan 2026: Top 10 Low-Price Shares and Long-Term Picks for the PSX
-

 Analysis8 months ago
Brazil’s Rare Earth Race: US, EU, and China Compete for Critical Minerals as Tensions Rise
-

 Investment9 months ago
Top 10 Mutual Fund Managers in Pakistan for Investment in 2026: A Comprehensive Guide for Optimal Returns
-

 Global Economy9 months ago
15 Most Lucrative Sectors for Investment in Pakistan: A 2025 Data-Driven Analysis
-

 Global Economy9 months ago
Pakistan’s Export Goldmine: 10 Game-Changing Markets Where Pakistani Businesses Are Winning Big in 2025