
Analysis
Pakistan Economic Challenges: Strategic Solutions for 2026

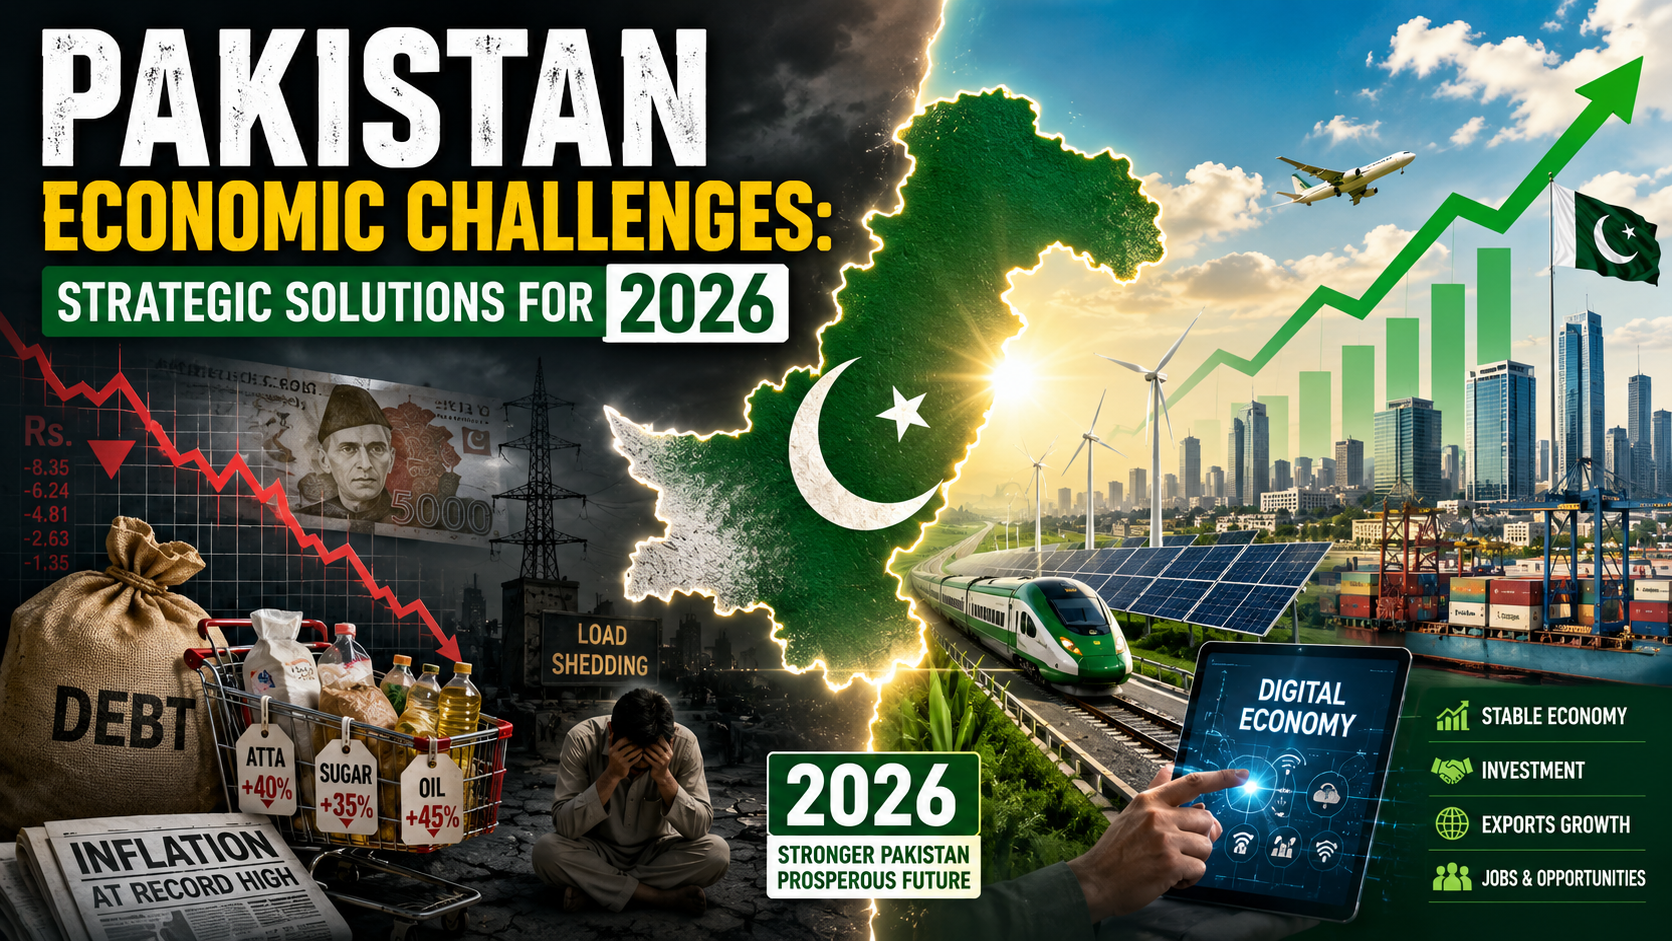
Pakistan has now signed 25 arrangements with the International Monetary Fund. Twenty-five. The first was in 1958, when Eisenhower was in the White House and Pakistan was barely a decade old. The latest — a $7 billion Extended Fund Facility agreed in September 2024 — is still live. Six and a half decades of conditionality, austerity, and restructuring, and the country finds itself back at the same window, negotiating the same terms, hearing the same lectures about fiscal discipline. At some point, the question stops being “what does the IMF want?” and starts being “why hasn’t anything worked?”
The answer is structural. It has always been structural.
The Weight of a Broken Fiscal Architecture
Pakistan’s economic challenges in 2026 did not arrive suddenly. They accumulated across generations of policy choices — or, more precisely, policy deferrals. The IMF, in its April 2026 Fiscal Monitor, estimated gross government debt at 70.1% of GDP for the current fiscal year, while debt servicing alone consumes an estimated 50% or more of total federal revenues. Interest payments in the first half of FY26 reached Rs3.56 trillion — more than double the combined allocations for defence and the entire Public Sector Development Programme.
To understand the trap, consider the arithmetic. Pakistan’s tax-to-GDP ratio reached 10.3% in FY25 for the first time in over a decade, collecting Rs11.744 trillion — a 26.3% year-on-year jump. That’s a genuine improvement. Yet the IMF is pushing for a target of Rs15.6 trillion in FY26-27, tied to an 11.3% tax-to-GDP ratio. Pakistani officials, with some justification, consider 10.7% a more realistic benchmark. The gap between what multilateral creditors demand and what a fragile political economy can deliver has always been Pakistan’s essential problem.
It isn’t simply a revenue problem. It’s a structural misalignment between the state’s obligations and its capacity — compounded by an energy sector that haemorrhages money, an informal economy that pays almost nothing, and an export base so narrow that a single global disruption can fracture the current account.
That said, something is shifting. The current government, under Finance Minister Muhammad Aurangzeb, has taken reform more seriously than most of its predecessors. The FBR is digitising. The rupee has stabilised. Inflation, once above 30%, is descending toward the IMF’s 2026 projection of 7.2%. For the first time in years, the conditions exist for a strategic break from the cycle — if the political will holds.
Why Pakistan’s Economic Challenges Demand Structural, Not Cosmetic, Reform
The core of Pakistan’s problem can be stated plainly: the state does not collect enough, spends what it collects on servicing old debt, and leaves almost nothing for the investment that could generate tomorrow’s revenue. The informal economy accounts for 35–40% of GDP and remains almost entirely outside the tax net. Indirect taxes — sales levies, petroleum duties — constitute more than 60% of total revenue collection, disproportionately burdening lower-income households while leaving wealthy landowners, large retailers, and professionals largely untouched.
What reforms does the IMF require from Pakistan? The Fund’s March 2026 End-of-Mission Statement reiterated four familiar priorities: fiscal consolidation, tight monetary policy, energy sector reform, and managing external financing pressures. Specifically, the IMF has demanded that the FBR expand the tax base by pulling agriculture and services — both historically under-taxed in Pakistan — into the formal revenue net, while simultaneously pressing for the privatisation of loss-making state-owned enterprises. Under the 37-month EFF, Pakistan committed to cutting the budget deficit by roughly 3% of GDP over three years.
The FBR’s IRIS 2.0 portal and mandatory digital invoicing are genuine steps. Yet a 26.4% growth in sales tax collection — much of it from indirect levies — alongside modest progress in bringing high-net-worth individuals into the direct tax base tells the real story. The Ministry of Finance was mandated to publish a tax simplification strategy by May 2026. Whether it materialises with teeth or becomes another shelf document will signal which direction this government is genuinely moving.
Beyond taxation, more than 80% of bank credit flows to the public sector, crowding private enterprise out of the financial system. Businesses that want to grow can’t borrow. The Lahore Chamber of Commerce has noted that the cost of doing business in Pakistan runs 22–30% above competing regional economies, a gap driven by energy costs, credit scarcity, and policy unpredictability from frequent regulatory changes. These aren’t peripheral complaints. They explain why FDI remains thin — averaging just $2.1 billion annually between 2023 and 2025 — and why Pakistan’s manufacturing sector, despite a large and young labour force, has failed to replicate the export-oriented industrial growth that transformed Vietnam, Bangladesh, or even India’s southern states.
The Energy Trap: Where Fiscal Discipline Goes to Die
No section of Pakistan’s strategic blueprint can ignore the power sector. No other single institutional failure costs the country more — in fiscal terms, in competitiveness, and in credibility.
Pakistan’s power sector circular debt reached Rs1.889 trillion as of February 28, 2026, up nearly Rs200 billion in just two months. The gas sector’s circular debt is even worse, having crossed Rs3.4 trillion. Together, these represent a structural subsidy to inefficiency that the public budget simply cannot sustain.
The root causes are well known and consistently unaddressed. Distribution companies routinely report system losses exceeding 20% of supplied power — far above international benchmarks. Consumers effectively pay capacity charges for electricity that is never generated, because average plant utilisation stands at just 34%, according to NEPRA’s State of Industry Report. Meanwhile, liabilities tied to CPEC power projects have reached a record Rs543 billion, creating a politically sensitive renegotiation challenge with Beijing that Finance Minister Ishaq Dar was expected to raise on his visit.
The IMF has asked Pakistan to reduce new inflows into circular debt to zero within this fiscal year — a demand that requires simultaneously improving billing collection, cutting line losses, privatising distribution companies, and advancing the wholesale electricity market. Privatising five distribution companies is now underway in a formal process, with sell-side due diligence complete as a prerequisite for investor engagement. Previous attempts collapsed under union opposition and political resistance. This time, the IMF’s EFF disbursements are explicitly conditioned on progress, which changes the incentive structure for Islamabad.
Still, financial engineering alone won’t solve a physical problem. The Rs1.225 trillion banking settlement negotiated in September 2025 bought liquidity, not efficiency. The strategic solution is private sector participation in distribution, not as a revenue extraction exercise but as a management transformation — with regulatory clarity, transparent tariff structures, and, critically, tariffs that reflect actual supply costs rather than electoral politics.
Pakistan’s central economic challenges include a tax-to-GDP ratio below 11%, a debt-servicing burden consuming over 50% of federal revenues, power sector circular debt approaching Rs1.9 trillion, and a narrow export base concentrated in textiles. Resolving them requires coordinated fiscal consolidation, energy sector privatisation, IT export incentivisation, and structural tax reform that brings agriculture and services into the formal revenue net.
What would success look like? An industry electricity tariff reduced from Rs34 to Rs22.98 per unit — the level offered under the current Roshan Maeeshat Bijli Package — applied permanently rather than as a temporary subsidy would immediately improve Pakistani export competitiveness across textiles, pharmaceuticals, and light manufacturing. The $7 billion EFF from the IMF is the financial bridge to make that transition. The question is whether Islamabad is willing to absorb the political cost of genuine tariff rationalisation, rather than repeating the pattern of announcing reforms and then quietly reversing them under pressure.
How Can Pakistan Reduce Its Debt-to-GDP Ratio?
The short answer: Pakistan cannot export its way out, borrow its way out, or cut its way out of the debt trap independently. It requires all three levers, calibrated and sequenced.
Export diversification is the most neglected lever. Pakistan’s $347 billion nominal economy is projected to grow at 3.6% in 2026, per the IMF, but growth at that rate, concentrated in low-value textile exports and domestic services, will not generate the foreign exchange needed to reduce external debt sustainably. The IT sector offers a credible alternative trajectory. IT exports are on course to cross $4.5 billion in the current fiscal year, growing at roughly 20% annually since the current government took office — and that’s with a concessional tax regime set to expire in June 2026. The government has set a long-term target of $15 billion in IT exports plus $10 billion from digital transformation, a target that is ambitious but not implausible given demographic tailwinds and global demand for software engineering talent.
Pakistan Software Houses Association (P@SHA) has called for a 10-year extension of the Final Tax Regime for IT exporters — the 0.25% withholding rate on export proceeds that has provided policy stability. That stability matters more than the rate itself. Investors don’t flee Pakistan because the tax burden is high; they hedge or exit because the rules change unpredictably.
The Atlantic Council’s detailed fiscal modelling, published in April 2025, suggests that even a more gradual narrowing of the budget deficit than the EFF targets — paired with concessional external borrowing — can reduce the debt-to-GDP ratio substantially by the end of the decade, bringing the interest-to-revenue ratio below 25% by 2030. The critical variable is the composition of new borrowing: if Pakistan can shift a sizable portion toward concessional multilateral financing (from the World Bank, ADB, and bilateral partners) rather than expensive commercial debt, the arithmetic becomes manageable. That requires reform performance to unlock those concessional windows — which returns, inevitably, to execution.
The Reko Diq copper and gold project in Balochistan, projected to generate $74 billion in free cash flow over its operational life, offers a structural foreign exchange pipeline that no IMF programme can manufacture. Getting it to production — on schedule, with royalty structures that benefit provincial communities — could be the single most consequential economic act this administration undertakes.
The Counterargument: Austerity Has Its Own Costs
Not everyone accepts the reform-now narrative. A credible dissenting tradition argues that IMF-style fiscal consolidation, applied too rapidly in a fragile political economy, generates its own structural damage.
Critics point to the following: the super tax on high-income earners and corporations, running up to 10% for companies with income above Rs500 million, risks accelerating capital flight to Dubai and London at precisely the moment Pakistan needs domestic investment. The FBR’s expansion of withholding tax obligations on digital transactions — a 5% levy that P@SHA and other industry groups have called counterproductive — could suppress the IT export growth that everyone agrees is essential. The Lahore Chamber of Commerce has specifically identified policy instability from frequent Statutory Regulatory Orders as a primary driver of de-industrialisation, a problem that more digitisation at the FBR does not automatically solve.
There is also the equity dimension. A tax system where indirect levies constitute 60% of revenues — a regressive structure by any definition — cannot be described as a reform success simply because it generates more money. A government that asks the poor to bear the highest proportional tax burden while agriculture largely escapes the direct tax net is storing up political instability, not resolving it. The Ministry of Finance’s May 2026 tax simplification strategy will be judged as much on distributional fairness as on revenue targets.
These objections deserve more than dismissal. Pakistan’s previous structural adjustment programmes of the 1980s and 1990s did produce fiscal consolidation in the short run and social deterioration over the medium term. The current programme’s explicit mandate to protect social spending and rebuild health and education allocations — a commitment noted in the IMF’s March 2026 staff-level agreement — is an attempt to learn from that history. Whether the commitment survives budget negotiations is another question.
A Narrow Path, and What Lies at Its End
Pakistan’s 2026 moment is genuinely different from the crises of 2008, 2013, or 2019, at least in one respect: the architecture of reform is more coherent than it has been in decades. Inflation is falling. Reserves are rebuilding. The rupee is stable. A governance reform plan, explicitly linked to IMF disbursements, puts qualitative benchmarks alongside the usual fiscal numbers. The digital transformation of FBR, however imperfect, is real.
What’s missing is not a plan. Plans have never been the problem. What’s missing is the political bandwidth to hold the reforms steady through the electoral cycle — to resist the pressure to reverse tariff increases, extend agricultural tax exemptions, and quietly abandon privatisation when unions push back. That political bandwidth is finite, and it is already under strain from public fatigue with high energy costs and a tax burden that the middle class increasingly experiences as punitive.
The strategic resolution of Pakistan’s economic challenges is, in the end, less about macroeconomic architecture and more about institutional trust. The state must demonstrate that it taxes fairly, spends wisely, and governs honestly enough to be worth investing in. That project is not completed by an IMF programme. It is completed by the thousands of unglamorous decisions — on procurement, on land registration, on court enforcement of contracts — that determine whether businesses grow or leave.
Pakistan has the blueprint. The question, as it has always been, is whether it has the will to build from it.
Discover more from The Economy
Subscribe to get the latest posts sent to your email.



Key Takeaways
- Rolex’s secondary market rose approximately 7.9% year-over-year as of 2026 (per WatchCharts data) — trailing Patek Philippe (+16.2%) and Tudor (+11.4%) but still outperforming Audemars Piguet (+3.4%).
- Rolex raised U.S. retail prices 4–9% in January 2026 (steel models ~5.6%, gold models ~8.7%), narrowing the historical gap between retail and pre-owned pricing.
- Not every model appreciates: steel sports references (Submariner, GMT-Master II, Daytona) have held value far better than two-tone or widely available dress references like the standard Datejust.
- The Lady-Datejust posted the sharpest 2026 gain among tracked collections — up 22.73%, from roughly $9,269 to $11,376 — driven by demand for smaller, “everyday luxury” watches.
- Gold’s rise past $2,400/oz has directly lifted the investment case for Rolex’s precious-metal references (Day-Date, Sky-Dweller, Yacht-Master).
The Model-by-Model Picture
| Category | 2026 Trend |
|---|---|
| Lady-Datejust | +22.73% (strongest performer among tracked collections) |
| Steel sports models (Submariner, GMT-Master II) | Held value well; corrected from 2022 peak but stabilized above retail |
| Daytona | Corrected from highs above $50,000 to the mid-$30,000s; still among the most sought-after references |
| Two-tone/widely available Datejust | Flat to negative — “holds value” is an overstatement for this category |
| Gold references (Day-Date, Sky-Dweller) | Lifted by gold’s rise above $2,400/oz |
Why the “Rolex Always Appreciates” Myth Is Fading
The pandemic-era boom pushed some references — the Daytona above all — to speculative highs disconnected from historical norms. Since the March 2022 peak, steel sports models have compressed meaningfully, and dealers who bought inventory near the top have in some cases faced 20–40% markdowns on liquidation. The lesson for 2026 buyers: Rolex as a category is not a monolith. Value retention depends heavily on specific reference, condition, and whether the piece comes with box and papers (“full set”).
What’s Actually Driving 2026 Strength
- Retail price increases raise the floor. When a new Submariner retails at $10,050 (up from $9,500), a pre-owned example at $11,000–$12,000 suddenly represents a smaller premium — narrowing the gap without secondary prices actually moving.
- Supply discipline remains Rolex’s core lever. The brand has never confirmed production numbers, and secondary-market premiums remain entirely a function of Rolex’s own manufacturing decisions — a risk factor as much as a support.
- Certified Pre-Owned rollout. Rolex’s now fully rolled-out CPO program has changed how buyers transact in the used market, adding a layer of brand-verified legitimacy that supports pricing.
The Case for Rolex as a Portfolio Diversifier
Financial advisors increasingly frame luxury watches not as a replacement for equities or bonds, but as a tangible, historically low-correlation diversifier — one that carries its own risks (illiquidity, condition-dependent pricing, no yield) but has demonstrated multi-decade resilience for specific references.
Is Rolex a good investment in 2026?
It depends heavily on the specific reference. Steel sports models like the Submariner and Daytona have held or grown in value; two-tone and widely available dress models generally have not. Overall, Rolex’s secondary market rose about 7.9% year-over-year in 2026, trailing Patek Philippe but ahead of Audemars Piguet.
Discover more from The Economy
Subscribe to get the latest posts sent to your email.

Navigating Mortgage and Loan Refinancing in a High-Yield Environment
Global public debt crossing critical thresholds has kept central bank policies volatile, resulting in fluctuating US Treasury yields throughout 2026. For homeowners and commercial property holders burdened by previous high-interest borrowing cycles, finding optimal refinance windows has become a high-stakes financial puzzle. Stalled disinflation and stubborn employment numbers mean rate cuts are incremental, requiring borrowers to act with precision.
Timing your mortgage or commercial loan refinance in this environment requires a deep understanding of yield curve movements and lender risk appetites.
Decoding 2026 Refinance Dynamics
The 10-Year Treasury Yield Benchmark
Mortgage rates continue to track closely with the 10-year US Treasury yield. When macroeconomic anxiety spikes debt issuance, yields rise, tightening consumer borrowing capacity. Savvy borrowers monitor weekly Treasury auctions to lock in rates during brief dip windows.
Hybrid ARMs and Alternative Structures
With fixed rates remaining elevated, 7/1 and 10/1 adjustable-rate mortgages (ARMs) have surged in popularity. These products offer lower initial monthly payments, giving borrowers breathing room until central bank easing cycles fully materialize.
| Loan Product | Current Rate Range | Best For | Key Risk Factor |
| 30-Year Fixed Mortgage | 6.2% – 6.8% | Long-term predictability | Higher initial monthly outlay |
| 7/1 Hybrid ARM | 5.5% – 5.9% | Short-term ownership / flipping | Rate reset risk after year 7 |
| Commercial Refinance | 7.0% – 8.2% | Corporate asset restructuring | Strict DSCR lender covenants |
Actionable Steps for Successful Refinancing
To maximize your chances of securing favorable refinance terms in a volatile market, follow a disciplined preparation strategy.
Boost Your Credit Score Immediately: Lenders in 2026 are applying stringent credit tiering; a 20-point increase can drop your APR by a crucial quarter-point.
Shop Regional Credit Unions: Smaller financial institutions often offer portfolio loans with more flexible underwriting than major national banks.
Calculate the Break-Even Point: Ensure your total closing costs are recouped through monthly savings within 24 months of closing.
“Market Strategist View: Refinancing in 2026 is an exercise in opportunistic timing. Borrowers must maintain immaculate financial profiles ready to strike the moment Treasury yields dip.”
Mastering the complexities of today’s debt environment ensures you can successfully lower your debt service costs and protect your long-term financial stability.
Discover more from The Economy
Subscribe to get the latest posts sent to your email.

The days of pulling generic auto insurance quotes based purely on your zip code and age are officially over. In 2026, insurance comparison engines are powered entirely by generative AI and real-time telematics. These platforms digest thousands of live data points—ranging from your driving smoothness via connected vehicle sensors to real-time traffic congestion patterns—to generate hyper-personalized premiums instantly.
For consumers, this evolution represents both a massive opportunity for savings and a hidden trap for penalty pricing. Understanding how AI algorithms evaluate risk is essential for anyone looking to lower their monthly auto insurance premiums.
How AI Comparison Engines Evaluate Your Risk Profile
Behavioral Telematics and Connected Cars
Modern cars stream performance data directly to insurance aggregators. Generative AI models analyze braking sharpness, acceleration curves, cornering G-forces, and phone distraction metrics. Drivers who maintain smooth, defensive habits are rewarded with dynamic rate cuts of up to 40% compared to traditional rating tiers.
Predictive Traffic and Weather Modeling
AI tools now cross-reference your daily commute route with predictive weather and accident probability models. If your standard parking location or driving corridor has a statistically higher incidence of uninsured motorist claims, your quotes will reflect that hyper-local risk assessment.
| Comparison Factor | Traditional Rating Model | 2026 Generative AI Model | Impact on Premium |
| Mileage & Usage | Annual estimated odometer reading | GPS tracking & live trip duration | High (up to 35% savings) |
| Driving Behavior | MVR driving record & accidents | Real-time braking, speed, & G-force | Critical (determines tier) |
| Vehicle Tech | Make, model, and safety rating | ADAS calibration & repair cost data | Moderate |
Strategies to Lower Your AI-Driven Insurance Quote
To outsmart the algorithm and secure the lowest possible premium in 2026, drivers must proactively manage their digital footprint on insurance platforms.
Opt-In for Telematics Trial Periods: Many insurers offer immediate 15% discounts just for installing their driving app; let it track safe habits for 30 days to lock in permanent savings.
Scrub Unverified Public Records: Ensure your motor vehicle report is free of clerical errors that AI risk models misinterpret as reckless behavior.
Compare AI Aggregators: Use platforms that integrate multi-carrier API feeds rather than single-brand comparison sites to find the best risk-adjusted rate.
“Industry Note: AI-driven pricing rewards transparency and precision. Drivers who actively manage their telematics data consistently out-save those relying on legacy quote calculators.”
Embracing AI comparison tools allows savvy policyholders to customize coverage limits precisely to their driving habits, eliminating wasted premium spend while ensuring robust protection.
Discover more from The Economy
Subscribe to get the latest posts sent to your email.

US–China AI Export Controls in 2026: Chips, Testing Rules and Corporate Risk

World Trade in 2026: Tariffs, Supply Chains and the Cost of Fragmentation

Global Economy Outlook 2026–27: What to Watch Ahead of the IMF October Report

Strait of Hormuz in 2026: Why Shipping Risks Matter for Oil, Insurance and Food Prices

US–China Critical Minerals Competition in 2026: Who Controls the Supply Chain?

Oil and Diesel Prices in October 2026: How Supply Shocks Can Reach Inflation

AI Chip Demand in 2026: What TSMC, Nvidia and Data-Center Spending Reveal

Q3 2026 Earnings Season: The Bank, AI and Consumer Signals That Really Matter

Treasury Yields in 2026: Why Higher Bond Rates Matter for Stocks, Mortgages and Savings

KOSPI 2026: Why South Korean Stocks Turned Volatile and What AI Investors Should Watch

IREN Stock in 2026: AI Cloud Growth, Bitcoin Transition and the Risks Investors Miss

Stock Market Crash in 2026? Warning Signs, Scenarios and a Calm Investor Checklist

Peso Mexicano vs Dólar Estadounidense: A Practical USD/MXN Guide for October 2026

Is the Stock Market Open on Columbus Day 2026? NYSE, Nasdaq and Bonds Explained

China Stocks Today: Are Big Economies in Asia Nearing a Market Bottom?

World’s Largest Economies: Ranking the Top Global Powers

Global Pension Systems Ranked: The World’s Best and Worst Retirement Frameworks

Elon Musk’s Next Moves: Disrupting the 2026 Global Economy

Crude Oil & Petroleum Market Analysis: OPEC+ Decisions and Price Forecasts

Pakistan Economy 2026: Inside the SBP’s Balancing Act

GasBuddy Market Insights: How Crude Price Shifts Impact Local Fuel Cost Averages

Global Equity Market Divergence: US Tech vs. European Dividend Stocks vs. Asian Growth

IMF & World Bank Global Economic Outlook: Growth Forecasts Across Europe and Asia

Silver Price Today: Why the Xi-Trump AI Standoff Is Fueling a Safe-Haven Rally

Bitcoin Price Forecast 2026–2027: Will the 4-Year Cycle Hold?

The Future of Silicon: Supply Chain Vulnerabilities in the 2026 Tech Sector

Asian Stock Markets 2026: Japan, China, Pakistan & More

Stagflation vs. Soft Landing: How Central Bank Rates Are Reshaping European and Asian Economies
-

 Markets & Finance9 months ago
Top 15 Stocks for Investment in 2026 in PSX: Your Complete Guide to Pakistan’s Best Investment Opportunities
-

 Analysis8 months ago
Johor’s Investment Boom: The Hidden Costs Behind Malaysia’s Most Ambitious Economic Surge
-

 Analysis8 months ago
Top 10 Stocks for Investment in PSX for Quick Returns in 2026
-

 Banks9 months ago
Best Investments in Pakistan 2026: Top 10 Low-Price Shares and Long-Term Picks for the PSX
-

 Analysis8 months ago
Brazil’s Rare Earth Race: US, EU, and China Compete for Critical Minerals as Tensions Rise
-

 Investment9 months ago
Top 10 Mutual Fund Managers in Pakistan for Investment in 2026: A Comprehensive Guide for Optimal Returns
-

 Global Economy10 months ago
15 Most Lucrative Sectors for Investment in Pakistan: A 2025 Data-Driven Analysis
-

 Global Economy10 months ago
Pakistan’s Export Goldmine: 10 Game-Changing Markets Where Pakistani Businesses Are Winning Big in 2025