
Analysis
Pakistan Economic Challenges: Strategic Solutions for 2026

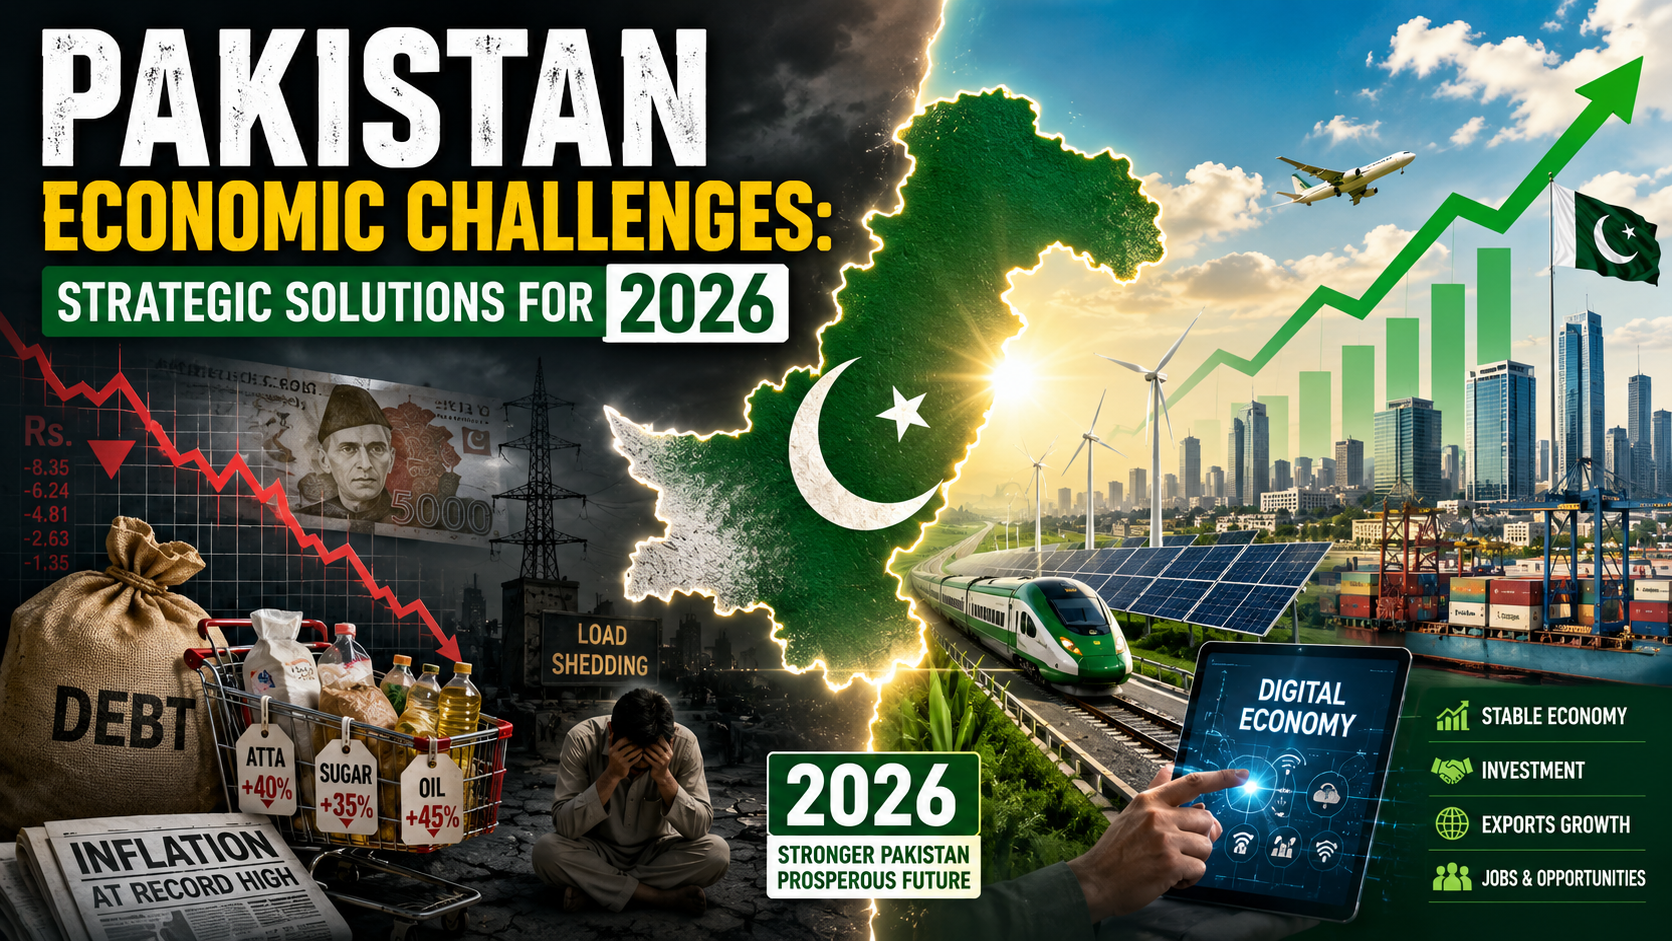
Pakistan has now signed 25 arrangements with the International Monetary Fund. Twenty-five. The first was in 1958, when Eisenhower was in the White House and Pakistan was barely a decade old. The latest — a $7 billion Extended Fund Facility agreed in September 2024 — is still live. Six and a half decades of conditionality, austerity, and restructuring, and the country finds itself back at the same window, negotiating the same terms, hearing the same lectures about fiscal discipline. At some point, the question stops being “what does the IMF want?” and starts being “why hasn’t anything worked?”
The answer is structural. It has always been structural.
The Weight of a Broken Fiscal Architecture
Pakistan’s economic challenges in 2026 did not arrive suddenly. They accumulated across generations of policy choices — or, more precisely, policy deferrals. The IMF, in its April 2026 Fiscal Monitor, estimated gross government debt at 70.1% of GDP for the current fiscal year, while debt servicing alone consumes an estimated 50% or more of total federal revenues. Interest payments in the first half of FY26 reached Rs3.56 trillion — more than double the combined allocations for defence and the entire Public Sector Development Programme.
To understand the trap, consider the arithmetic. Pakistan’s tax-to-GDP ratio reached 10.3% in FY25 for the first time in over a decade, collecting Rs11.744 trillion — a 26.3% year-on-year jump. That’s a genuine improvement. Yet the IMF is pushing for a target of Rs15.6 trillion in FY26-27, tied to an 11.3% tax-to-GDP ratio. Pakistani officials, with some justification, consider 10.7% a more realistic benchmark. The gap between what multilateral creditors demand and what a fragile political economy can deliver has always been Pakistan’s essential problem.
It isn’t simply a revenue problem. It’s a structural misalignment between the state’s obligations and its capacity — compounded by an energy sector that haemorrhages money, an informal economy that pays almost nothing, and an export base so narrow that a single global disruption can fracture the current account.
That said, something is shifting. The current government, under Finance Minister Muhammad Aurangzeb, has taken reform more seriously than most of its predecessors. The FBR is digitising. The rupee has stabilised. Inflation, once above 30%, is descending toward the IMF’s 2026 projection of 7.2%. For the first time in years, the conditions exist for a strategic break from the cycle — if the political will holds.
Why Pakistan’s Economic Challenges Demand Structural, Not Cosmetic, Reform
The core of Pakistan’s problem can be stated plainly: the state does not collect enough, spends what it collects on servicing old debt, and leaves almost nothing for the investment that could generate tomorrow’s revenue. The informal economy accounts for 35–40% of GDP and remains almost entirely outside the tax net. Indirect taxes — sales levies, petroleum duties — constitute more than 60% of total revenue collection, disproportionately burdening lower-income households while leaving wealthy landowners, large retailers, and professionals largely untouched.
What reforms does the IMF require from Pakistan? The Fund’s March 2026 End-of-Mission Statement reiterated four familiar priorities: fiscal consolidation, tight monetary policy, energy sector reform, and managing external financing pressures. Specifically, the IMF has demanded that the FBR expand the tax base by pulling agriculture and services — both historically under-taxed in Pakistan — into the formal revenue net, while simultaneously pressing for the privatisation of loss-making state-owned enterprises. Under the 37-month EFF, Pakistan committed to cutting the budget deficit by roughly 3% of GDP over three years.
The FBR’s IRIS 2.0 portal and mandatory digital invoicing are genuine steps. Yet a 26.4% growth in sales tax collection — much of it from indirect levies — alongside modest progress in bringing high-net-worth individuals into the direct tax base tells the real story. The Ministry of Finance was mandated to publish a tax simplification strategy by May 2026. Whether it materialises with teeth or becomes another shelf document will signal which direction this government is genuinely moving.
Beyond taxation, more than 80% of bank credit flows to the public sector, crowding private enterprise out of the financial system. Businesses that want to grow can’t borrow. The Lahore Chamber of Commerce has noted that the cost of doing business in Pakistan runs 22–30% above competing regional economies, a gap driven by energy costs, credit scarcity, and policy unpredictability from frequent regulatory changes. These aren’t peripheral complaints. They explain why FDI remains thin — averaging just $2.1 billion annually between 2023 and 2025 — and why Pakistan’s manufacturing sector, despite a large and young labour force, has failed to replicate the export-oriented industrial growth that transformed Vietnam, Bangladesh, or even India’s southern states.
The Energy Trap: Where Fiscal Discipline Goes to Die
No section of Pakistan’s strategic blueprint can ignore the power sector. No other single institutional failure costs the country more — in fiscal terms, in competitiveness, and in credibility.
Pakistan’s power sector circular debt reached Rs1.889 trillion as of February 28, 2026, up nearly Rs200 billion in just two months. The gas sector’s circular debt is even worse, having crossed Rs3.4 trillion. Together, these represent a structural subsidy to inefficiency that the public budget simply cannot sustain.
The root causes are well known and consistently unaddressed. Distribution companies routinely report system losses exceeding 20% of supplied power — far above international benchmarks. Consumers effectively pay capacity charges for electricity that is never generated, because average plant utilisation stands at just 34%, according to NEPRA’s State of Industry Report. Meanwhile, liabilities tied to CPEC power projects have reached a record Rs543 billion, creating a politically sensitive renegotiation challenge with Beijing that Finance Minister Ishaq Dar was expected to raise on his visit.
The IMF has asked Pakistan to reduce new inflows into circular debt to zero within this fiscal year — a demand that requires simultaneously improving billing collection, cutting line losses, privatising distribution companies, and advancing the wholesale electricity market. Privatising five distribution companies is now underway in a formal process, with sell-side due diligence complete as a prerequisite for investor engagement. Previous attempts collapsed under union opposition and political resistance. This time, the IMF’s EFF disbursements are explicitly conditioned on progress, which changes the incentive structure for Islamabad.
Still, financial engineering alone won’t solve a physical problem. The Rs1.225 trillion banking settlement negotiated in September 2025 bought liquidity, not efficiency. The strategic solution is private sector participation in distribution, not as a revenue extraction exercise but as a management transformation — with regulatory clarity, transparent tariff structures, and, critically, tariffs that reflect actual supply costs rather than electoral politics.
Pakistan’s central economic challenges include a tax-to-GDP ratio below 11%, a debt-servicing burden consuming over 50% of federal revenues, power sector circular debt approaching Rs1.9 trillion, and a narrow export base concentrated in textiles. Resolving them requires coordinated fiscal consolidation, energy sector privatisation, IT export incentivisation, and structural tax reform that brings agriculture and services into the formal revenue net.
What would success look like? An industry electricity tariff reduced from Rs34 to Rs22.98 per unit — the level offered under the current Roshan Maeeshat Bijli Package — applied permanently rather than as a temporary subsidy would immediately improve Pakistani export competitiveness across textiles, pharmaceuticals, and light manufacturing. The $7 billion EFF from the IMF is the financial bridge to make that transition. The question is whether Islamabad is willing to absorb the political cost of genuine tariff rationalisation, rather than repeating the pattern of announcing reforms and then quietly reversing them under pressure.
How Can Pakistan Reduce Its Debt-to-GDP Ratio?
The short answer: Pakistan cannot export its way out, borrow its way out, or cut its way out of the debt trap independently. It requires all three levers, calibrated and sequenced.
Export diversification is the most neglected lever. Pakistan’s $347 billion nominal economy is projected to grow at 3.6% in 2026, per the IMF, but growth at that rate, concentrated in low-value textile exports and domestic services, will not generate the foreign exchange needed to reduce external debt sustainably. The IT sector offers a credible alternative trajectory. IT exports are on course to cross $4.5 billion in the current fiscal year, growing at roughly 20% annually since the current government took office — and that’s with a concessional tax regime set to expire in June 2026. The government has set a long-term target of $15 billion in IT exports plus $10 billion from digital transformation, a target that is ambitious but not implausible given demographic tailwinds and global demand for software engineering talent.
Pakistan Software Houses Association (P@SHA) has called for a 10-year extension of the Final Tax Regime for IT exporters — the 0.25% withholding rate on export proceeds that has provided policy stability. That stability matters more than the rate itself. Investors don’t flee Pakistan because the tax burden is high; they hedge or exit because the rules change unpredictably.
The Atlantic Council’s detailed fiscal modelling, published in April 2025, suggests that even a more gradual narrowing of the budget deficit than the EFF targets — paired with concessional external borrowing — can reduce the debt-to-GDP ratio substantially by the end of the decade, bringing the interest-to-revenue ratio below 25% by 2030. The critical variable is the composition of new borrowing: if Pakistan can shift a sizable portion toward concessional multilateral financing (from the World Bank, ADB, and bilateral partners) rather than expensive commercial debt, the arithmetic becomes manageable. That requires reform performance to unlock those concessional windows — which returns, inevitably, to execution.
The Reko Diq copper and gold project in Balochistan, projected to generate $74 billion in free cash flow over its operational life, offers a structural foreign exchange pipeline that no IMF programme can manufacture. Getting it to production — on schedule, with royalty structures that benefit provincial communities — could be the single most consequential economic act this administration undertakes.
The Counterargument: Austerity Has Its Own Costs
Not everyone accepts the reform-now narrative. A credible dissenting tradition argues that IMF-style fiscal consolidation, applied too rapidly in a fragile political economy, generates its own structural damage.
Critics point to the following: the super tax on high-income earners and corporations, running up to 10% for companies with income above Rs500 million, risks accelerating capital flight to Dubai and London at precisely the moment Pakistan needs domestic investment. The FBR’s expansion of withholding tax obligations on digital transactions — a 5% levy that P@SHA and other industry groups have called counterproductive — could suppress the IT export growth that everyone agrees is essential. The Lahore Chamber of Commerce has specifically identified policy instability from frequent Statutory Regulatory Orders as a primary driver of de-industrialisation, a problem that more digitisation at the FBR does not automatically solve.
There is also the equity dimension. A tax system where indirect levies constitute 60% of revenues — a regressive structure by any definition — cannot be described as a reform success simply because it generates more money. A government that asks the poor to bear the highest proportional tax burden while agriculture largely escapes the direct tax net is storing up political instability, not resolving it. The Ministry of Finance’s May 2026 tax simplification strategy will be judged as much on distributional fairness as on revenue targets.
These objections deserve more than dismissal. Pakistan’s previous structural adjustment programmes of the 1980s and 1990s did produce fiscal consolidation in the short run and social deterioration over the medium term. The current programme’s explicit mandate to protect social spending and rebuild health and education allocations — a commitment noted in the IMF’s March 2026 staff-level agreement — is an attempt to learn from that history. Whether the commitment survives budget negotiations is another question.
A Narrow Path, and What Lies at Its End
Pakistan’s 2026 moment is genuinely different from the crises of 2008, 2013, or 2019, at least in one respect: the architecture of reform is more coherent than it has been in decades. Inflation is falling. Reserves are rebuilding. The rupee is stable. A governance reform plan, explicitly linked to IMF disbursements, puts qualitative benchmarks alongside the usual fiscal numbers. The digital transformation of FBR, however imperfect, is real.
What’s missing is not a plan. Plans have never been the problem. What’s missing is the political bandwidth to hold the reforms steady through the electoral cycle — to resist the pressure to reverse tariff increases, extend agricultural tax exemptions, and quietly abandon privatisation when unions push back. That political bandwidth is finite, and it is already under strain from public fatigue with high energy costs and a tax burden that the middle class increasingly experiences as punitive.
The strategic resolution of Pakistan’s economic challenges is, in the end, less about macroeconomic architecture and more about institutional trust. The state must demonstrate that it taxes fairly, spends wisely, and governs honestly enough to be worth investing in. That project is not completed by an IMF programme. It is completed by the thousands of unglamorous decisions — on procurement, on land registration, on court enforcement of contracts — that determine whether businesses grow or leave.
Pakistan has the blueprint. The question, as it has always been, is whether it has the will to build from it.
Discover more from The Economy
Subscribe to get the latest posts sent to your email.



Treasury Secretary Scott Bessent has doubled the size of Treasury debt buybacks — to at least $4 billion per operation starting September 9, 2026 — in an effort to push down long-term yields that hit a roughly 19-year high, with 30-year mortgage rates tracking near 6.75% as a result.
What Bessent Just Did
On August 19, 2026, the U.S. Treasury Department announced it would “at least double” the size of its buybacks of 10- to 30-year government debt, starting September 9, in an effort to relieve pressure on longer-dated yields, according to Treasury’s own announcement as reported by CNBC. The prior ceiling was $2 billion per operation; Bessent has said the new figure could run above $4 billion per issue, depending on market conditions.
Why Now: A Bond Market Under Real Stress
The move followed a punishing stretch for long-dated Treasurys. National debt crossed $40 trillion for the first time this month, and the 30-year yield touched its highest level in roughly 19 years — a period predating the 2008 financial crisis. Since the outbreak of the Iran war earlier in 2026, the 10-year yield has climbed nearly 70 basis points, pushing 30-year mortgage rates to around 6.75%, according to market analysts.
Bessent, appearing on CNBC, was candid about the intent: the intervention is partly about signaling that the administration believes current yields don’t reflect underlying fundamentals, and that the Treasury has a “big toolkit” to deploy if needed.
Did It Work? A Mixed and Fading Result
The initial announcement briefly worked. The 10-year note fell to 4.647% and the 30-year fell to 5.196% the day of the announcement, based on CNBC’s market coverage. But the relief didn’t hold — by the next session, yields had erased those declines and moved higher than before Treasury’s intervention, with the 30-year touching as high as 5.27%. Some fixed-income strategists were blunt about the limits of the tool: one Evercore ISI strategist dismissed the plan as a weak version of the Fed’s old “Operation Twist,” warning it risks backfiring if markets read it as panic rather than confidence.
There’s also a funding mechanics wrinkle worth understanding: Treasury doesn’t print money the way the Fed can. To fund the buybacks, it likely has to issue more short-term bills — effectively swapping long-dated debt for short-dated debt, which reshapes the yield curve rather than reducing total debt outstanding, per reporting on the funding mechanism.
Key Yield Levels to Track
| Instrument | Level (week of Aug. 17–21, 2026) | Relevance |
|---|---|---|
| 30-year Treasury | ~5.20%–5.27% | Long-end mortgage pricing benchmark |
| 10-year Treasury | ~4.65%–4.70% | Primary mortgage-rate benchmark |
| 2-year Treasury | ~4.18% | Tracks Fed policy expectations |
| 30-year fixed mortgage | ~6.75% | Direct consumer borrowing cost |
| National debt | $40 trillion+ | Structural backdrop for yield pressure |
What This Means If You’re Shopping a Mortgage or Refinance
The 10-year Treasury yield is the benchmark lenders price fixed mortgages off of, so Bessent’s intervention matters directly to anyone house-hunting or considering a refinance. The takeaway isn’t that rates are about to collapse — analysts broadly agree buybacks can smooth volatility but don’t resolve the deficit and inflation pressures driving yields higher. If you’re already carrying a mortgage originated when 30-year rates were meaningfully higher, it’s worth periodically re-running the math on refinancing, factoring in closing costs against the monthly savings at today’s roughly 6.75% benchmark. If you’re borrowing for the first time, locking a rate during a Treasury-driven dip (like the brief one on August 19) versus waiting is a real trade-off worth discussing with a mortgage broker who can show live rate locks rather than yesterday’s headline number.
Strategic Outlook
- Don’t expect a durable rate collapse from buybacks alone — the relief has already partly reversed within 24 hours in past instances.
- Watch the 10-year, not the Fed funds rate, for mortgage-pricing signals.
- If refinancing, compare quotes across multiple lenders now rather than waiting for a “perfect” rate environment that may not arrive.
- Bond investors should note that Treasury’s buyback-funded-by-bill-issuance approach could keep short-term rates elevated even as it dampens long-end volatility.
This is not financial advice. Treasury market dynamics are complex and rapidly shifting; consult a licensed financial advisor or mortgage professional before making borrowing or investment decisions.
Discover more from The Economy
Subscribe to get the latest posts sent to your email.

After years of explosive gains, AI and machine learning stocks have entered a more complicated phase — still central to the Dow Jones Industrial Average’s overall performance, but facing sharper questions about valuation, earnings durability, and whether the easy gains have already been captured. For investors trying to decide whether to keep adding to AI positions, trim exposure, or rotate into other sectors, 2026 requires a more nuanced read than the straightforward “buy the dip” narrative that worked reliably in prior years.
This analysis breaks down where AI and machine learning stocks currently stand within the broader Dow Jones and market context, what’s driving continued institutional investment despite valuation concerns, and how to think about position sizing if you’re building or maintaining exposure to this sector in your portfolio. Whether you’re a long-term investor or actively trading around AI-sector volatility, understanding the current landscape matters more than chasing last year’s returns.
Where AI Stocks Stand in the Dow Jones Right Now
AI-adjacent companies — spanning semiconductor manufacturers, cloud infrastructure providers, and enterprise software firms embedding AI capabilities — continue to represent an outsized share of overall market cap growth relative to their weighting in the index. This concentration has been a persistent feature of the market for several years now, and it means Dow Jones performance remains more tied to AI-sector sentiment than the historical diversification of the index would suggest.
What’s changed in 2026 is the market’s patience with growth-at-any-valuation stories. Earnings calls that once got a pass on questions about AI monetization timelines are now facing sharper analyst scrutiny, and companies unable to demonstrate a clear path from AI investment to revenue growth have seen more punishing reactions to earnings misses than in prior years.
The Bull Case for AI and ML Stocks in 2026
Despite valuation concerns, several structural tailwinds continue supporting the bull case for AI-sector investment. Enterprise AI adoption is still in relatively early innings for many industries — healthcare, logistics, and financial services in particular are still ramping infrastructure spending rather than winding it down. Capital expenditure guidance from major cloud and semiconductor companies has largely remained robust, suggesting the largest players still see multi-year runway for AI infrastructure investment rather than a near-term plateau.
Key Bullish Factors
- Continued enterprise adoption – Many industries remain in early-to-mid stages of AI integration, suggesting sustained demand
- Infrastructure capex guidance – Major cloud providers have maintained or increased AI infrastructure spending forecasts
- Margin expansion in software – AI-embedded enterprise software companies are showing improved margins as adoption scales
- International expansion – AI infrastructure investment is accelerating outside the US, broadening the addressable market
- Ongoing chip demand – Semiconductor demand tied to AI training and inference workloads remains structurally elevated
The Bear Case: Why Some Investors Are Cautious
The counterargument centers on valuation multiples that, even after some 2025-2026 volatility, remain elevated relative to historical norms for the broader market. Concerns persist about circular investment relationships between major AI infrastructure players, where the same handful of companies are simultaneously customers and investors in one another’s growth — a dynamic some analysts argue inflates reported demand signals. There’s also a legitimate question about how quickly AI capital expenditure will translate into durable free cash flow versus remaining a perpetually reinvested growth story.
Key Bearish Factors
- Elevated valuations – Price-to-earnings and price-to-sales multiples remain historically high for many AI-adjacent names
- Circular investment concerns – Interlocking investment relationships among major AI infrastructure players raise demand-durability questions
- Interest rate sensitivity – Growth stock valuations remain more sensitive to rate policy shifts than value-oriented sectors
- Monetization timeline uncertainty – Gap between AI infrastructure spend and proven enterprise ROI remains a persistent analyst concern
- Increased regulatory scrutiny – Antitrust and AI-specific regulatory attention has increased globally, adding a layer of policy risk
Sector Comparison: AI/ML Stocks vs. Broader Dow Jones Composition
| Factor | AI/ML Sector Stocks | Broader Dow Jones Average |
|---|---|---|
| Average valuation multiple | Elevated relative to historical norms | Closer to long-term historical average |
| Earnings growth expectations | High, but under increasing scrutiny | Moderate, more stable |
| Volatility | Higher | Lower |
| Capital expenditure trend | Aggressive, ongoing | Mixed by sector |
| Regulatory exposure | Increasing | Sector-dependent |
| Institutional sentiment | Cautiously bullish with rotation risk | Stable |
How to Think About Position Sizing in 2026
Given the more nuanced risk/reward picture, a disciplined approach matters more than it has in prior AI-sector bull runs. Consider these principles when managing exposure:
- Avoid overconcentration in a small handful of mega-cap AI names, even if they’ve driven most of your recent returns
- Diversify across the AI value chain — infrastructure, chips, and application-layer software carry different risk profiles
- Pay closer attention to free cash flow trends, not just revenue growth, as monetization scrutiny increases
- Consider dollar-cost averaging into positions rather than making large single entries given elevated volatility
- Reassess position sizing relative to your overall portfolio risk tolerance, not just recent sector momentum
Watching for Rotation Signals
Beyond the bull and bear fundamentals, it’s worth paying attention to sector rotation signals that often precede broader market sentiment shifts around AI valuations. Institutional fund flow data, options market positioning, and relative performance between AI-heavy growth indices and value-oriented sectors can all offer early signals of shifting sentiment before it fully shows up in individual stock prices. Historically, sharp AI-sector pullbacks have often been triggered less by fundamental deterioration and more by a specific catalyst — a disappointing earnings guidance from a bellwether company, a macro rate shock, or a high-profile regulatory action — that causes previously patient investors to reassess valuation assumptions all at once. Staying attentive to these catalysts, rather than assuming steady-state conditions will persist indefinitely, is part of maintaining a disciplined approach to sector exposure in a still-evolving investment theme.
Frequently Asked Questions
Should I sell my AI stocks if I think the sector is overvalued?
That depends entirely on your investment horizon and risk tolerance rather than a one-size-fits-all answer. Long-term investors with a diversified portfolio may choose to simply trim overconcentrated positions rather than exit entirely, while investors more sensitive to near-term volatility might reduce exposure more aggressively. This isn’t personalized financial advice, and consulting a financial advisor about your specific situation is worth considering before making significant portfolio changes.
How can I tell if an AI company’s revenue growth is sustainable versus inflated by circular investment deals?
Look closely at the customer concentration disclosed in earnings reports and investor filings — if a large share of a company’s reported revenue comes from a small number of other AI infrastructure companies rather than a broad, diversified customer base, that’s worth factoring into your assessment of demand durability.
Are AI stocks more volatile than the broader Dow Jones average?
Generally yes, particularly for higher-growth, less-established names within the sector. More established, cash-flow-positive AI-adjacent companies within the Dow Jones tend to show somewhat lower volatility than smaller, growth-stage AI-focused companies outside the index.
Is it too late to start investing in AI stocks in 2026?
Many analysts view the sector as being in a more mature, selective phase rather than an early-stage opportunity, which changes the risk/reward calculus compared to earlier years but doesn’t necessarily mean the opportunity has fully passed. Position sizing, diversification, and a longer time horizon matter more now than simply timing an entry point.
Final Thoughts
AI and machine learning stocks remain a legitimate long-term investment theme in 2026, but the easy, broad-based gains of previous years have given way to a market that’s demanding more evidence of durable monetization before rewarding further multiple expansion. This doesn’t necessarily mean it’s time to exit the sector — but it does mean position sizing, diversification within the AI value chain, and closer attention to fundamentals matter more now than they did in the earlier stages of the AI investment cycle.
Are you still adding to your AI stock positions in 2026, or have you started rotating into other sectors given the valuation concerns? Share your investment approach in the comments.
Discover more from The Economy
Subscribe to get the latest posts sent to your email.

Subscription fatigue is real, and with both Amazon Prime and Walmart+ now priced close together, the question isn’t just “which has faster shipping” anymore — it’s which membership delivers more actual financial value once you account for every perk, discount, and hidden cost. Both programs have expanded well beyond free shipping into fuel discounts, streaming bundles, prescription savings, and cashback-style perks, making a direct comparison more complicated — and more important — than it used to be.
This breakdown compares Amazon Prime and Walmart+ specifically through a financial lens: what each membership actually costs after accounting for real usage, which perks translate into measurable savings, and which one makes more sense depending on your shopping habits. If you’re deciding between the two, or wondering whether you need both, this is the comparison that matters.
Base Membership Cost and What You’re Actually Paying For
Both memberships sit in a similar annual price range, but the value proposition diverges quickly once you look past shipping. Amazon Prime bundles in Prime Video, Prime Music, Prime Reading, and periodic exclusive shopping events like Prime Day, positioning itself as much as an entertainment subscription as a shopping perk. Walmart+ leans harder into everyday savings — fuel discounts at Walmart and Murphy USA/Sam’s Club stations, member prescription pricing, and early access to deals — positioning itself more explicitly as a cost-of-living savings tool than an entertainment bundle.
This distinction matters more than it might first appear: if you don’t watch Prime Video or use Amazon’s other entertainment perks, you’re effectively paying for value you never redeem, which changes the real cost-per-benefit calculation significantly in Walmart+’s favor for budget-focused shoppers.
Where Amazon Prime Wins Financially
Prime’s biggest financial edge comes from its sheer breadth — free shipping across a massive product catalog, frequent lightning deals, Prime Day and Black Friday exclusive pricing, and a genuinely valuable entertainment bundle that would cost more if purchased separately as standalone streaming subscriptions. For households that already shop heavily on Amazon and use its content ecosystem, the membership often pays for itself several times over.
Prime’s Strongest Financial Perks
- Prime Video and Music bundled in – Comparable standalone streaming subscriptions would cost more separately
- Prime Day and exclusive member deals – Some of the steepest discounts of the year are member-exclusive
- Same-day and next-day shipping on huge product selection – Reduces impulse in-store spending and time cost
- Amazon Fresh/Whole Foods discounts – Additional grocery savings layered on top of the core membership
- Prime Reading and Kindle deals – Added value for frequent readers, though a smaller factor for most households
Where Walmart+ Wins Financially
Walmart+’s value proposition is more directly tied to recurring, practical household spending — fuel savings that compound with regular driving, member pricing on prescriptions that can meaningfully offset healthcare costs, and free delivery from Walmart stores that competes directly with grocery delivery services that otherwise charge separately. For budget-conscious households prioritizing everyday cost reduction over entertainment bundling, Walmart+ often delivers a higher effective return relative to its membership cost.
Walmart+’s Strongest Financial Perks
- Fuel discounts at partner gas stations – Per-gallon savings that compound significantly for frequent drivers
- Free grocery delivery from Walmart stores – Comparable third-party grocery delivery often charges separate membership and delivery fees
- Member prescription pricing – Meaningful savings for households managing regular prescription costs
- Early access to deals and Walmart+ Week – Comparable to Prime Day but with a stronger everyday-essentials focus
- Included Walmart+ Assist option – Discounted membership rate for qualifying government assistance program participants
Side-by-Side Financial Comparison
| Perk Category | Amazon Prime | Walmart+ |
|---|---|---|
| Free shipping/delivery | Yes, vast catalog | Yes, Walmart stores + select delivery |
| Entertainment bundle | Extensive (Video, Music, Reading) | None |
| Fuel discounts | No | Yes |
| Prescription savings | Limited | Yes, member pricing |
| Grocery delivery | Amazon Fresh/Whole Foods | Walmart stores |
| Best for | Entertainment + broad shopping households | Everyday essentials + driving households |
| Approximate annual cost | Comparable to Walmart+ | Comparable to Prime |
How to Decide Which One Actually Saves You Money
- Calculate your realistic entertainment usage – If you’d otherwise pay for Prime Video separately, that alone can justify Prime’s cost
- Estimate your annual fuel spending – Frequent drivers often see Walmart+’s fuel discount outweigh Prime’s shipping perks
- Factor in prescription costs – Households with regular prescriptions may find Walmart+’s savings compound significantly over a year
- Consider where you already shop most – Membership perks only generate savings if they match your existing spending habits, not your aspirational ones
- Don’t rule out having both temporarily – Many households run both during peak sales events (Prime Day and Walmart+ Week) and cancel one afterward
Tracking Your Actual Usage Before Renewal
The most reliable way to determine which membership is worth keeping is to actually track your usage over a full billing cycle rather than relying on assumptions about your habits. Keep a simple running log for a month of every delivery, streaming session, fuel fill-up, or discount you used through each membership, then estimate what those same purchases or services would have cost without the membership. This exercise routinely reveals that households overestimate how much they use certain perks — streaming content they rarely watch, or delivery services they use less than they think — while underestimating others, like fuel savings that compound quietly over dozens of fill-ups a year. Doing this once before your next renewal date gives you an actual data-driven answer rather than a guess based on how valuable the membership felt when you first signed up.
Frequently Asked Questions
Can I get a free trial for either membership before committing?
Both programs have historically offered free trial periods, though exact lengths and availability change periodically and aren’t guaranteed to be offered indefinitely. Checking each program’s current sign-up page for an active trial offer before committing to a full annual membership is worth the two minutes it takes.
Is it worth paying for both memberships at once?
For some households, yes — particularly around major sales events like Prime Day and Walmart+ Week, when the potential savings from each platform’s exclusive deals can outweigh the cost of a short-term membership. Many people sign up for one during its peak sales event, capture the savings, then cancel before the next billing cycle if ongoing dual membership doesn’t otherwise pencil out.
Do student or family discounts apply to either membership?
Both programs have offered discounted rates for qualifying groups at various points, including student pricing and family or multi-account sharing options. Terms and eligibility change, so checking current program pages rather than relying on outdated information is important before assuming a discount applies to your situation.
Which membership is better if I mostly shop online rather than in physical stores? Amazon Prime generally has the edge for pure online shopping breadth given its larger third-party marketplace and product catalog, while Walmart+ perks are more closely tied to in-store and Walmart-specific online purchases. If your shopping is heavily concentrated on Amazon already, Prime’s broader catalog advantage becomes more relevant to your specific savings calculation.
Final Thoughts
There’s no universal winner between Amazon Prime and Walmart+ — the better financial choice depends entirely on whether your household spending leans toward broad online shopping and entertainment, or everyday essentials like fuel, groceries, and prescriptions. Run the actual numbers based on your last few months of spending in each category before committing to a full year of either membership, and don’t assume last year’s decision is still the right one as both programs continue adding and adjusting perks.
Which membership has actually saved you more money this year — Prime or Walmart+? Or are you running both? Share your real numbers in the comments.
Discover more from The Economy
Subscribe to get the latest posts sent to your email.

Gold Price Forecast & Oil Volatility: Hedging Against Middle East Tensions

2026 Global Growth Slowdown: Investment Strategies at 2.6%

State Farm’s $5B Dividend 2026: Who Qualifies & Payout Dates

Bessent’s Debt Buybacks Explained: Impact on Your Mortgage

SEC Crypto Regulations 2026: What They Mean for Your Bitcoin Wallet

USPS vs FedEx Tracking 2026: How to Cut E-commerce Shipping Costs

Dow Jones Analysis 2026: Are AI and Machine Learning Stocks Still a Buy?

Amazon Prime vs Walmart+: Which Membership Saves You More in 2026?

Canva vs Adobe: Best Design Software for E-commerce Brands in 2026

Capital One vs Wells Fargo: Best Credit Card for Buying Crypto in 2026

The 2026 Guide to Staking ADA and BNB: How to Earn Passive Crypto Income on the Best Platforms

BigLaw Backlash 2026: Why Top US Firms Are Being Slammed for “Crazy” 1L Hiring

SpaceX Falcon 9 Upper Stage Crashes Into Moon, Creating New Crater Near Einstein

7-Eleven, GameStop, and Grocery Outlet Slash Hundreds of Stores in 2026 Restructuring Wave

China Politburo July 2026: Stimulus Signals Explained

Russia Fuel Shortages 2026: Inside a Cracking War Economy

Top 15 Financial Stocks for Investment in PSX

Pakistan Passed Its Third IMF Review

SpaceX Stock Lockup Expiration Explained: Why $123B in Shares Could Hit the Market

Andy Burnham, UK Gilts and Mortgages: July 2026 Explainer

Pakistan IMF Program 2026: Inside the Push Toward an Interest-Free Economy

Russia Oil Revenue 2026: How Sanctions on Rosneft and Lukoil Are Draining the War Chest

Pakistan’s 2026 Monsoon Floods Threaten Fragile Economic Recovery as Inflation Nears 9%

Russia Oil Revenue 2026: The Iran War Windfall and What a Hormuz Deal Means for Moscow

Russia’s Budget Deficit Blew Past Its Full-Year Target in Three Months

Canada US Trade War 2026: Inside Carney’s Push to Cut Ties With Trump’s Tariffs

China Economy 2026: How AI Exports and a Property Crash Are Splitting Growth in Two

Gold Price 2026: Why Bullion Has Fallen 25% From Its January Record High
-

 Markets & Finance8 months ago
Top 15 Stocks for Investment in 2026 in PSX: Your Complete Guide to Pakistan’s Best Investment Opportunities
-

 Analysis6 months ago
Johor’s Investment Boom: The Hidden Costs Behind Malaysia’s Most Ambitious Economic Surge
-

 Analysis6 months ago
Top 10 Stocks for Investment in PSX for Quick Returns in 2026
-

 Analysis7 months ago
Brazil’s Rare Earth Race: US, EU, and China Compete for Critical Minerals as Tensions Rise
-

 Banks7 months ago
Best Investments in Pakistan 2026: Top 10 Low-Price Shares and Long-Term Picks for the PSX
-

 Investment7 months ago
Top 10 Mutual Fund Managers in Pakistan for Investment in 2026: A Comprehensive Guide for Optimal Returns
-

 Global Economy8 months ago
15 Most Lucrative Sectors for Investment in Pakistan: A 2025 Data-Driven Analysis
-

 Global Economy8 months ago
Pakistan’s Export Goldmine: 10 Game-Changing Markets Where Pakistani Businesses Are Winning Big in 2025