
Analysis
Iran War Singapore Growth & Inflation 2026: Gan’s Warning Explained | A Wake-Up Call for Asia

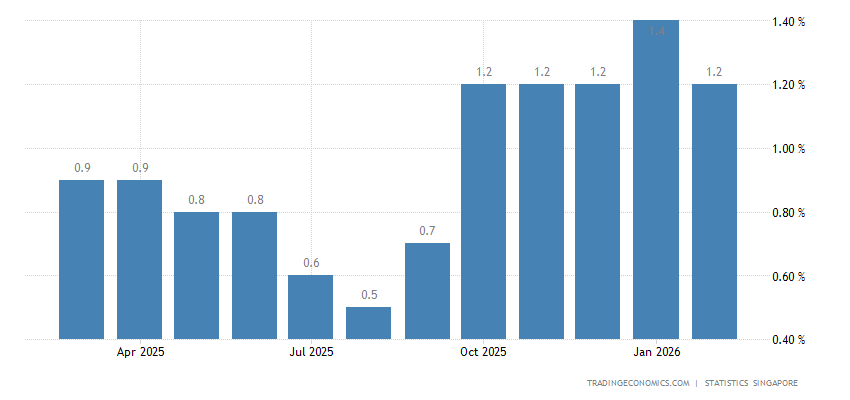
DPM Gan Kim Yong told Parliament on April 7, 2026 that the Iran war will hurt Singapore’s GDP and push inflation higher. Here’s what it means for Asia’s open economies — and why the forecast revision coming in May could be the most consequential in a decade.
Singapore’s Moment of Reckoning Has Arrived
The chamber was unusually charged for a Tuesday afternoon. More than seventy parliamentary questions had been filed — a volume that, by Singapore’s meticulous standards, signals genuine institutional alarm. When Deputy Prime Minister and Minister for Trade and Industry Gan Kim Yong rose to address Parliament on April 7, 2026, the words he delivered were neither catastrophist nor comforting. They were something more unsettling than both: calibrated, honest, and unmistakably ominous. “As a small and highly open economy,” he said, “Singapore will not be able to insulate ourselves completely from this crisis. Growth in the coming quarters is likely to be affected by the ongoing conflict.”
Outside on Shenton Way, the morning’s trading boards told a parallel story — the Straits Times Index down, freight quotes climbing, electricity tariffs that had already been revised upward on April 1 now looking like a floor rather than a ceiling. For Singapore, a city-state with no hinterland, no domestic energy base, and no insulation from the global price of anything, the Iran war is not a distant geopolitical abstraction. It is an arriving economic storm, and Gan’s parliamentary statement was the clearest official admission yet that the government’s own forecasts — upgraded as recently as February to a bullish 2% to 4% GDP growth for 2026 — will need to be revisited.
This is the story of why that revision matters, and what it reveals about the structural vulnerabilities of every small, trade-dependent economy in a world increasingly shaped by great-power conflict.
Not Ukraine Redux: Why This Shock Is Different in Kind
Experienced market watchers were quick to reach for the 2022 Russia-Ukraine playbook when the US-Israeli strikes on Iran began on February 28, 2026. That instinct is understandable but analytically dangerous. The Ukraine episode was primarily a European energy shock — devastating for the continent’s natural gas grid, but geographically contained in ways that allowed Asian economies to pivot rapidly toward alternative suppliers and routes. The Iran war is something structurally different, and more globally corrosive.
The Strait of Hormuz, through which approximately 20% of the world’s traded oil passes alongside vast volumes of liquefied natural gas, does not have a European bypass. The closure of the strait triggered by the conflict has disrupted roughly a fifth of global oil supply, sending Brent crude surging to over US$82 per barrel — a 30% increase since the start of 2026 and the highest level since January 2025. Unlike the Suez Canal, for which alternative routing around the Cape of Good Hope is slow and costly but physically possible, the Hormuz chokepoint forces rerouting that simply cannot be accomplished at comparable volumes or speed.
More critically, the war’s cascading effects are not bounded by energy markets. Analysts have described the economic impact as the world’s largest supply disruption since the 1970s energy crisis, encompassing surges in oil and gas prices, wide disruptions in aviation and tourism, and volatility in financial markets. That characterisation — the 1970s benchmark — is one that Singapore’s older policymakers understand viscerally. The 1973 oil embargo reshaped the city-state’s energy strategy for a generation. What is unfolding in 2026 is arriving with far greater interconnectedness and far less margin for response.
The Four Channels: How the Iran War Hits Singapore’s Economy
Energy and Chemicals: The First and Loudest Channel
Singapore is one of Asia’s pre-eminent refining and petrochemicals hubs. Its Jurong Island complex processes millions of barrels of crude annually, supplying refined products and chemical feedstocks across the region. When global crude prices surge and Gulf supply contracts abruptly, the feedstock economics of that entire industrial ecosystem are upended. Parliamentary questions filed for the April 7 sitting explicitly asked whether Singapore’s petrochemical and refining sectors face risks to output, margins and competitiveness given the republic’s role as a regional energy and chemicals hub.
Gan confirmed that the spike in global oil and natural gas prices will inevitably raise fuel and electricity costs for Singapore, and that cost increases will “feed through to broader inflation.” He went further, calling the supply disruption from the Hormuz closure “the worst disruption since the 1973 oil embargo” — language that carries particular weight from a minister known for understatement.
Electricity tariffs were already revised upward from April 1. Singaporean authorities have warned of sharper increases to come, with cooking gas prices also rising, though some providers said they may absorb costs for hawker centres. For industrial consumers — manufacturers, data centres, cold-chain logistics — these are not headline distractions. They are margin compressors arriving on top of already elevated input costs.
Manufacturing: The Second-Round Hit
Singapore’s manufacturing sector — which encompasses electronics, biomedical products, and advanced chemicals — does not consume crude oil directly in most of its processes. But energy is embedded in every stage of global supply chains, and when shipping costs and input prices rise simultaneously, the squeeze reaches even the most advanced factories.
Senior economists at DBS Group Research noted that Singapore’s economy is confronting uncertainty from a relatively strong position, with solid growth momentum buoyed by global AI-related tailwinds and still-low inflation at the start of 2026. That strength, real as it is, does not make the republic immune to margin compression in its externally-facing industries. Semiconductor packaging, precision engineering, and pharmaceutical manufacturing all depend on global logistics networks whose costs are now rising sharply.
The AI demand tailwind that powered Singapore’s manufacturing resilience through early 2026 remains intact — demand for advanced chips has not diminished. But when energy and transport costs rise across the supply chain, even AI-driven production is not entirely insulated. Earnings risk for Singapore’s listed manufacturers is real and, as yet, inadequately priced by equity markets.
Transport and Travel: The Visible Daily Pain
Here is where the economic shock becomes humanised. Jet fuel prices have climbed in lockstep with crude, squeezing airline operating margins and threatening the air connectivity on which Singapore’s Changi Airport — the city’s most strategically important piece of infrastructure — depends. Parliamentary questions addressed fare adjustments by ride-hailing operators Grab and ComfortDelGro, asking whether the Ministry of Transport was consulted and what regulatory oversight is in place to prevent private-hire and taxi operators from passing on fuel costs unchecked. The fact that cab drivers received a S$200 fuel subsidy in the April 7 package is telling: the government recognises that transport cost pass-throughs are already live.
Aviation and tourism were singled out among the sectors facing wide disruptions from the conflict. For Singapore, which has positioned itself as Asia’s premier transit hub and whose aviation-adjacent services — hospitality, MICE, retail — form a meaningful slice of services GDP, a sustained softening in air traffic flows is a multi-quarter drag that GDP models may not yet fully capture.
Domestic Services: The Inflation Spiral That Begins in Changi Road
The most economically insidious channel is the one that receives the least analytical attention: the inflationary pass-through into domestic services. When fuel prices rise, school bus operators raise fares — something already visible in Singapore’s local reports. When electricity tariffs rise, restaurants’ operating costs rise; when food import costs climb because freight is more expensive, hawker centre prices follow. These are the mechanisms through which an energy shock migrates from the oil market to the heartland household.
As school bus driver V. Parath put it plainly: “The price of everything in Singapore is increasing.” That is not merely anecdote. It is a leading indicator that core inflation is beginning to broaden from energy and transport into services — a broadening that, once embedded in wage expectations, becomes structurally stickier.
Pull Quote: “This is not a standard energy shock. It is a simultaneous hit to feedstock costs, freight rates, exchange-rate dynamics and consumer confidence — arriving in an economy that was already managing multiple transition pressures. Singapore’s buffers are real and substantial. But buffers are finite.”
The Macro Ripple: MAS, the SGD, and an Unenviable Policy Dilemma
The Monetary Authority of Singapore’s principal policy instrument is the exchange rate, not the interest rate. The central bank manages the Singapore dollar against an undisclosed basket of trading partner currencies within a policy band, adjusting the slope, width, and centre of that band to target imported inflation. In a standard energy shock, the textbook response is to allow or even encourage modest SGD appreciation to absorb imported price increases.
MAS confirmed in early March that it is conducting a formal assessment of the domestic financial system’s exposure, and that the Singapore dollar nominal effective exchange rate remains within its established appreciating policy band — positioning intended to dampen imported inflationary pressures.
But the policy dilemma is more complex than the textbook suggests. Broader dollar strength driven by safe-haven demand and reduced US Federal Reserve rate-cut expectations — with futures markets now pricing the first fully priced Fed cut as late as September, two months later than the July consensus prevailing before the conflict — has compressed Singapore’s room to manoeuvre. A SGD that appreciates against the USD provides some imported-price relief but simultaneously hits the competitiveness of Singapore’s export-facing industries at precisely the moment when their margins are already being squeezed.
Maybank economist Chua Hak Bin had flagged inflation as an underappreciated risk in 2026, citing rising semiconductor prices and the unwinding of Chinese export deflation — a deflationary cushion that had kept manufactured goods prices suppressed for several years. A Gulf supply shock superimposes an energy cost surge on top of those pre-existing pressures. If the conflict persists beyond four to six weeks, Singapore’s core inflation could break above MAS’s 1–2% forecast band, creating pressure on the central bank to shift its exchange-rate policy.
That band adjustment, if it comes, will be one of the most significant MAS signals in years — and it is coming into view.
The Limits of “Safe Haven”: Why Singapore Is Not Immune to Structural Fragmentation
For a generation, Singapore cultivated — and largely deserved — a reputation as Asia’s most resilient small open economy: deep reserves, AAA fiscal credibility, trade agreements with virtually every major partner, and an uncanny institutional capacity to navigate geopolitical turbulence without becoming its casualty. That reputation is not false. But this crisis is exposing its conditionality.
Coordinating Minister for National Security K. Shanmugam warned on April 7 that markets have yet to factor in the worst-case scenario — and that Singapore cannot rule out power disruptions if the conflict in Iran further disrupts global energy supplies. A sitting minister explicitly raising the spectre of power disruption in a city whose every competitive advantage rests on the reliability of its infrastructure is not rhetoric — it is a risk disclosure.
The structural issue is one that Singapore shares with a cohort of ultra-open economies whose prosperity was architected for a rules-based, multilateral trade order. Taiwan, South Korea, and the Netherlands are the most obvious analogues. Each is deeply integrated into global supply chains, each imports most of its energy needs, and each has built extraordinary competitiveness precisely by maximising openness rather than pursuing autarky. In a world of discrete shocks — a pandemic here, a trade dispute there — openness is the right bet. In a world where great-power conflict is becoming endemic rather than episodic, that calculus deserves harder scrutiny.
The Iran war’s economic impact is not merely a supply shock. It is a signal that the frequency and geographic scope of geopolitical disruptions may be structurally higher going forward than the models that underpin Singapore’s growth forecasts were calibrated for. When Gan says growth in the coming quarters will be “affected,” he is describing an outcome. The deeper question is whether Singapore’s — and Asia’s — planning frameworks are being updated to account for a world where such statements become a recurring feature rather than an exception.
May’s Forecast Revision: What to Expect — and Fear
Singapore’s GDP advance estimate for the first quarter is due on April 14, with a full economic outlook update scheduled for May. The first-quarter numbers will almost certainly show resilience — Gan himself acknowledged that early data indicate economic activity held up well through Q1. That resilience, largely built on AI-driven electronics demand and services strength, will briefly reassure markets.
May’s revision is another matter. The 2% to 4% full-year GDP forecast issued in February was calibrated for a world in which the Iran conflict was either resolved or contained within weeks. Singapore’s predicament is shaped by geography as much as policy — the republic sits far from the conflict zone, yet its economy is tied tightly to global trade, imported food and imported fuel. Any threat to Gulf energy production or maritime passage through strategic chokepoints can ripple quickly into Asian benchmark prices, freight costs and business sentiment.
A sustained conflict — and with over a month of fighting already in the books, “sustained” is no longer a tail risk — points to a revised growth forecast closer to the lower end of the current range or potentially below it. Inflation forecasts, already tracking against MAS’s 1–2% core target band, are likely to be revised upward. For households and SMEs that have not yet felt the full pass-through of April’s electricity tariff increase, the coming months will be measurably harder.
What Policymakers Must Do — and What Singapore Offers as Model
The S$1 billion support package unveiled on April 7 — boosting the corporate income tax rebate from 40% to 50%, advancing grocery vouchers to June, and providing S$200 supplements to both eligible households and cab drivers — is competent crisis management. It cushions the immediate pain, demonstrates governmental responsiveness, and signals institutional credibility to markets. It is not, however, a structural solution.
For Singapore specifically, the priorities are now fourfold. First, accelerate energy diversification — Shanmugam noted that Singapore is studying alternatives including nuclear power to broaden its fuel mix, a move that was politically contentious eighteen months ago and is now strategically urgent. Second, extend supply-chain diplomacy aggressively: the Singapore-Australia joint energy security statement of March 23, 2026 is exactly the kind of bilateral redundancy-building that needs to be replicated across multiple partners and commodity categories. Third, provide targeted, time-limited support for SMEs facing acute energy and freight cost pressure — the risk of SME failures compressing domestic employment and spending is underappreciated. Fourth, and most importantly, begin recalibrating the medium-term planning framework to assume a structurally less stable geopolitical environment than the one that informed Singapore’s last decade of growth strategy.
For the broader cohort of open Asian economies — South Korea, Taiwan, Vietnam, Thailand — Singapore’s predicament is a live case study in vulnerabilities they share. The lesson is not to retreat from openness, which remains the correct long-term bet for small economies without large domestic markets. It is to build genuine redundancy into energy, food, and supply-chain systems; to cultivate multiple geopolitical relationships that provide diplomatic buffer in crises; and to hold fiscal capacity in reserve precisely for moments like this one.
Singapore has those reserves. Its institutions are among the world’s most capable. The response so far has been measured, credible, and appropriately scaled. But Gan’s words in Parliament on April 7 should be read not only as a situational update but as a structural warning — to Singapore, and to every economy that built its prosperity on the assumption that the global order would remain permissive. That assumption is now, unmistakably, in question.
The bumpy ride ahead is not Singapore’s alone.
Discover more from The Economy
Subscribe to get the latest posts sent to your email.



Key Takeaways
- Rolex’s secondary market rose approximately 7.9% year-over-year as of 2026 (per WatchCharts data) — trailing Patek Philippe (+16.2%) and Tudor (+11.4%) but still outperforming Audemars Piguet (+3.4%).
- Rolex raised U.S. retail prices 4–9% in January 2026 (steel models ~5.6%, gold models ~8.7%), narrowing the historical gap between retail and pre-owned pricing.
- Not every model appreciates: steel sports references (Submariner, GMT-Master II, Daytona) have held value far better than two-tone or widely available dress references like the standard Datejust.
- The Lady-Datejust posted the sharpest 2026 gain among tracked collections — up 22.73%, from roughly $9,269 to $11,376 — driven by demand for smaller, “everyday luxury” watches.
- Gold’s rise past $2,400/oz has directly lifted the investment case for Rolex’s precious-metal references (Day-Date, Sky-Dweller, Yacht-Master).
The Model-by-Model Picture
| Category | 2026 Trend |
|---|---|
| Lady-Datejust | +22.73% (strongest performer among tracked collections) |
| Steel sports models (Submariner, GMT-Master II) | Held value well; corrected from 2022 peak but stabilized above retail |
| Daytona | Corrected from highs above $50,000 to the mid-$30,000s; still among the most sought-after references |
| Two-tone/widely available Datejust | Flat to negative — “holds value” is an overstatement for this category |
| Gold references (Day-Date, Sky-Dweller) | Lifted by gold’s rise above $2,400/oz |
Why the “Rolex Always Appreciates” Myth Is Fading
The pandemic-era boom pushed some references — the Daytona above all — to speculative highs disconnected from historical norms. Since the March 2022 peak, steel sports models have compressed meaningfully, and dealers who bought inventory near the top have in some cases faced 20–40% markdowns on liquidation. The lesson for 2026 buyers: Rolex as a category is not a monolith. Value retention depends heavily on specific reference, condition, and whether the piece comes with box and papers (“full set”).
What’s Actually Driving 2026 Strength
- Retail price increases raise the floor. When a new Submariner retails at $10,050 (up from $9,500), a pre-owned example at $11,000–$12,000 suddenly represents a smaller premium — narrowing the gap without secondary prices actually moving.
- Supply discipline remains Rolex’s core lever. The brand has never confirmed production numbers, and secondary-market premiums remain entirely a function of Rolex’s own manufacturing decisions — a risk factor as much as a support.
- Certified Pre-Owned rollout. Rolex’s now fully rolled-out CPO program has changed how buyers transact in the used market, adding a layer of brand-verified legitimacy that supports pricing.
The Case for Rolex as a Portfolio Diversifier
Financial advisors increasingly frame luxury watches not as a replacement for equities or bonds, but as a tangible, historically low-correlation diversifier — one that carries its own risks (illiquidity, condition-dependent pricing, no yield) but has demonstrated multi-decade resilience for specific references.
Is Rolex a good investment in 2026?
It depends heavily on the specific reference. Steel sports models like the Submariner and Daytona have held or grown in value; two-tone and widely available dress models generally have not. Overall, Rolex’s secondary market rose about 7.9% year-over-year in 2026, trailing Patek Philippe but ahead of Audemars Piguet.
Discover more from The Economy
Subscribe to get the latest posts sent to your email.

Navigating Mortgage and Loan Refinancing in a High-Yield Environment
Global public debt crossing critical thresholds has kept central bank policies volatile, resulting in fluctuating US Treasury yields throughout 2026. For homeowners and commercial property holders burdened by previous high-interest borrowing cycles, finding optimal refinance windows has become a high-stakes financial puzzle. Stalled disinflation and stubborn employment numbers mean rate cuts are incremental, requiring borrowers to act with precision.
Timing your mortgage or commercial loan refinance in this environment requires a deep understanding of yield curve movements and lender risk appetites.
Decoding 2026 Refinance Dynamics
The 10-Year Treasury Yield Benchmark
Mortgage rates continue to track closely with the 10-year US Treasury yield. When macroeconomic anxiety spikes debt issuance, yields rise, tightening consumer borrowing capacity. Savvy borrowers monitor weekly Treasury auctions to lock in rates during brief dip windows.
Hybrid ARMs and Alternative Structures
With fixed rates remaining elevated, 7/1 and 10/1 adjustable-rate mortgages (ARMs) have surged in popularity. These products offer lower initial monthly payments, giving borrowers breathing room until central bank easing cycles fully materialize.
| Loan Product | Current Rate Range | Best For | Key Risk Factor |
| 30-Year Fixed Mortgage | 6.2% – 6.8% | Long-term predictability | Higher initial monthly outlay |
| 7/1 Hybrid ARM | 5.5% – 5.9% | Short-term ownership / flipping | Rate reset risk after year 7 |
| Commercial Refinance | 7.0% – 8.2% | Corporate asset restructuring | Strict DSCR lender covenants |
Actionable Steps for Successful Refinancing
To maximize your chances of securing favorable refinance terms in a volatile market, follow a disciplined preparation strategy.
Boost Your Credit Score Immediately: Lenders in 2026 are applying stringent credit tiering; a 20-point increase can drop your APR by a crucial quarter-point.
Shop Regional Credit Unions: Smaller financial institutions often offer portfolio loans with more flexible underwriting than major national banks.
Calculate the Break-Even Point: Ensure your total closing costs are recouped through monthly savings within 24 months of closing.
“Market Strategist View: Refinancing in 2026 is an exercise in opportunistic timing. Borrowers must maintain immaculate financial profiles ready to strike the moment Treasury yields dip.”
Mastering the complexities of today’s debt environment ensures you can successfully lower your debt service costs and protect your long-term financial stability.
Discover more from The Economy
Subscribe to get the latest posts sent to your email.

The days of pulling generic auto insurance quotes based purely on your zip code and age are officially over. In 2026, insurance comparison engines are powered entirely by generative AI and real-time telematics. These platforms digest thousands of live data points—ranging from your driving smoothness via connected vehicle sensors to real-time traffic congestion patterns—to generate hyper-personalized premiums instantly.
For consumers, this evolution represents both a massive opportunity for savings and a hidden trap for penalty pricing. Understanding how AI algorithms evaluate risk is essential for anyone looking to lower their monthly auto insurance premiums.
How AI Comparison Engines Evaluate Your Risk Profile
Behavioral Telematics and Connected Cars
Modern cars stream performance data directly to insurance aggregators. Generative AI models analyze braking sharpness, acceleration curves, cornering G-forces, and phone distraction metrics. Drivers who maintain smooth, defensive habits are rewarded with dynamic rate cuts of up to 40% compared to traditional rating tiers.
Predictive Traffic and Weather Modeling
AI tools now cross-reference your daily commute route with predictive weather and accident probability models. If your standard parking location or driving corridor has a statistically higher incidence of uninsured motorist claims, your quotes will reflect that hyper-local risk assessment.
| Comparison Factor | Traditional Rating Model | 2026 Generative AI Model | Impact on Premium |
| Mileage & Usage | Annual estimated odometer reading | GPS tracking & live trip duration | High (up to 35% savings) |
| Driving Behavior | MVR driving record & accidents | Real-time braking, speed, & G-force | Critical (determines tier) |
| Vehicle Tech | Make, model, and safety rating | ADAS calibration & repair cost data | Moderate |
Strategies to Lower Your AI-Driven Insurance Quote
To outsmart the algorithm and secure the lowest possible premium in 2026, drivers must proactively manage their digital footprint on insurance platforms.
Opt-In for Telematics Trial Periods: Many insurers offer immediate 15% discounts just for installing their driving app; let it track safe habits for 30 days to lock in permanent savings.
Scrub Unverified Public Records: Ensure your motor vehicle report is free of clerical errors that AI risk models misinterpret as reckless behavior.
Compare AI Aggregators: Use platforms that integrate multi-carrier API feeds rather than single-brand comparison sites to find the best risk-adjusted rate.
“Industry Note: AI-driven pricing rewards transparency and precision. Drivers who actively manage their telematics data consistently out-save those relying on legacy quote calculators.”
Embracing AI comparison tools allows savvy policyholders to customize coverage limits precisely to their driving habits, eliminating wasted premium spend while ensuring robust protection.
Discover more from The Economy
Subscribe to get the latest posts sent to your email.

China’s AI Microdrama Boom: How Beijing Is Reshaping Global Media

Q3 2026 Earnings Preview: Can Record Profit Expectations Keep Wall Street’s Rally Alive?

Russia Diesel Deal 2026: Oil Prices and Inflation Risks

Fed Rates 2026: Treasury Yields, Bonds and SGOV Explained

S&P 500 Market Breadth 2026: Weak Rally or Rotation?

The AI Capex Boom: Data Centers Reshaping Growth

Palantir Stock in 2026: Extraordinary AI Growth

Tesla Physical AI 2026: Robotaxis, Optimus and TSLA Risks

NVIDIA’s AI Grip in 2026: Record Revenue Is Only Half the Investment Story

Hormuz Diesel Shortage: Why Crude Oil Recovery Isn’t Enough

Social Security Extra $90 Deposit: Who Qualifies for the October 2026 Medicare Rebate?

Anthropic Bans Sustained Abuse of Claude AI Under New Usage Policy Effective November 12, 2026

Jeff Bezos Three-Day Workweek View: What He Really Said

Celeste Frozen Pizza Discontinued: What Conagra Confirmed

Oil Prices Break $100 in 2026: Middle East Conflict & Energy Markets

Middle East War Economics 2026: Oil Prices & Energy Markets

PSX Forecast 2026: KSE-100, IMF Reviews & Geopolitics

China Stocks Today: Are Big Economies in Asia Nearing a Market Bottom?

Crypto Daily Outlook: Bitcoin, Altcoins, and the Future of Decentralized Finance

Global Pension Systems Ranked: The World’s Best and Worst Retirement Frameworks

World’s Largest Economies: Ranking the Top Global Powers

Elon Musk’s Next Moves: Disrupting the 2026 Global Economy

Pakistan Economy 2026: Inside the SBP’s Balancing Act

GasBuddy Market Insights: How Crude Price Shifts Impact Local Fuel Cost Averages

World Bank & IMF Reports 2026: Why the “3% Growth” Consensus Is Actually a Debate

Global Equity Market Divergence: US Tech vs. European Dividend Stocks vs. Asian Growth

IMF & World Bank Global Economic Outlook: Growth Forecasts Across Europe and Asia

Silver Price Today: Why the Xi-Trump AI Standoff Is Fueling a Safe-Haven Rally
-

 Markets & Finance9 months ago
Top 15 Stocks for Investment in 2026 in PSX: Your Complete Guide to Pakistan’s Best Investment Opportunities
-

 Analysis8 months ago
Johor’s Investment Boom: The Hidden Costs Behind Malaysia’s Most Ambitious Economic Surge
-

 Analysis8 months ago
Top 10 Stocks for Investment in PSX for Quick Returns in 2026
-

 Banks9 months ago
Best Investments in Pakistan 2026: Top 10 Low-Price Shares and Long-Term Picks for the PSX
-

 Analysis8 months ago
Brazil’s Rare Earth Race: US, EU, and China Compete for Critical Minerals as Tensions Rise
-

 Investment9 months ago
Top 10 Mutual Fund Managers in Pakistan for Investment in 2026: A Comprehensive Guide for Optimal Returns
-

 Global Economy10 months ago
15 Most Lucrative Sectors for Investment in Pakistan: A 2025 Data-Driven Analysis
-

 Global Economy10 months ago
Pakistan’s Export Goldmine: 10 Game-Changing Markets Where Pakistani Businesses Are Winning Big in 2025