
Analysis
What Does the Iran Conflict Mean for Global Central Banks? The Answers Unfortunately Depend on How Long the Conflict Lasts
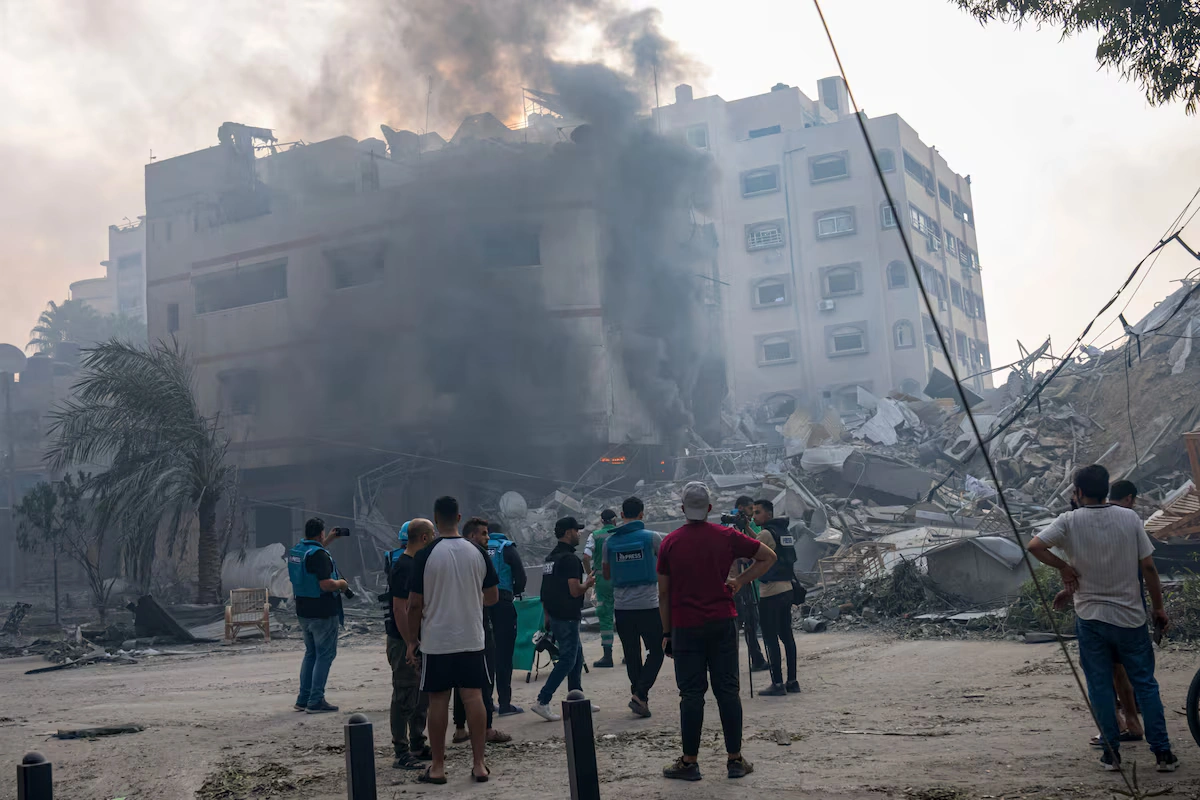
The strikes came before dawn on February 28, 2026. Within hours, the geopolitical architecture that central bankers had quietly priced into their models for years had collapsed — replaced by something far more volatile, far more dangerous, and infinitely harder to forecast. The US-Israel military campaign against Iran, which killed Supreme Leader Ayatollah Ali Khamenei along with more than 500 others in its opening salvo, did not just reshape the Middle East. It sent a seismic tremor through every trading floor, finance ministry, and central bank boardroom on the planet.
By the time Asian markets opened on March 3, the damage was already visible. Major indexes in Tokyo, Seoul, and Hong Kong shed between 2% and 2.5%. Gold — the world’s oldest fear gauge — surged past $5,330 per ounce, a record that would have seemed unthinkable even six months ago. Oil prices, already elevated by months of regional tension, lurched toward the $80–$100 per barrel range as traders frantically repriced the risk of Strait of Hormuz disruption. In Dubai and Abu Dhabi, explosions rattled skylines that had long marketed themselves as symbols of Gulf stability. Hezbollah activated across Lebanon’s southern border. US forces reported casualties in Kuwait.
Central banks — institutions built on the premise of calm, methodical deliberation — suddenly found themselves navigating a crisis with no clear runway.
The brutal truth, which policymakers in Washington, Frankfurt, Tokyo, and Mumbai are only beginning to articulate publicly, is this: what the Iran conflict means for global central banks depends almost entirely on how long the fighting lasts. Short-term containment leads to one playbook. A prolonged, multi-front war writes an entirely different one — and it is not a comfortable read.
The Oil Shock Ripple Effect
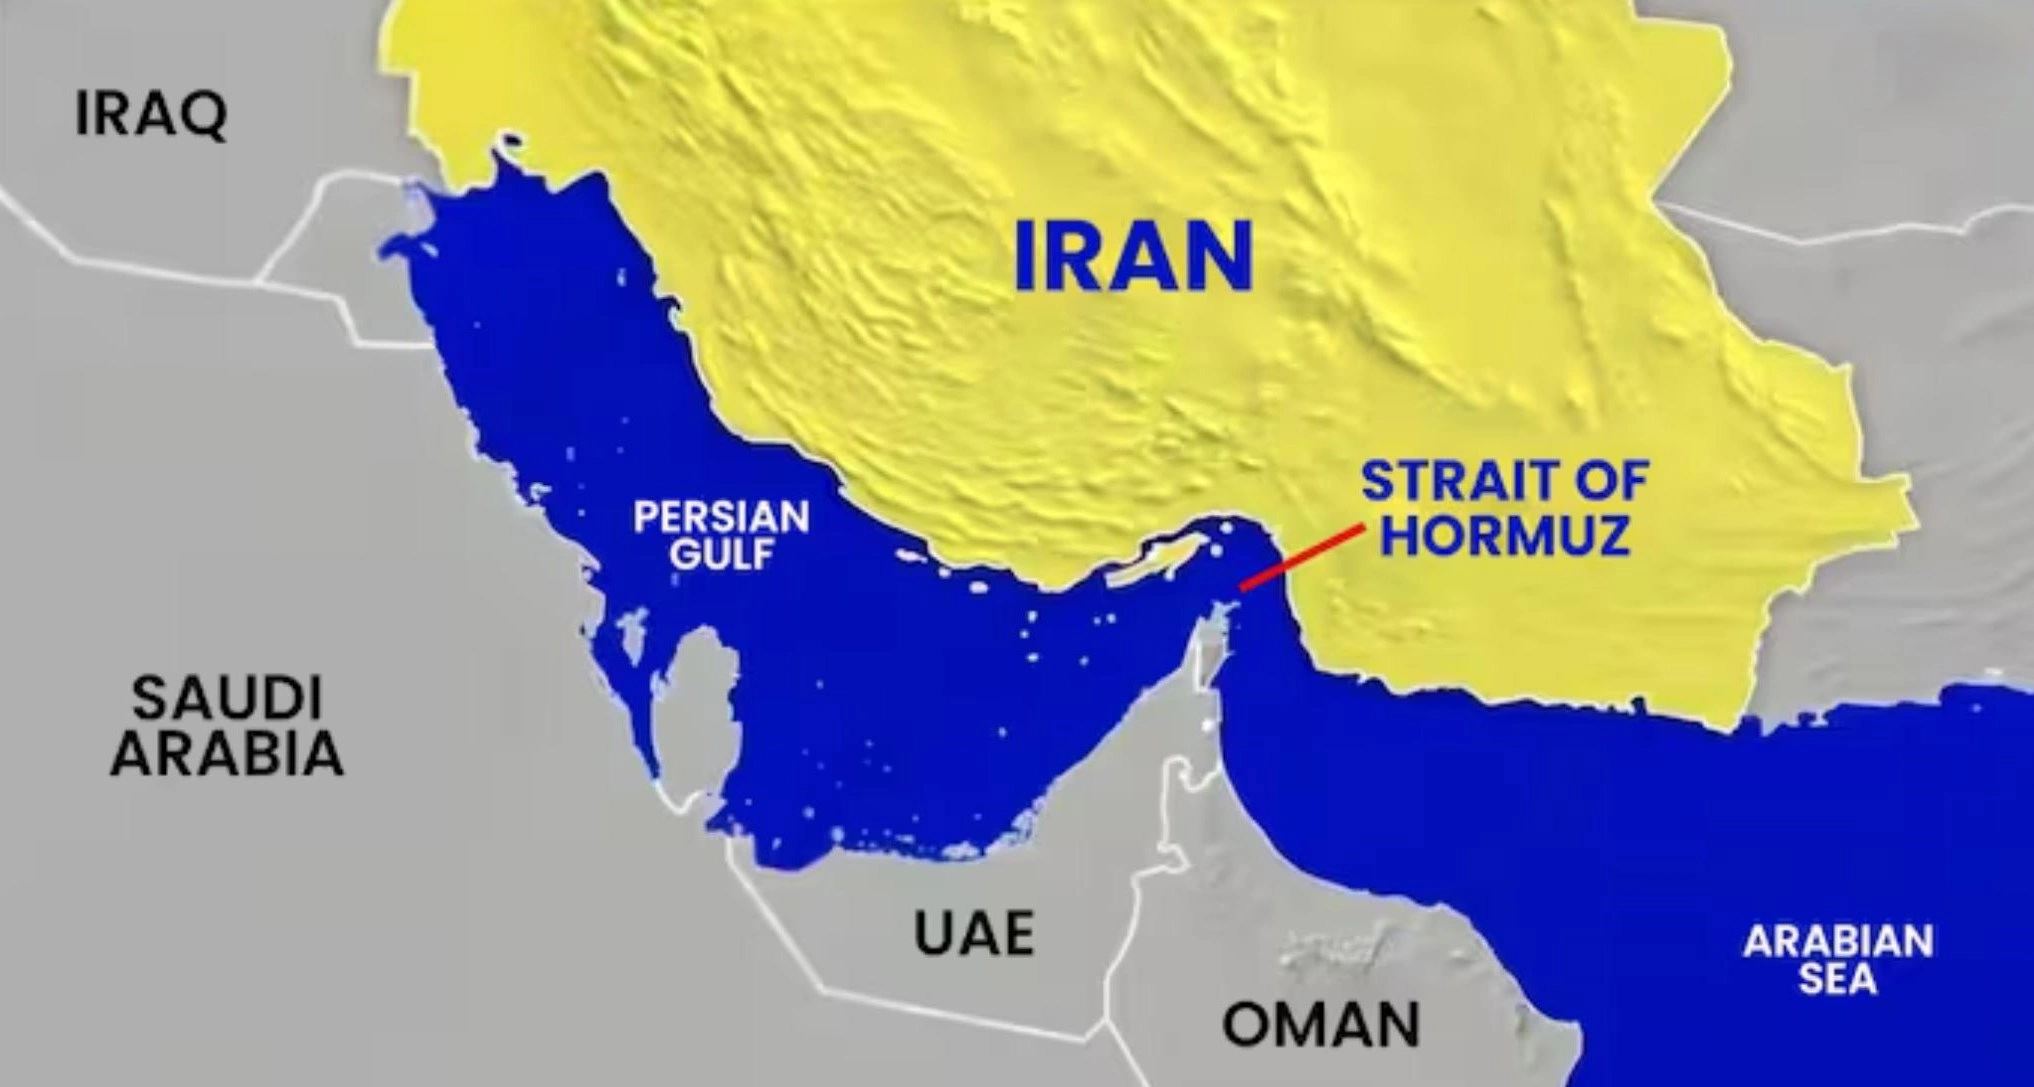
Start where every macroeconomist must start right now: oil. The oil shock from the Iran conflict is not merely a supply disruption story. Iran produces roughly 3.4 million barrels per day and controls strategic chokepoints through which nearly 20% of the world’s seaborne oil passes. As Reuters has reported, the preliminary market reaction already reflects deep anxiety about Hormuz closure scenarios, with Brent crude futures pricing in a war-risk premium not seen since the 2003 Iraq invasion.
But oil’s inflationary sting in 2026 arrives in a world that is structurally different from 2003 — or even 2022. Central banks in the US, Europe, and much of Asia spent two years aggressively tightening monetary policy to break post-pandemic inflation. Many were only beginning to ease. Rate cuts, cautiously telegraphed through late 2025, were supposed to provide relief to slowing economies. The Iran escalation has placed all of that in jeopardy.
A sustained move to $100/bbl or beyond would, according to JPMorgan’s commodities research desk, add approximately 0.5–0.8 percentage points to headline inflation across G7 economies within two quarters. For central banks already wrestling with “last-mile” disinflation — the stubborn core inflation that resists rate cuts — this is precisely the wrong kind of supply shock at precisely the wrong time.
Key inflationary transmission channels to watch:
- Fuel and energy — the most direct pass-through, affecting transport, manufacturing, and utilities within weeks
- Food prices — fertilizer costs, shipping rates, and agricultural logistics all move with oil
- Supply chain repricing — firms that endured 2022 may move faster to rebuild inventory buffers, driving input cost inflation
- Freight and insurance premiums — Gulf routing disruptions could spike global shipping costs by 30–60%, echoing Red Sea crisis dynamics from 2024
The Fed’s Dilemma in a Volatile World
No institution faces a more acute version of this dilemma than the US Federal Reserve. The impact of Iran war on the Federal Reserve is simultaneously an inflation problem, a growth problem, and a financial stability problem — all arriving at once.
Coming into February 2026, the Fed had cut rates twice from their 2024 peak and was widely expected to deliver two more cuts before year-end. That calculus is now suspended. The Fed finds itself caught between two uncomfortable poles: ease too aggressively, and it risks embedding a new inflation psychology at a moment when energy prices are spiking; hold rates too long, and it risks amplifying the contractionary demand shock that always accompanies serious geopolitical disruptions.
As the New York Times noted in its initial conflict coverage, investors are already pulling back from risk assets in patterns that mirror early COVID-era capital flight. The dollar, paradoxically, has strengthened — a typical safe-haven response — even as US equities fell. This complicates the Fed’s domestic picture: a stronger dollar tightens financial conditions without any Fed action at all.
Fed Chair messaging in the days since the strikes has been notably cautious. Expect extended “data-dependent” language that essentially means: we are waiting to see if this is a 10-day conflict or a 10-month one. The Iran geopolitical risks to monetary policy are simply too scenario-dependent for the Fed to commit to a forward path right now.
Short conflict (under 30 days): Fed likely stays on hold for one meeting cycle, resumes cut trajectory by Q2 2026 if oil retreats below $85/bbl. Prolonged conflict (3–6+ months): Fed pauses all easing indefinitely; potential rate hike discussion re-emerges if inflation re-accelerates above 3.5%.
ECB and BoE: Balancing Inflation and Growth
If the Fed’s dilemma is painful, the European Central Bank’s is arguably worse. The question of how the Iran war affects ECB rate cuts lands in a Eurozone economy that was already decelerating. Germany, never fully recovered from the energy shock of 2022–23, is particularly exposed. Europe imports roughly 90% of its oil needs, and unlike the US, it has no domestic production buffer to cushion a Gulf supply shock.
The ECB had been navigating a gentle easing cycle — the most delicate in its history — threading the needle between a weakening German industrial base and still-elevated services inflation in southern Europe. A sustained oil shock from the Iran conflict snaps that thread. ECB President Christine Lagarde faces the same stagflationary ghost that haunted her predecessor during the 2022 energy crisis: slowing growth and rising prices, with no clean policy response to either.
ING Think’s macro team estimates that a $20/bbl sustained oil increase above baseline adds roughly 0.4 percentage points to Eurozone CPI — enough to delay the ECB’s rate-cut path by at least two meetings. The Bank of England faces near-identical mathematics, compounded by the UK’s unique vulnerability to financial market volatility given London’s role as a global trading hub.
European central bank scenario matrix:
| Conflict Duration | ECB Response | BoE Response |
|---|---|---|
| Under 30 days | Pause cuts by 1 meeting | Pause cuts by 1 meeting |
| 1–3 months | Suspend 2026 cut cycle | Suspend 2026 cut cycle |
| 3–6 months | Consider emergency liquidity tools | Emergency repo window activation |
| 6+ months | Full stagflation protocol | Coordinated G7 response likely |
Asian Central Banks on High Alert
The dimension most underreported in Western financial coverage is the pressure now bearing down on Asian central banks amid Iran oil prices. And the pressure is severe — for reasons both economic and geopolitical.
Japan imports almost all of its energy. The Bank of Japan, only recently beginning its long-awaited normalization after decades of ultra-loose policy, faces a genuine threat to that trajectory. A sustained oil shock would push Japanese import costs sharply higher, weakening the yen and importing inflation through a channel the BoJ cannot easily offset with rate policy alone.
India’s Reserve Bank presents a different but equally acute case study. India is the world’s third-largest oil importer, and energy subsidies remain politically sensitive. The RBI, which had been managing a careful balance between rupee stability and growth support, now faces the prospect of renewed currency pressure as oil costs inflate the current account deficit. The Atlantic Council’s energy security desk has flagged India, Pakistan, and several Southeast Asian economies as particularly vulnerable to a prolonged Gulf conflict, given their lack of strategic petroleum reserve depth.
China occupies an ambiguous position. As a major oil importer, China suffers from higher prices. But China also has significant diplomatic and economic ties to Iran and may see strategic opportunity in a prolonged US military entanglement in the Middle East. The People’s Bank of China will likely prioritize yuan stability and domestic liquidity above all else, potentially accelerating yuan-denominated oil trade deals as a longer-term structural response.
Asian central bank pressure points at a glance:
- 🇯🇵 Bank of Japan — normalization path threatened; yen weakness accelerating
- 🇮🇳 Reserve Bank of India — current account stress, rupee under pressure, inflation uptick risk
- 🇰🇷 Bank of Korea — export growth headwinds; equity market selloff creating financial stability concern
- 🇨🇳 People’s Bank of China — yuan stabilization priority; watching US dollar dynamics closely
- 🇸🇬 Monetary Authority of Singapore — trade-dependent economy faces dual shock from oil and risk-off capital flows
uration Matters: Short vs. Long-Term Scenarios
Here is the honest reckoning that every central banker is running privately right now — and every investor should be running too.
Scenario A: Contained Conflict (Under 30 Days)
If the US-Israel campaign achieves its military objectives quickly, Iran’s retaliatory capability is degraded, and the Strait of Hormuz remains open, then oil markets could normalize toward $75–80/bbl within weeks. Gold would likely retrace from its record highs. Central banks — Fed, ECB, BoE, and the major Asian institutions — would pause briefly, absorb the data, and resume their pre-conflict trajectories by mid-2026. This is the market’s base case as of early March, reflected in the relatively contained (if painful) equity selloffs.
Scenario B: Prolonged Conflict (3–6+ Months)
This is where the geopolitical risks to the global economy in 2026 become genuinely systemic. A multi-month war involving Iranian missile campaigns, Hezbollah front activation, and potential Hormuz closure would constitute the most significant energy supply shock since 1973. In this scenario:
- Oil sustains above $100/bbl, potentially spiking toward $130–150/bbl in a Hormuz closure event
- Global inflation re-accelerates, forcing central banks into a new tightening cycle — or at minimum, abandoning all planned easing
- Recession risk in Europe rises sharply; US growth slows materially
- Emerging markets with dollar-denominated debt face a brutal combination of a strong dollar, high oil, and capital flight
- Central banks may be forced into rare coordinated action — reminiscent of 2008 and 2020 — to stabilize financial markets
As the Wall Street Journal’s economics desk has observed, the policy toolkit for stagflationary shocks is genuinely limited. You cannot simultaneously fight inflation and support growth through conventional rate policy. Something has to give.
The Deeper Question: Is Monetary Policy Even the Right Tool?
There is a broader, uncomfortable truth buried in all of this analysis. Central banks are being asked to manage consequences of a geopolitical crisis they had no hand in creating and no power to resolve. The Iran conflict and central banks narrative often implies that the right interest rate setting can somehow insulate economies from war. It cannot.
What monetary policy can do is prevent a supply shock from becoming a permanent inflation psychology, maintain financial system liquidity, and signal credibility to markets under stress. What it cannot do is replace the barrels of oil that stop flowing, rebuild the supply chains disrupted by Gulf instability, or restore the business confidence shattered by images of explosions in Dubai.
The Financial Times’ coverage of central bank responses has rightly noted that the real test will be coordination — between central banks, between fiscal authorities, and between allied governments on strategic petroleum reserve releases. The International Energy Agency has already begun consultations on coordinated SPR deployment, a move that could take as much as 1.5–2 million barrels per day of supply pressure off the market if executed at scale.
Central Bank Response Comparison Table
| Central Bank | Pre-Conflict Stance | Short Conflict Response | Prolonged Conflict Response |
|---|---|---|---|
| US Federal Reserve | Gradual easing | Pause cuts, hold | Halt easing; hike risk if inflation >3.5% |
| European Central Bank | Gentle easing cycle | Delay 1–2 cuts | Suspend cycle; stagflation protocol |
| Bank of England | Cautious easing | Hold and reassess | Emergency liquidity measures |
| Bank of Japan | Early normalization | Slow normalization | Pause; defend yen via intervention |
| Reserve Bank of India | Neutral/mild easing | Currency intervention | Rate hold; capital flow management |
| People’s Bank of China | Selective stimulus | Yuan stabilization | Accelerate alternative trade mechanisms |
| Bank of Korea | Hold | Hold; equity market monitoring | Emergency rate cut risk if recession |
What History Tells Us — And Why 2026 Is Different
The 1973 Arab oil embargo. The 1979 Iranian Revolution. The 1990 Gulf War. The 2003 Iraq invasion. Each of these conflicts produced oil shocks that reshaped monetary policy for years. But 2026 is different in several important ways that make simple historical analogies dangerous.
First, central banks enter this crisis with far less policy room than they had in most prior episodes. Interest rates, while off their peaks, remain above neutral in most major economies. Quantitative easing balance sheets are still elevated. The “whatever it takes” toolkit is not empty — but it is leaner.
Second, the global economy in 2026 is more financially interconnected than at any prior point in history. Sovereign wealth funds from the Gulf states manage trillions in global assets. A prolonged conflict could force asset liquidations that ripple through bond and equity markets in ways entirely unrelated to oil prices themselves.
Third — and perhaps most importantly — this conflict involves direct US military action, not proxy involvement. The geopolitical risk premium on the dollar, on US Treasuries as safe havens, and on the broader rules-based international economic order is being repriced in real time.
Conclusion: Diversify, Stay Informed, and Resist Panic
The honest answer to the question posed in this article’s headline is also the most unsatisfying one: we don’t know yet. The Iran conflict’s meaning for global central banks will be written in the days and weeks ahead as the military situation either stabilizes or deepens.
What we do know is this: central banks will be reactive, not proactive. They will watch oil, watch inflation expectations, watch currency markets, and watch credit spreads with extraordinary vigilance. They will communicate carefully and commit cautiously. And they will be managing the consequences of a war, not solving it.
For investors, the message is equally clear. Geopolitical risks to the global economy in 2026 are no longer tail risks — they are the central scenario. Portfolios built on the assumption of continued easing cycles and stable energy markets need urgent reassessment.
Consider speaking with a qualified financial advisor about:
- Energy sector exposure and commodity diversification
- Safe-haven asset allocation (gold, CHF, JPY in a contained scenario)
- Duration risk in bond portfolios given inflation uncertainty
- Emerging market exposure, particularly in oil-importing Asian economies
- Geographic diversification away from single-region concentration
The world’s central banks are doing what they always do in moments like this: buying time, gathering data, and hoping the politicians and generals resolve the crisis before they are forced to make decisions no monetary tool was designed to handle. The rest of us would be wise to prepare for the possibility that this time, the hoping may not be enough.
Sources & Further Reading:
- Reuters: How US-Iran tensions could shape world markets
- New York Times: Investors Brace for Stock Market’s Reaction
- Wall Street Journal: What the Iran Conflict Means for the Global Economy
- Financial Times: What does the Iran conflict mean for global central banks?
- JPMorgan Commodities Research
- Atlantic Council: Gulf Energy Security
- ING Think: Eurozone Macro Analysis
Discover more from The Economy
Subscribe to get the latest posts sent to your email.


Supply shocks, collapsing buffers, and the geopolitical reckoning Asia can no longer defer
Picture a tanker called the MV Rich Starry — flying a Malawian flag, which is an intriguing choice for a landlocked country — spoofing its AIS position for eleven days, loaded with methanol officially declared as originating from a UAE port. When the US naval blockade of Iranian waters took effect in April 2026, the vessel turned back once, then slipped through the Strait of Hormuz on a second attempt. That single ship, as investigated by the Jerusalem Post, tells the story of Asia’s energy crisis more honestly than any ministerial communiqué: the workarounds still exist, but they are getting thinner, costlier, and more dangerous by the day.
For the past four years, China and India ran a sophisticated arbitrage against Western sanctions and Middle Eastern volatility. They bought Russian crude at steep discounts, warehoused Iranian barrels through opaque intermediaries, and leaned on floating storage to buffer supply disruptions. That system is now under terminal stress. Since the US-Israeli strikes on Iran on February 28, 2026 triggered the effective closure of the Strait of Hormuz, Asian buyers have discovered that their carefully assembled safety net has very few knots left to hold.
The IEA’s April 2026 Oil Market Report describes this as ‘the largest disruption in the history of the global oil market.’
The consequences are no longer theoretical. The International Energy Agency’s April 2026 Oil Market Report describes this as the largest disruption in the history of the global oil market — a designation that should concentrate minds in every capital from New Delhi to Beijing to Washington.
What Asia Did to Avoid a Supply Shock
The story of Asia’s Hormuz workarounds begins, predictably, with Russia’s invasion of Ukraine in February 2022. When Western sanctions stranded Russian crude, China and India positioned themselves as buyers of last resort. By late January 2026, China was receiving nearly 1.7 million barrels per day of Russian crude at Chinese ports — a record — while India had overtaken Europe as Moscow’s top client. The discounts were generous enough that Beijing’s state and private refiners alike suspended their usual commercial caution.
China’s strategy was more elaborate than simple opportunism. A House Select Committee report published in early 2026 documented how Beijing assembled a strategic petroleum reserve of approximately 1.2 billion barrels by early 2026 — equivalent to 109 days of seaborne import cover — built largely from sanctioned crude purchased through a shadow fleet of roughly 138 tankers. Iran, Russia, and Venezuela supplied roughly one-fifth of China’s total oil imports through this system, each barrel arriving at a discount of $8–$12 below Brent.
India took a more pragmatic, less organised approach. New Delhi redirected refinery procurement toward discounted Urals, expanded its bilateral energy dialogue with Moscow, and quietly tolerated shadow-fleet vessels on its import routes. It also struck long-term LPG supply agreements with the United States, securing around 2–2.2 million tonnes annually from 2026. Diversification was underway — but it was partial, slow, and critically dependent on Hormuz remaining open for the bulk of its imports.
Why Those Buffers Are Shrinking Now
China’s Teapot Refineries: A Clever Hedge That Is Running Hot
The architecture of China’s hedge is holding — barely. Beijing’s roughly 1.2 billion barrel reserve did what it was designed to do: buy time. But the country has already responded by banning refined fuel exports, cutting Sinopec refinery runs, and imposing its largest domestic retail price hike since 2022. These are not the actions of a country with comfortable headroom. They are triage.
The shadow fleet itself is under pressure. Between December 2025 and February 2026, US authorities interdicted nine shadow fleet tankers across the Caribbean, Atlantic, and Indian Ocean in Operation Southern Spear. Meanwhile, Kpler data shows that China’s Iranian crude discharges fell to 1.138 million barrels per day in February 2026, down from 1.4 million bpd the previous month, as buyers grew wary ahead of military escalation. Russia rapidly filled part of that gap — Chinese customs records showed Russian crude shipments rising 40.9 percent in the first two months of 2026 — but at rising cost and logistical complexity.
Most critically, the IEA’s April report reveals that global observed oil inventories fell by 85 million barrels in March 2026, with stocks outside the Middle East Gulf drawn down by a devastating 205 million barrels — 6.6 million barrels per day — as Hormuz flows were choked off. The Middle East’s landlocked floating storage swelled by 100 million barrels of crude that cannot move. The buffer is not being replenished; it is being consumed at an accelerating rate.
India’s LPG Crisis: The Political Bomb Beneath the Gas Cylinder
India’s vulnerability is more acute and more politically dangerous. Data from the Petroleum Planning and Analysis Cell shows that LPG production in January 2026 stood at 1.158 million tonnes while imports reached 2.192 million tonnes. More than 90 percent of those imports transited the Strait of Hormuz. India’s total LPG storage capacity is approximately 1.9 million tonnes, or roughly 22 days of supply according to S&P Global Commodity Insights — dangerously thin for a nation whose clean-cooking programme spans 300 million households.
The results have been immediate: restaurants limiting operations, panic buying of cylinders, and queues at gas agencies in Jharkhand and other states. Bloomberg reported in mid-March that two state-owned LPG tankers required diplomatic clearance for safe passage — a measure of how desperate the situation had become when individual cargo movements needed ministerial-level intervention.
Market and Price Implications: When the Discounts Disappear
The market mathematics of Asia’s predicament are brutal. In early April 2026, loadings through the Strait averaged just 3.8 million barrels per day, compared to more than 20 million bpd in February. Alternative export routes — Saudi Arabia’s Red Sea terminals, the UAE’s Fujairah port, Iraq’s Ceyhan pipeline — had scaled to 7.2 million bpd from under 4 million bpd, but that still leaves a gap of nearly 10 million bpd the global market cannot fill.
Brent crude, which traded around $71 a barrel before the conflict, surged above $100 by early March and reached approximately $130 per barrel by the time of the IEA’s April report — some $60 above pre-conflict levels. Physical crude reached near $150/bbl at points, with the physical-futures disconnect becoming increasingly acute as refiners scrambled for spot cargoes.
The era of discounted Russian and Iranian crude — which underpinned Asia’s refining economics for three years — is effectively over for the duration of this crisis.
China’s independent Shandong refineries, which processed 90 percent of Iranian crude, now face replacement barrel costs of $10–12 more per barrel. Asian refiners have cut runs by around 6 million barrels per day — a contraction now feeding through into jet fuel and diesel shortages from Thailand to Pakistan.
The Federal Reserve Bank of Dallas estimates that a full closure removing 20 percent of global oil supplies for one quarter could raise WTI prices to $98/bbl and reduce global real GDP growth by 2.9 percentage points annualised. These were conservative assumptions relative to what has unfolded.
Geopolitical and Policy Fallout: India’s Vulnerability, China’s Calculated Gamble
The divergence between India and China’s positions is instructive. China entered this crisis with a 109-day reserve and a shadow fleet purpose-built for sanctions evasion. It has responded by restricting domestic fuel exports — prioritising its own economy — and calibrating its Iran relationship to maximise leverage. Beijing’s calculation is whether to pressure Tehran toward a deal using its status as Iran’s sole meaningful customer, or to continue running the shadow fleet and absorb US secondary sanctions risk.
India had no such cushion. With around 2.5–2.7 million barrels per day arriving through Hormuz — nearly half its import requirement — New Delhi faces a structural vulnerability it cannot resolve through diplomacy alone. In April 2026, the Modi government signed a deal to import sanctioned Russian LNG, a move that risks straining relations with Washington even as India courts US energy partnerships.
Regional contagion is accelerating. Malaysia ordered civil servants to work from home to conserve fuel. Japan and South Korea, sourcing roughly 95 percent and 70 percent of their crude from the Middle East respectively, are measuring remaining supply in weeks. The World Economic Forum’s April 2026 analysis warns the disruption extends beyond oil: a third of global seaborne methanol trade, nearly half of global sulfur exports, and 46 percent of global urea trade all pass through the strait — compounding food security and industrial supply risks across Asia’s agricultural economies.
The IEA has coordinated the largest emergency reserve draw in history — 400 million barrels — but that covers roughly four days of what the market has lost.
What Comes Next: Policy Prescriptions Before the Next Shock
The immediate priority is diplomacy, not logistics. Resuming flows through the Strait of Hormuz remains, as the IEA bluntly states, “the single most important variable in easing the pressure.” The April 2026 ceasefire provided temporary respite, but Iran’s initial statement that the strait was “completely open” was almost immediately contradicted by Revolutionary Guard conditions for transit.
For the medium term, three structural reforms should be non-negotiable for any Asian government serious about energy security.
First, strategic stockpile expansion. India’s 22-day LPG reserve is dangerously inadequate for a 1.4 billion-person democracy. New Delhi should target 60 days of LPG cover — financed through a transparent cess on cylinder sales — comparable to its strategic crude oil reserve.
Second, genuine route diversification. The Eastern Maritime Corridor from Vladivostok to Chennai is operational for crude, but requires stress-testing for LPG and refined products. India and Japan should jointly finance infrastructure at Oman’s deep-water ports at Duqm and Salalah — both of which sustained drone damage in March 2026, underscoring that even bypass routes require protection frameworks.
Third, accelerated energy transition investment — not as idealism but as hard security infrastructure. Every gigawatt of renewables installed in South and East Asia reduces the volume of crude that must transit a waterway controlled by an adversarial power. The IEA has noted that this crisis may accelerate the clean energy shift — but only if Asian governments treat it as such, rather than racing to replace barrels with barrels.
The lesson of the past eight weeks is not that Asia’s energy planners were naive — they were rational. The error was in believing the workarounds would last indefinitely.
The error was in believing they would last indefinitely. The arithmetic of dependency has now been written in crude oil prices above $130 a barrel, queues at gas agencies in Jharkhand, and a single Malawian-flagged tanker deciding whether to run a naval blockade.
Asia’s energy policymakers have one useful gift from this crisis: clarity. The alternatives to Hormuz are not gone, but they are exhausted as a primary strategy. What comes next must be built on sturdier foundations — and built now, before the next closure.
BIBLIOGRAPHY
1. IEA (April 2026). Oil Market Report — April 2026
4. Bloomberg (March 14, 2026). Two LPG Ships Sail Through Hormuz to Shortage-Hit India
10. Bloomberg (2026). Iran War: How High Could Oil Prices Get with Strait of Hormuz Closure?
Discover more from The Economy
Subscribe to get the latest posts sent to your email.

Warsaw’s plan to monetize 550 tonnes of bullion for military spending rests on shaky legal ground, pits president against prime minister, and risks dismantling the sovereign hedge Poland spent a decade building.
Poland has spent the better part of a decade accumulating gold with the intensity of a nation preparing for something it hopes never comes. It now holds 550 tonnes of the metal — worth roughly $89 billion at end-January 2026 prices — making the National Bank of Poland (NBP) the 11th-largest central bank gold holder on Earth, surpassing even the European Central Bank. That achievement, engineered by NBP Governor Adam Glapiński, was celebrated in Warsaw as a statement of financial sovereignty. Then, in a single week in early March, Glapiński proposed turning the crown jewels into cannon fodder. Finance Minister Andrzej Domański’s response was swift and withering: the scheme, he said, was nothing more than “fairy tales” that “finances nothing.” He is right — and the political theatre surrounding this Poland gold reserves sale proposal reveals far deeper fractures in Warsaw’s strategic architecture than the headlines suggest.
The Glapiński Proposal: Gold as a Defense Instrument
On March 4, 2026, President Karol Nawrocki stood before cameras alongside Glapiński to announce what they branded “Polish SAFE 0%”: a sovereign, interest-free alternative to the European Union’s €150 billion Security Action for Europe (SAFE) rearmament loan programme. The central bank chief had presented to Nawrocki a proposal to generate up to 48 billion zloty — approximately $13 billion — by selling down a portion of Poland’s gold reserves and then buying them back at a later date, according to people familiar with the discussions who spoke to Bloomberg on condition of anonymity.
The political backdrop is important. Nawrocki and his allies in the opposition Law and Justice (PiS) party have long attacked the EU’s SAFE programme as an infringement on Polish sovereignty, objecting particularly to the rule that at least 65 percent of procurement contracts must go to European suppliers — a constraint that would limit Warsaw’s ability to buy American F-35 fighters and South Korean artillery systems. The president described SAFE as “costly” and warned it would “jeopardize ties with Washington,” a position that aligns conveniently with the Trump administration’s own derision of the programme.
The optics of “paying for weapons with gold” carry undeniable nationalist appeal. The substance is considerably less solid.
Why the Legal Architecture Is Broken
“We cannot use any part of the reserves in the sense that part of the reserves will be transferred, because it is against the law.” — Adam Glapiński, NBP Governor, March 5, 2026
The NBP’s own governor, in the same breath as pitching the plan, acknowledged its primary legal obstacle: the central bank is prohibited by Polish law from directly financing the government. The bank is, however, required to transfer almost its entire annual net income to the state budget — a mechanism that theoretically could be leveraged if legislative conditions were changed. Glapiński confirmed he is “working on a plan” and that the NBP could transfer “several dozens of billions of zloty in profits a year” if new legislation were passed, subject to consultations with the ECB.
That is a very large “if.” Finance Minister Andrzej Domański dismissed the Nawrocki-Glapiński scheme as “fairy tales” that “finances nothing,” pointing out that the NBP has run at a net loss for several consecutive years — meaning the profit-transfer mechanism is, at present, generating no revenue at all. The bank’s paper gains on gold are real — unrealised profits from gold price appreciation amount to approximately 197 billion zloty, or roughly $54 billion — but converting those book gains into actual defence procurement requires legislative engineering that would, at minimum, need ECB sign-off and likely trigger a constitutional challenge in Poland’s already-paralysed court system.
The plan to sell gold and buy it back later is equally fraught. At current prices — gold briefly surpassed $4,400 per troy ounce in early 2026 before pulling back — there is no guarantee that repurchase prices will be lower. Poland would be selling at a market peak and betting on a future correction to reconstitute reserves. That is speculation, not strategy.
The Political Rupture: A President Against His Own Government
The gold gambit cannot be understood apart from Poland’s increasingly dangerous constitutional deadlock. Nawrocki vetoed the SAFE Financial Instrument Act on March 12, 2026, blocking Warsaw’s access to €43.7 billion — the largest allocation any EU member secured under the programme. Prime Minister Donald Tusk’s reaction was unsparing: “Poland is in shock,” he said. Foreign Minister Radosław Sikorski called the veto “national treason.”
What is remarkable is that Poland stands alone on NATO’s eastern flank as the only country where SAFE has become a political battlefield rather than a shared strategic asset. Lithuania, Estonia, Latvia, and Romania all moved swiftly to access the programme. Warsaw, the neighbour of Ukraine and the country spending the highest share of GDP on defence in NATO — an estimated 4.5 percent in 2025, alongside Lithuania — is now mired in a domestic dispute that could slow the very military buildup it claims to prioritise.
Tusk has vowed to access the SAFE funds regardless of the veto, though doing so without the implementing legislation means less flexibility: border guard modernisation, police upgrades, and infrastructure improvements would be ineligible. The government argues it can proceed through existing legal frameworks; the opposition has threatened prosecution before the State Tribunal.
Into this vacuum, the gold proposal has been inserted — less as a serious financing mechanism and more as a political instrument designed to give Nawrocki cover for blocking €44 billion in EU loans.
Poland’s Gold Strategy: A Decade-Long Achievement at Risk
To understand why the gold sale plan has rattled observers, it is necessary to appreciate the scale of Poland’s accumulation strategy. In 2018, the NBP held just 103 tonnes of gold. By January 2026, that figure had reached 550 tonnes — a more than fivefold increase. In the first quarter of 2025 alone, Poland purchased 48.6 tonnes, maintaining its position as the world’s top central bank gold buyer, acquiring nearly half its full-year 2024 total in a single quarter. Glapiński had announced in January 2026 plans to purchase a further 150 tonnes — bringing the target to 700 tonnes, which would cement Poland among the world’s ten largest central bank gold holders.
The rationale was explicitly defensive: gold provides a hedge against credit risk, currency devaluation, and geopolitical shock. As recently as May 2025, Glapiński himself declared that selling gold was “absolutely out of the question,” describing it as “a strategic asset for the state’s security.” Gold now constitutes 28.22 percent of Poland’s total foreign exchange reserves — up from 16.86 percent in 2024 — one of the fastest structural shifts in any central bank’s reserve composition worldwide.
To now contemplate selling that buffer — even temporarily — at a moment of peak geopolitical risk, and to do so in order to circumvent a proven multilateral financing mechanism, is not sovereignty. It is circular logic: dismantling the strategic shield to pay for the swords that were supposed to replace it.
The Comparative Evidence: When Central Banks Sell Gold, It Rarely Goes Well
History is instructive here. The United Kingdom’s decision to sell roughly half its gold reserves between 1999 and 2002 — near the bottom of a two-decade bear market — became notorious as “Brown’s Bottom,” named for then-Chancellor Gordon Brown. The sales, totalling 395 tonnes, were executed at prices between $256 and $296 per troy ounce. At 2026 prices above $4,000 per ounce, the cost of that decision exceeds $50 billion in forgone reserves.
Poland would be making the mirror-image error: selling at or near a cyclical peak, locking in revenue that assumes gold prices either stay elevated for repurchase or — implausibly — decline after the sale. Gold erased much of its 2026 gains in a single session in March, falling from above $4,400 to near $4,400 per ounce, partially on the very rumour of Polish sales. That price sensitivity should give Warsaw pause: a nation holding 550 tonnes cannot sell without affecting the price it receives.
More broadly, the trend among central banks in spring 2026 has moved decisively toward selling. Turkey’s central bank sold approximately 131 tonnes in March alone — its largest divestment in seven years — to defend the lira against currency pressure. Russia has been liquidating reserves to fund its war in Ukraine. These are distressed sellers. Poland is not in distress. It would be manufacturing the conditions for a strategic own goal.
The Right Path: SAFE, Sovereignty, and Strategic Coherence
The policy prescription here is straightforward, even if the politics are not. Poland should sign the SAFE implementing legislation — or, given the presidential veto, should press ahead with Plan B access through existing legal frameworks, accepting the reduced flexibility that entails. The €43.7 billion available is real, structured, and purpose-built for exactly the kind of military modernisation Warsaw requires: air defence, cyber operations, heavy artillery, and the industrial base to sustain them.
Defence Minister Władysław Kosiniak-Kamysz put the case better than any analyst could: “SAFE is a project written not in Brussels, but in Warsaw. The European Commission adopted the proposal at Poland’s request and at our dictation.” That authorship matters. This is not Brussels imposing conditions on Poland; it is Poland’s own generals’ procurement priorities, funded at zero percent interest over a five-year window.
The NBP’s gold, meanwhile, should stay exactly where it is — in vaults, as a genuine reserve asset, growing toward the 700-tonne target that would rank Poland among the world’s top sovereign bullion holders. Glapiński was right in May 2025 when he said selling was “absolutely out of the question.” He should return to that position.
Poland has built something rare: genuine financial sovereignty underwritten by hard assets. The mirage is not EU dependency. The mirage is the idea that the fastest path to security runs through the vaults of the central bank, in the wrong direction.
The most powerful weapon in any nation’s arsenal is not one it can buy with gold — it is the institutional coherence that allows it to make rational decisions under pressure.
Discover more from The Economy
Subscribe to get the latest posts sent to your email.
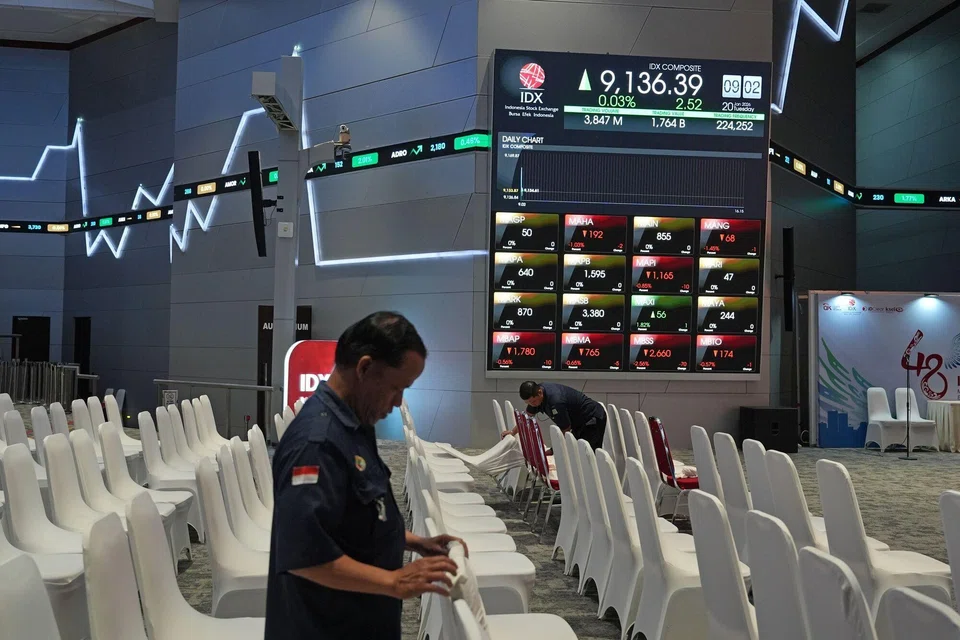
In a landmark investability review, MSCI has moved to boot tycoon-owned Indonesian stocks — most prominently PT Barito Renewables Energy (BREN) and PT Dian Swastatika Sentosa (DSSA) — from its global indices ahead of its May 2026 rebalancing, citing opaque shareholding structures and concerns over coordinated trading that undermines price formation. The Jakarta Composite Index (JCI) has already shed approximately $80 billion in market value since MSCI first raised alarm in January, and passive fund outflows from BREN and DSSA alone are estimated at IDR 15 trillion. This article argues that the MSCI intervention is not merely a technical reweighting exercise — it is a structural forcing function that exposes the incompatibility of Indonesia’s oligarchic ownership model with the standards demanded by global capital markets.
When MSCI announced in January 2026 that it would freeze all index additions for Indonesian securities and place the country’s emerging-market status under formal review, the reaction in Jakarta was instantaneous and brutal. The benchmark Jakarta Composite Index plunged 7.4% in a single session — the steepest one-day drop in nine months — triggering a 30-minute market halt. The following day, the index fell a further 10%, cascading to 7,482 and forcing three trading halts across two sessions. Roughly $80 billion in market capitalisation was erased in the span of 48 hours.
The trigger was a four-page statement from the New York-headquartered index compiler that used the driest possible regulatory language to say something explosive: Indonesia’s largest listed companies were too tightly controlled by their founders to be reliably investable. MSCI boots Indonesian tycoon-owned stocks from indices not merely as a routine methodological housekeeping — but as a verdict on decades of governance neglect that global institutional investors can no longer afford to overlook.
Background: How Indonesia Built a Market on Billionaire Foundations
The Jakarta Stock Exchange has long been dominated by family-owned conglomerates whose listed subsidiaries span mining, banking, tobacco, petrochemicals and renewable energy. According to data compiled by PT Trimegah Sekuritas, the top 20 tycoon-linked companies account for nearly 43% of the Jakarta Composite Index’s total weighting. This concentration was not accidental — it was the architecture of post-Suharto capitalism, where business licences and political proximity created dynasties that listed subsidiaries on the exchange without meaningfully surrendering control.
The concept of Indonesia’s so-called “deep-fried stocks” — a term that gained international currency after reporting by the Financial Times — captures the essential problem. These are tightly held shares, often with fewer than 5% of outstanding stock available for public trading, whose price can be engineered to spike dramatically in the hands of a controlling shareholder, lifting their owners into the upper echelons of Asia’s richest overnight. The very illiquidity that enables such manoeuvres is what makes these stocks structurally unfit for inclusion in a globally benchmarked index that passive fund managers must faithfully replicate.
MSCI’s own consultation paper on Indonesian free-float methodology — released in September 2025 and seeking responses by January 2026 — proposed using the Monthly Holding Composition Report from KSEI (PT Kustodian Sentral Efek Indonesia) as an additional data source to estimate true free float. The findings were damning. Many Indonesian companies disclose only shareholders owning 5% or more of total shares, leaving a vast opacity below that threshold. The KSEI report, while providing some additional granularity by investor category, could not identify individual shareholders — meaning the true beneficial ownership remained obscured behind opaque corporate and nominee structures.
“Opacity in shareholding structure and concerns about possible co-ordinated trading behaviour that undermines proper price formation.”
— MSCI Official Statement, January 2026
The Decision and the Immediate Market Rout
By early April 2026, the Indonesia Stock Exchange (IDX) published a public list of nine companies where more than 95% of shares are held by a concentrated group of investors. Two names dominated the conversation: PT Barito Renewables Energy Tbk (BREN), controlled by Prajogo Pangestu — Indonesia’s richest man with an estimated net worth of $35.2 billion — and PT Dian Swastatika Sentosa Tbk (DSSA), affiliated with the Widjaja family’s Sinar Mas Group. Both are constituents of the MSCI Global Standard Index since 2025. Both fell more than 7% on the day of the IDX announcement.
Affected Tycoon-Linked Indonesian Stocks — MSCI Exclusion Risk Tracker (April 2026)
| Ticker | Company | Conglomerate / Tycoon | Est. Free Float | Price Move (Apr) | Est. Passive Outflow | MSCI Risk |
|---|---|---|---|---|---|---|
| BREN.JK | PT Barito Renewables Energy | Prajogo Pangestu / Barito Group | <5% | −9.17% | ~IDR 6T | 🔴 Removal Likely |
| DSSA.JK | PT Dian Swastatika Sentosa | Widjaja Family / Sinar Mas | <5% | −9.34% | ~IDR 9T | 🔴 Removal Likely |
| ABLI.JK | PT Abadi Lestari Indonesia | Undisclosed consortium | <5% | −3.20% | ~IDR 1.2T | 🟡 Under Review |
| AGII.JK | PT Samator Indo Gas | Rachmat Handoyo family | ~7% | −2.80% | ~IDR 0.9T | 🟡 Under Review |
Sources: Bloomberg; IDNFinancials / Maybank Sekuritas; IDX filings April 2026. Passive outflow estimates are indicative.
The anticipated passive fund outflows from BREN and DSSA combined are estimated at approximately IDR 15 trillion if both are removed at the May 2026 rebalancing, according to analysts at Maybank Sekuritas Indonesia. That figure represents forced selling by index-tracking funds that have no discretion over whether to hold or sell once a stock is excised from a benchmark. In a market already suffering from 13.96 trillion rupiah ($834 million) in foreign outflows across all of 2025 — the worst annual figure since 2020 — mechanical passive selling on top of discretionary exits could prove destabilising.
“Stocks included in the high-concentration category are highly likely to be removed from MSCI. That is almost certain, and they will not be eligible for re-entry within the next 12 months.”
— Fath Aliansyah Budiman, Head of Investment Specialist, Maybank Sekuritas Indonesia
Governance and Ownership: A Forensic View
The Structural Problem No Regulator Would Solve
For years, institutional investors pressed Indonesian regulators to address the market’s chronic free-float problem. The minimum public shareholding requirement stood at just 7.5% — a threshold so low it was effectively an invitation for controlling shareholders to list subsidiaries as stock market proxies without surrendering meaningful economic or voting control. International fund managers operating under fiduciary mandates found it increasingly difficult to enter and exit positions at scale without moving the market, inflating trading costs and compressing risk-adjusted returns.
Governance Scorecard — Key Tycoon-Linked MSCI Constituents
| Company / Ticker | Free Float | Disclosure Transparency | MSCI Governance Risk |
|---|---|---|---|
| BREN.JK — Barito Renewables | 🔴 Critical (<5%) | 🔴 Low | Exclusion Imminent |
| DSSA.JK — Dian Swastatika | 🔴 Critical (<5%) | 🔴 Low | Exclusion Imminent |
| BBCA.JK — Bank Central Asia | 🟡 Moderate (~15%) | 🟡 Partial | Watch — 15% Transition |
| BYAN.JK — Bayan Resources | 🟡 ~12% | 🟢 Improving | Monitoring Period |
Assessments based on IDX filings, MSCI consultation findings, and Maybank/BCA Sekuritas research. Not investment advice.
What makes the BREN and DSSA cases particularly instructive is that their problems were visible well in advance. Analysts at Maybank Sekuritas noted that MSCI had been monitoring high ownership concentration in both stocks since August 2025 — months before the January 2026 public warning. The regulator’s failure to act pre-emptively, and the tycoons’ unwillingness to dilute their stakes voluntarily, transformed what should have been a managed governance upgrade into a systemic market crisis.
The resignations of Mahendra Siregar, chair of Indonesia’s Financial Services Authority (OJK), and Iman Rachman, president-director of the IDX — along with three other senior OJK officials — were extraordinary acknowledgments that the regulatory apparatus had failed. Siregar’s statement described his departure as a “form of moral responsibility.” In practice, it was a recognition that years of regulatory capture by conglomerate interests had made Indonesia’s capital markets structurally unfit for the global index ecosystem they claimed membership of.
“The swift reaction to MSCI’s downgrade threat underscores the influence of index providers.”
— Alex Matturri, Former Head of S&P Global’s Indexing Business
Macro and Policy Implications: Reforms Under Fire
The Indonesian government’s policy response has been swift — but its adequacy remains in serious question. The OJK and IDX have committed to raising the minimum free-float requirement from 7.5% to 15%, with a phase-in period of up to three years for non-compliant companies. Future IPOs will be required to offer between 15% and 25% of shares, up from the previous 10%–20% range. These are meaningful structural reforms — but the transition timelines may be too generous to satisfy an MSCI deadline measured in weeks, not years.
As of April 20, 2026, MSCI announced it would delay its high-stakes review pending further assessment of the scope, consistency and effectiveness of the new transparency measures — effectively keeping Indonesia in what one analyst described as “a holding pattern.” The delay provides temporary relief but sends a chilling signal: MSCI is unconvinced that the reforms go far enough. The index compiler has now pushed its formal verdict to June 2026, extending market uncertainty and suppressing any incremental passive inflows in the interim.
Indonesia’s macro backdrop amplifies the stakes. The rupiah has weakened materially against the dollar, the fiscal deficit has widened, and concerns about central bank autonomy have added to sovereign risk perceptions. Overseas investors sold a net $834 million worth of Indonesian equities in 2025, the worst outflow year since the pandemic. A formal downgrade to frontier-market status — still a non-trivial tail risk — would force systematic selling by funds benchmarked to the MSCI Emerging Markets Index, potentially triggering a capital account shock that the rupiah would struggle to absorb.
Investor Takeaways
Tactical Guidance for Institutional & Retail Investors
- Reduce or hedge BREN and DSSA exposure immediately. Exclusion from the MSCI Global Standard Index at the May or June review appears highly probable. Stocks removed from the index are ineligible for re-entry for at least 12 months, creating a sustained valuation discount.
- Watch the free-float transition list closely. The nine companies named by IDX for concentrated ownership are on a de facto probation list. Any that fail to dilute stakes within the phase-in period face further exclusion risk at subsequent reviews.
- Underweight Indonesia relative to MSCI EM peers while the June review outcome remains uncertain. The holding pattern means no incremental passive inflows — a structural negative for momentum.
- Monitor the rupiah and sovereign spreads as leading indicators of capital account pressure. A sustained breach of 16,500 IDR/USD would signal heightened systemic risk.
- Selective re-entry opportunities may emerge in quality Indonesian names — particularly those with genuine free floats above 15% and transparent ownership structures — once the MSCI review resolves. Bank Central Asia (BBCA) and Telkom Indonesia (TLKM) are among the names analysts flag as structurally better-positioned.
- Track Prajogo Pangestu’s stake-dilution timeline in Barito and Petrindo. The South China Morning Post has reported he is already moving to loosen his grip — if sufficient dilution occurs before the June review, BREN’s exclusion is not fully certain.
Conclusion and Outlook: The Long Road from “Deep-Fried” to Investable
The MSCI intervention in Indonesia is best understood not as a punishment but as a market-design correction that was overdue by at least a decade. Indonesia’s capital markets developed in the shadow of oligarchic conglomerates whose power was political as much as economic. The index provider’s leverage — derived from the trillions of dollars benchmarked to its emerging markets classifications — has done in weeks what years of investor pressure failed to achieve: it forced the Indonesian state to confront the incompatibility of its ownership culture with the standards of global investability.
The reforms now underway — doubling the free-float minimum, publishing transparency disclosures modelled on Hong Kong’s 2016 precedent, and reforming IPO requirements — represent genuine structural progress. But reforms on paper are not reforms in practice. The three-year phase-in period for existing companies means that the underlying concentration problem will persist well into 2029, even in a best-case scenario. And persuading Indonesia’s most powerful tycoons to genuinely relinquish controlling stakes — as opposed to engineering cosmetic compliance — remains the critical unresolved political economy challenge.
Three scenarios define the near-term outlook:
| Scenario | Conditions | Market Outcome |
|---|---|---|
| 🟢 Bull Case | Tycoons dilute stakes before June; MSCI confirms EM status | Reduced weighting; foreign confidence stabilises |
| 🟡 Base Case | BREN/DSSA excluded at May–June rebalancing; EM status retained | Lower EM weighting; subdued inflows through 2027 |
| 🔴 Bear Case | Reform stalls; MSCI downgrades Indonesia to Frontier by year-end | Sustained capital outflow cycle; rupiah/fiscal stress |
Monitor these three signal variables: MSCI’s June statement; IDX free-float compliance filings; rupiah volatility vs. 16,500 IDR/USD.
Citations & Sources
- MSCI Indonesia Index — MSCI Official
- MSCI Free Float Consultation Paper (Sept 2025)
- Bloomberg — Indonesia Flags Tightly Held Companies (Apr 3, 2026)
- Bloomberg — Indonesia Stocks Plunge 7% After MSCI Warning (Jan 28, 2026)
- Bloomberg — MSCI Delays High-Stakes Indonesia Review (Apr 20, 2026)
- Jakarta Globe — Indonesia to Raise Minimum Free Float to 15%
- Bangkok Post — Indonesian Stocks Plunge on Downgrade Warning (Jan 28, 2026)
- IDNFinancials — BREN, DSSA Face MSCI Exit Risk
- South China Morning Post — Indonesia’s Richest Man Loosens Grip on Barito
- ETF Stream — MSCI Action in Indonesia Proves Growing Power of Index Providers
Discover more from The Economy
Subscribe to get the latest posts sent to your email.
-

 Markets & Finance3 months ago
Top 15 Stocks for Investment in 2026 in PSX: Your Complete Guide to Pakistan’s Best Investment Opportunities
-

 Analysis2 months ago
Brazil’s Rare Earth Race: US, EU, and China Compete for Critical Minerals as Tensions Rise
-

 Analysis2 months ago
Top 10 Stocks for Investment in PSX for Quick Returns in 2026
-

 Banks3 months ago
Best Investments in Pakistan 2026: Top 10 Low-Price Shares and Long-Term Picks for the PSX
-

 Investment3 months ago
Top 10 Mutual Fund Managers in Pakistan for Investment in 2026: A Comprehensive Guide for Optimal Returns
-

 Global Economy4 months ago
Pakistan’s Export Goldmine: 10 Game-Changing Markets Where Pakistani Businesses Are Winning Big in 2025
-

 Global Economy4 months ago
15 Most Lucrative Sectors for Investment in Pakistan: A 2025 Data-Driven Analysis
-

 Asia4 months ago
China’s 50% Domestic Equipment Rule: The Semiconductor Mandate Reshaping Global Tech