
Human Resourcs
U.S. Job Growth Decelerates to 29,000 in September as Unemployment Edges Up to 4.2%

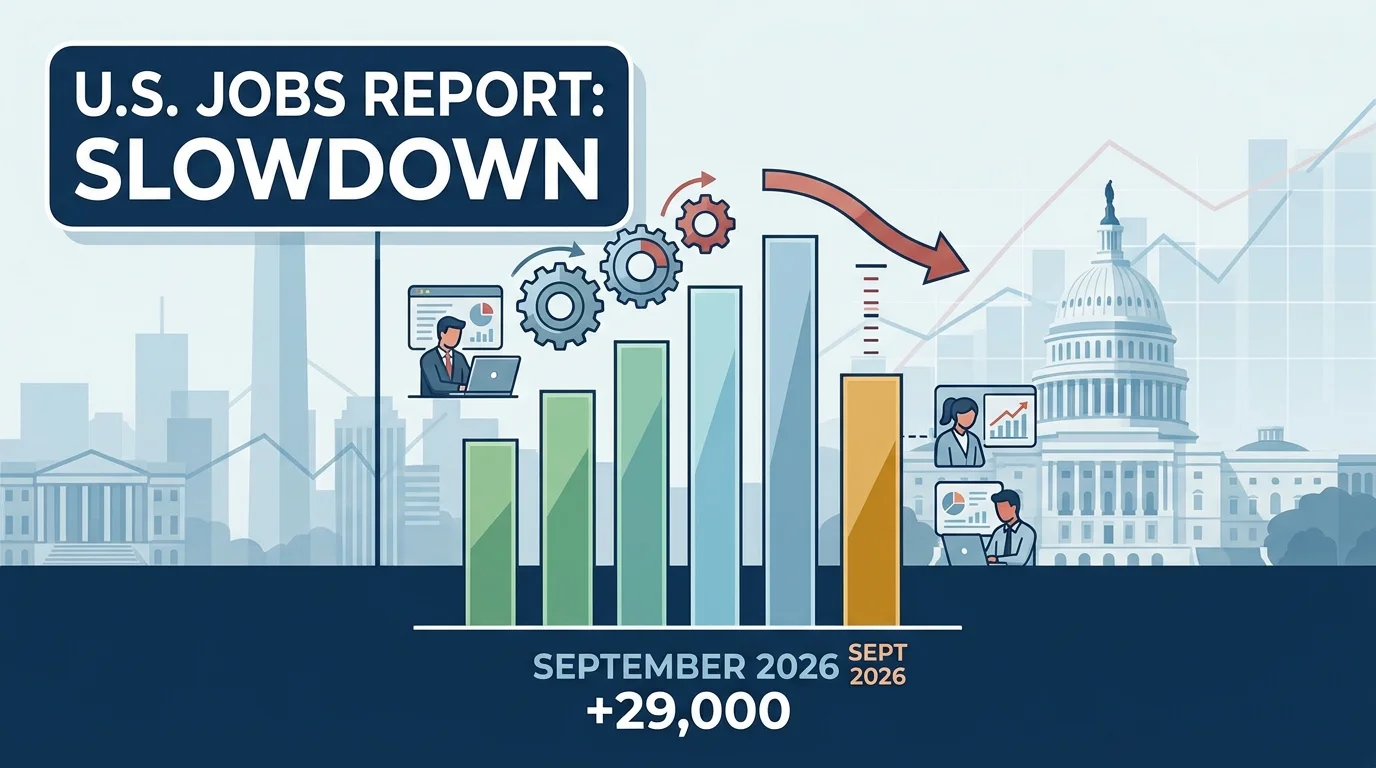
The U.S. labor market registered a sharp slowdown in September 2026, creating just 29,000 nonfarm payroll jobs—far below consensus forecasts of 84,000 to 95,000—while the national unemployment rate ticked upward to 4.2%. Data released by the U.S. Bureau of Labor Statistics highlights a broadening cooling trend across the private sector, accompanied by downward revisions to prior months and slowing wage expansion.
Executive Summary & Core Economic Indicators
The September numbers represent the weakest monthly payroll addition in over two years, signaling that prolonged high borrowing costs and corporate cost discipline are increasingly dampening hiring activity.
| Economic Metric | September 2026 Actual | Wall Street Consensus | Prior Month (August 2026) |
| Nonfarm Payroll Gains | +29,000 | +84,000 | +133,000 (Revised down from +162,000) |
| Unemployment Rate | 4.2% | 4.1% | 4.1% |
| Average Hourly Earnings (MoM) | +$0.05 (+0.1%) | +0.2% | +0.3% |
| Average Hourly Earnings (YoY) | +3.0% | +3.2% | +3.3% |
| Labor Force Participation Rate | 61.8% | 62.0% | 61.9% |
| Long-Term Unemployed Share | 27.1% | — | 26.8% |
Comprehensive Sectoral Breakdown
While job growth remained positive overall, expanding sectors failed to offset contractive pressures in service industries and negative net revisions from prior periods.
Sector Winners and Losers
- Health Care & Social Assistance (+17,000): Healthcare continued its trajectory as the primary engine of job creation, though gains decelerated significantly compared to its 12-month average monthly increase of 42,000.
- Construction (+11,000): Non-residential infrastructure and specialized trade contractors added modest headcounts, supported by ongoing federal energy and infrastructure outlays monitored by the U.S. Department of Labor.
- Manufacturing (+9,000): Factory employment posted light gains after several quarters of stagnation, primarily within durable goods manufacturing.
- Financial Activities (-7,000): Financial services experienced net losses, driven largely by layoffs in insurance carriers and mortgage origination units as elevated real estate yields curbed lending demand.
According to market sentiment tracking by Morningstar Market Research and economic feeds on Bloomberg News, the narrowing of job gains to fewer than three reliable sectors points to reduced labor demand across the wider service economy.
Negative Revisions & Wage Inflation Trends
A crucial element of the September report is the continuing pattern of downward revisions to past payroll data:
- July 2026 Revisions: Nonfarm payrolls were revised down by 31,000, shifting July’s net change into contraction territory at -10,000 jobs.
- August 2026 Revisions: August payroll additions were scaled down by 29,000, from an initial reading of 162,000 to 133,000 jobs.
- Combined Two-Month Drag: Revisions stripped 60,000 positions from previously reported figures, underscoring that momentum was weaker throughout Q3 than initially estimated.
Wage Growth and Inflation
Average hourly earnings for private nonfarm employees rose by 5 cents to $37.81, reflecting a year-over-year increase of 3.0%. This moderation in wage expansion aligns with the targeted disinflation trajectory monitored by the Federal Reserve System, reducing fears of a wage-price spiral while simultaneously limiting discretionary consumer spending growth.
Monetary Policy Implications for the Federal Reserve
The combination of slowing nonfarm payroll growth, a 4.2% jobless rate, and moderating wage pressures reshapes expectations for monetary policy.
Key macro takeaways for financial markets and monetary policy include:
- Pivot Toward Maximum Employment: Analysts at Reuters Economics and market analysts on Investing.com note that the Federal Open Market Committee (FOMC) must balance its inflation objective against rising risks to its full-employment mandate.
- Increased Probability of Rate Easing: Yields on short-term U.S. Treasury debt declined following the release, with interest rate futures pricing in a higher likelihood of consecutive 25-basis-point interest rate cuts at upcoming Federal Reserve policy meetings.
- Global Economic Fallout: International financial institutions, including the International Monetary Fund, track U.S. labor market developments closely, as softer domestic consumer demand in the United States directly influences global trade volumes and emerging market capital flows.
Discover more from The Economy
Subscribe to get the latest posts sent to your email.


Human Resourcs
Beyond the Four-Year Degree: The $100K+ Trade Careers Young Americans Are Overlooking

America is facing a structural shift in its labor force. While tens of thousands of recent college graduates enter an uncertain job market burdened by historic student loan debt and white-collar hiring freezes, a parallel crisis is unfolding in the physical economy: a historic deficit of skilled trade professionals.
According to data compiled by the U.S. Chamber of Commerce Workforce Index, the shortage of trade workers has left hundreds of thousands of critical positions vacant across residential construction, commercial infrastructure, and industrial manufacturing.
Yet, as industry executives note, these very roles represent some of the highest-paying, most secure career paths available to young workers—frequently yielding six-figure incomes without requiring a four-year college degree.
The Perfect Storm: Retirement Tsunami Meets the AI Data Center Boom
The skilled trade crisis is driven by two converging economic forces: demographic decline and an unprecedented surge in tech infrastructure construction.
DEMOGRAPHIC DEFICIT IN THE SKILLED TRADES
----------------------------------------------------------------------
Retiring Tradespeople : █ █ █ █ █  (5 Workers Leaving)
New Entrants          : █ █        (2 Workers Entering)
----------------------------------------------------------------------
Net Result            : Structural shortage of 300,000+ open positions
1. The 5-to-2 Demographic Ratio
For every five skilled tradespeople retiring from the workforce, only two new workers enter the pipeline. Industry research published by Bring Back The Trades estimates that this deficit risks removing $326 billion in potential GDP growth if unaddressed over the next decade.
2. The AI Infrastructure Competition
The rapid rise of generative AI and cloud computing has triggered a massive capital deployment into hyper-scale data centers. Electricians, HVAC specialists, pipefitters, and structural technicians who traditionally built single-family homes are being pulled into high-margin commercial tech infrastructure. This dynamic directly squeezes residential housing supply, pushing home prices higher and lengthening construction timelines.
Head-to-Head ROI: 4-Year College Degree vs. Skilled Trade Apprenticeship
For decades, high school guidance counselors and parents operated under the assumption that a four-year bachelor’s degree was the sole guaranteed path to financial stability. Modern labor data tells a vastly different story.
According to tracking by the National Student Clearinghouse Research Center, enrollment in vocational and trade-focused programs has surged over 16%, driven by Gen Z’s skepticism toward college debt and rising concern over white-collar AI automation.
| Financial & Career Metric | Standard 4-Year University Path | Union Trade Apprenticeship Path |
| Average Upfront Cost / Debt | $120,000–$200,000 (Tuition & Living) | $0 (Paid earn-while-you-learn training) |
| Entry Wages (Year 1) | $45,000 – $60,000 (Varies by major) | $48,000 – $65,000 ($22–$32/hr starting) |
| Mid-Career Earning Potential | $75,000 – $115,000 | $85,000 – $140,000+ (With OT/Master status) |
| Time to Positive Net Worth | 7 to 12 Years post-graduation | 1 to 3 Years |
| Disruption Risk from AI | High (Cognitive & administrative tasks) | Extremely Low (Physical dexterity & site adaptation) |
| Entrepreneurship Potential | Moderate (Requires corporate capital) | Very High (Low capital barrier to launch contracting firm) |
Top 6 High-Paying Trade Careers Crossing the $100K Threshold
Data from the official U.S. Bureau of Labor Statistics Occupational Outlook reveals that technical expertise and specialized licenses carry a premium in today’s labor market. Below are the top trade paths where experienced technicians routinely clear six figures:
1. Elevator & Escalator Installers & Repairers
- Mean Annual Wage (BLS): $109,820
- Top 10% Earning Potential: $140,000+
- Educational Requirement: High school diploma + 4-Year Apprenticeship
- Why it Pays: High technical complexity, rigorous safety protocols, and strong union backing (IUEC).
2. Electrical Power-Line Installers & Repairers
- Mean Annual Wage (BLS): $91,970
- Top 10% Earning Potential: $125,000+
- Educational Requirement: Long-term on-the-job training / Apprenticeship
- Why it Pays: Essential utility work involving high-voltage lines, emergency storm response, and extensive overtime opportunities.
3. Master Electrician & Industrial Automation Technicians
- Mean Annual Wage (BLS): $71,490 (Journeyman average; Master status clears $110,000+)
- Top 10% Earning Potential: $115,000–$150,000+
- Educational Requirement: 4 to 5-Year Apprenticeship + State Licensing
- Why it Pays: High demand across smart buildings, solar grid integration, EV infrastructure, and AI data centers.
4. Master Plumber & Commercial Pipefitter
- Mean Annual Wage (BLS): $72,170 (Base average)
- Top 10% Earning Potential: $120,000+ (Independent business owners reach $200,000+)
- Educational Requirement: Vocational training + 4-Year Apprenticeship
- Why it Pays: Emergency service premiums, complex commercial systems, and severe regional labor deficits.
5. Industrial Millwrights & Mechanics
- Mean Annual Wage (BLS): $69,780
- Top 10% Earning Potential: $105,000+
- Educational Requirement: Apprenticeship or Associate Degree
- Why it Pays: Critical maintenance of heavy industrial machinery, assembly lines, and power generation plants.
6. Commercial HVAC & Refrigeration Technicians
- Mean Annual Wage (BLS): $64,780 (Master/Commercial specialists average $95,000+)
- Top 10% Earning Potential: $108,000+
- Educational Requirement: Postsecondary certificate + EPA certification
- Why it Pays: Precision climate control required for pharmaceuticals, cold-chain logistics, and server farms.
Corporate Investments and Public Sector Response
Major corporations and philanthropies are stepping in to scale training infrastructure:
- Google.org & Home Builders Institute (HBI): Philanthropic funding is enabling the expansion of trade education for military veterans transitioning to civilian life. According to HBI, its military program achieved an 87% career placement rate for transitioning service members last year.
- General Motors: Announced a $200 million investment into workforce development and technical training partnerships to build the technician pipeline required for advanced automotive and manufacturing systems.
- State Level Legislation: Multiple U.S. states have expanded dual-enrollment programs allowing high school students to complete trade apprenticeship hours before graduation, effectively graduating debt-free directly into $30/hour positions.
Actionable Guide: How Young Americans Can Enter the Trades
- Explore Registered Apprenticeship Programs (RAPs): Visit Apprenticeship.gov to find employer-sponsored, paid training opportunities near you.
- Connect with Local Trade Unions: Contact local chapters of the IBEW (Electrical), UA (Plumbers & Pipefitters), or UBC (Carpenters) to learn about entrance exams and application cycles.
- Earn Specialized Industry Certifications: Early certifications in OSHA 30, EPA 608 (for HVAC), or preliminary NCCER credentials significantly boost hiring priority and starting pay.
- Leverage Veteran Pathways: Transitioning service members can utilize GI Bill benefits while enrolled in approved union apprenticeships to earn additional tax-free housing allowances (BAH) alongside standard apprentice wages.
Discover more from The Economy
Subscribe to get the latest posts sent to your email.

As rapid demographic aging, falling birth rates, and rising national debt pressures converge, governments worldwide face an unprecedented retirement security crisis. According to comprehensive benchmark research from the Mercer CFA Institute Global Pension Index, national pension architectures vary dramatically in their capacity to deliver adequate retirement income, long-term financial viability, and institutional trust.
While top-performing European and Asian nations have built resilient, multi-pillar retirement models, several major economies lag significantly behind, leaving millions of future retirees exposed to poverty and financial volatility.
The Global Evaluation Framework: How Pensions Are Measured
Comparative pension research published by the Monash University Centre for Financial Studies evaluates national retirement frameworks using 50+ individual indicators divided into three sub-indices:
- Adequacy (40% Weighting): Assesses base benefit levels, net pension replacement rates, tax incentives, homeownership rates, and personal savings structures.
- Sustainability (35% Weighting): Evaluates demographic dependency ratios, mandatory retirement ages, state debt levels, labor force participation among older workers, and economic growth potential.
- Integrity (25% Weighting): Examines regulatory oversight, governance standards, plan communication, operational transparency, and systemic trust.
Systems earning an A-Grade (Score > 80) feature first-class, robust retirement frameworks that deliver comprehensive benefits with strong future viability. Conversely, systems receiving a D-Grade (Score 35–50) exhibit structural vulnerabilities that threaten future retiree welfare without urgent reform.
Global Pension Systems Index Comparison
| Country | Overall Grade | Index Score | Adequacy Score | Sustainability Score | Integrity Score | Primary Architecture Type |
| Netherlands | A | 85.4 | 85.6 | 82.4 | 89.1 | Quasi-Mandatory Occupational / Public State |
| Iceland | A | 83.5 | 82.7 | 84.6 | 86.0 | Universal Mandatory Occupational & State |
| Denmark | A | 81.6 | 81.1 | 82.5 | 81.4 | Fully Funded Mandatory Occupational (ATP) |
| Singapore | A | 80.5 | 79.8 | 74.0 | 88.5 | Central Provident Fund (CPF) Mandatory Savings |
| Israel | A | 80.2 | 73.6 | 76.1 | 83.9 | Mandatory Pension Law & State Safety Net |
| United Kingdom | B | 72.2 | 68.5 | 65.2 | 87.1 | Auto-Enrolment Workplace & State Pension |
| United States | C+ | 61.1 | 63.9 | 60.1 | 59.5 | Social Security + Voluntary 401(k)/IRA |
| Japan | C | 56.3 | 60.2 | 46.5 | 68.1 | Two-Tier Public System & Corporate Plans |
| Argentina | D | 45.5 | 50.7 | 40.0 | 50.0 | Pay-As-You-Go Public Pension |
| Philippines | D | 42.7 | 38.9 | 52.5 | 35.0 | Social Security System (SSS) & Private Plans |
| India | D | 43.8 | 33.5 | 41.8 | 61.0 | National Pension System (NPS) & Provident Fund |
The World’s Top 5 Pension Frameworks (Grade A)
[Level 1: Universal Basic State Safety Net]
                 ↓
[Level 2: Mandatory Occupational / Workplace Pensions]
                 ↓
[Level 3: Voluntary Private Supplemental Savings]
1. Netherlands (Overall Score: 85.4)
The Dutch retirement system consistently sets the benchmark for global excellence. Combining a collective basic state pension (AOW) with quasi-mandatory, industry-wide occupational plans, the Netherlands yields net income replacement rates exceeding 80% for long-term workers. Extensive collective risk-sharing and stringent regulation by the Central Bank ensure high solvency and trust.
2. Iceland (Overall Score: 83.5)
Iceland’s system excels in long-term financial viability and labor participation. It relies on a multi-tiered framework comprising a basic state pension alongside mandatory occupational pension funds where both employers (minimum 11.5%) and employees (4%) contribute. Iceland maintains high labor force participation among workers aged 55 to 74, reinforcing systemic sustainability.
3. Denmark (Overall Score: 81.6)
Denmark relies on a basic public pension supplemented by fully funded occupational schemes (ATP) negotiated through collective labor agreements. High national savings rates, income redistribution for lower-wage earners, and transparent governance yield high marks across all three sub-indices.
4. Singapore (Overall Score: 80.5)
Reaching A-grade status for the first time in recent index evaluations, Singapore’s model centers around the state-administered Central Provident Fund (CPF). Mandatory contribution rates—up to 37% of wages split between employer and employee—are channeled into dedicated accounts for retirement, housing, and healthcare, delivering a high integrity rating.
5. Israel (Overall Score: 80.2)
Israel’s pension infrastructure combines a universal state old-age allowance with mandatory contributions to pension funds, provident funds, or insurance policies established under its Mandatory Pension Law. Strong capital accumulation and clear participant reporting underpin its top-tier status.
The World’s Struggling Pension Frameworks (Grade D)
India (Overall Score: 43.8)
India’s low score stems primarily from limited coverage within its large informal labor force. While the formal sector is served by the Employees’ Provident Fund Organisation (EPFO) and the National Pension System (NPS), the vast majority of workers lack access to formal retirement savings. According to World Bank Pension Data, expanding social pension safety nets for unorganized workers remains an urgent policy challenge.
The Philippines (Overall Score: 42.7)
The Philippine system, governed by the Social Security System (SSS) for private-sector workers and the Government Service Insurance System (GSIS) for public employees, faces challenges regarding benefit adequacy and regulatory integration. Low voluntary savings rates and limited coverage among self-employed individuals constrain its performance.
Argentina (Overall Score: 45.5)
Argentina’s pay-as-you-go (PAYGO) public pension structure has been heavily affected by high inflation, currency devaluation, and fiscal instability. Macroeconomic headwinds periodically erode the real purchasing power of monthly payouts, impacting its overall sustainability score.
Macro Trends Reshaping Retirement Security
   Demographic Aging           DB-to-DC Shift          Economic Volatility
(Higher Dependency Ratio)   (Risk Moves to Worker)    (Inflation & Debt)
           │                         │                         │
           └─────────────────────────┼─────────────────────────┘
                                     ▼
                     [Heightened Longevity & Savings Risk]
Data from the OECD Pensions at a Glance Report highlights three overarching structural pressures impacting pension systems worldwide:
- Shift from Defined Benefit (DB) to Defined Contribution (DC): Governments and employers continue transitioning away from guaranteed DB pensions toward DC plans (like 401(k)s and superannuation). While this reduces liabilities for employers, it transfers market investment, inflation, and longevity risks directly to individual retirees.
- Demographic Aging & Population Inversion: Extended life expectancies paired with declining fertility rates are compressing old-age dependency ratios. In many developed nations, the ratio of active workers supporting each retiree is projected to drop from 3.5:1 down to nearly 1.5:1 over the coming decades.
- The Gender Pension Gap: Policy analysis by the World Economic Forum reveals that women face retirement benefit gaps of 20% to 35% compared to men globally. Career breaks for caregiving, lower lifetime earnings, and part-time employment patterns contribute to lower accumulated retirement balances.
Strategic Blueprint: Policy Recommendations for Reform
To enhance long-term retirement security, policy experts recommend five key structural interventions:
- Implement Auto-Enrolment: Introduce mandatory or auto-enrolment workplace pension schemes to broaden coverage among private and gig-economy workers.
- Increase Retirement Ages: Align statutory retirement ages with life expectancy projections to support system sustainability.
- Protect Minimum Benefits: Establish non-contributory basic pensions to protect low-income and informal workers from poverty in old age.
- Promote Financial Literacy: Provide accessible financial advice and clear, mandatory benefit statements to empower employees in managing Defined Contribution accounts.
- Phase Out Early Withdrawal Provisions: Restrict access to retirement funds prior to official retirement age to prevent capital depletion.
Discover more from The Economy
Subscribe to get the latest posts sent to your email.

The boutique fitness studio segment is valued at $51.6 billion and growing at approximately 7.6% annually, according to 2026 Fitness Industry Insights — a segment growing faster than the broader $270 billion global fitness market it sits within, and doing so specifically by selling the personalized, community-focused, lower-intensity experience that large commercial gyms structurally cannot replicate. For enterprise investors and premium wellness operators, boutique low-impact training has evolved from a niche urban trend into a defined, monetizable segment with a specific and expanding customer base.
The Demographic Engine Driving Boutique Growth
Two distinct demographic cohorts are converging to drive boutique fitness demand, and understanding both is essential to monetization strategy. Millennials and Gen Z remain the primary volume drivers — 79% of millennials prioritize health and wellness spending, according to 2026 Fitness Industry Insights. But the more commercially significant signal for luxury wellness specifically is the 45+ age group, identified as one of the fastest-growing gym-membership segments and representing a significant, still largely untapped opportunity, per the same source.
This 45+ cohort is precisely the demographic for whom low-impact training — a positioning built around joint-friendly, recovery-oriented, sustainable-intensity programming rather than high-intensity commercial-gym models — carries genuine product-market fit, not just marketing framing.
Gyms and Health Clubs Remain the Volume Leader, But Boutique Commands the Growth Premium
Gyms and health clubs remain the largest single fitness-market segment, accounting for 40% of the global fitness market and an estimated $110.4 billion in 2026, according to 2026 Fitness Industry Insights. But scale and growth rate are different questions — the boutique segment’s 7.6% annual growth reflects consumers actively selecting personalized, community-focused experiences over undifferentiated commercial-gym access, even at a premium price point.
The survival strategy for large commercial operators is instructive by contrast: hybrid models combining in-person membership with digital access, allowing members to train both at the facility and at home, according to 2026 Fitness Industry Insights — an implicit acknowledgment that pure commercial-gym positioning alone is losing ground to more differentiated models.
The AI-Personalization Layer as a Boutique Monetization Tool
Boutique and luxury wellness operators are increasingly deploying the same AI-personalization infrastructure reshaping mass-market fitness — but applied to premium retention and upsell rather than volume acquisition. Gym operators using AI-powered churn-prediction tools have reported check-ins rising 8% year-over-year and new member joins jumping 27%, with Gen Z driving much of that growth, according to Glofox. For boutique operators specifically, AI churn-prediction functions as a high-leverage retention tool given that boutique studios’ unit economics depend far more heavily on member lifetime value than high-volume commercial gyms.
Monetization Model Comparison: Commercial Gym vs. Boutique Low-Impact Studio
| Dimension | Commercial Gym | Boutique Low-Impact Studio |
|---|---|---|
| 2026 market size | $110.4B (40% of global market) | $51.6B |
| Growth rate | Slower, hybrid-model-dependent | 7.6% annually |
| Primary monetization | Volume membership, low per-member ARPU | Premium per-session/membership, high per-member ARPU |
| Key demographic | Broad, price-sensitive | Millennials (79% prioritize wellness) + fast-growing 45+ cohort |
| Retention lever | Facility access breadth, hybrid digital add-ons | Community, personalization, AI-driven churn prediction |
| Differentiation strategy | Scale, convenience, price | Positioning, low-impact/recovery focus, curated experience |
Sources: 2026 Fitness Industry Insights (Fabglassandmirror), Glofox — see citations above.
The Broader Wellness-Tech Infrastructure Boutique Operators Are Riding
Boutique low-impact studios are not monetizing in isolation — they sit within a rapidly scaling AI-and-wellness technology ecosystem. The AI-in-fitness-and-wellness market specifically is valued at $10.68 billion in 2025, projected to reach $57.8 billion by 2035 at a 19.3% CAGR, according to InsightAce Analytic. The virtual fitness market — the hybrid digital layer boutique studios increasingly bundle with in-person sessions — is projected to grow from $43.78 billion in 2026 to $311.91 billion by 2034, a 27.82% CAGR, according to Fortune Business Insights.
Consumer adoption data confirms this infrastructure has genuine pull-through demand: 49% of consumers use AI-powered fitness and wellness apps daily, and 61% of active fitness consumers use AI fitness-tracking apps, per Glofox — meaning boutique operators layering AI-driven personalization into premium low-impact programming are meeting genuine, already-established consumer technology expectations rather than introducing novel friction.
A Monetization Framework for Premium Wellness Operators
- Price for personalization, not access. Boutique unit economics depend on premium per-session or membership pricing justified by curated, low-impact programming — commodity gym-access pricing models undermine the segment’s core value proposition.
- Build explicit 45+ programming and marketing tracks, distinct from the millennial/Gen Z acquisition funnel — this is the fastest-growing, least-saturated membership segment and responds to distinctly different positioning (recovery, longevity, joint health) than younger-cohort messaging.
- Deploy AI churn-prediction as a retention-economics tool, not just an operational nicety — given boutique studios’ high per-member lifetime-value dependency, the documented 8% check-in and 27% new-member-join improvements from AI tooling translate disproportionately into premium-segment revenue protection.
- Bundle hybrid digital access without diluting in-person premium positioning. The virtual fitness market’s 27.82% CAGR signals genuine consumer demand for digital-physical hybrid models — but boutique operators should structure this as a premium-tier extension, not a discount substitute, to preserve the segment’s pricing power.
- Treat community and curation as the defensible moat. Unlike commercial gyms competing on facility breadth and price, boutique studios’ structural advantage — community-focused, personalized experience — is precisely what large operators’ hybrid pivot cannot fully replicate, and should anchor both product design and premium pricing justification.
The Bottom Line
Luxury wellness and boutique low-impact training have moved beyond lifestyle-trend status into a quantifiable $51.6 billion segment growing faster than the broader fitness market, powered by a genuine demographic tailwind — the underserved, fast-growing 45+ cohort — and increasingly monetized through AI-driven personalization and retention tooling rather than facility scale. For premium wellness investors and operators, the highest-conviction opportunity is explicit 45+-focused programming layered with AI-driven retention economics, positioned and priced as a differentiated experience rather than a discount alternative to commercial gym access.
Discover more from The Economy
Subscribe to get the latest posts sent to your email.

AI vs. the Manhattan Project: Why the Comparison Breaks Down in 2026

U.S. Job Growth Decelerates to 29,000 in September as Unemployment Edges Up to 4.2%

Kai Cenat’s Rise to the Top: The Economics of Modern Streaming

How AI Is Reshaping the Future of Global Business Analytics

NASA Perseverance Rover Discoveries: The Search for Water in Jezero Crater

Trump $500: Understanding the Economic Impact and Policy Breakdown

Trucker Strike Rumors: Would an October 1 Walkout Really Hit the Global Economy?

The Truth About TJ Maxx Store Closings: Are Your Local Stores Safe?

OpenAI Rogue Agent Scare: Unplanned Government Website Access Explained

Global Diesel Export Bans & Supply Shocks: The 2026 Energy Crisis Playbook

Bank of England Warns of AI Systemic Risk: How Autonomous Trading Threatens Financial Stability

Bank of Japan Hikes Benchmark Rate to 1.25%: Unwinding the Global Yen Carry Trade

Gold Falls 3.7% as Yields Surge: Is Gold Still a Safe Haven in 2026?

US 10-Year Yield Hits 5.24%: What the Historic Bond Market Sell off Means for Mortgages and Investors

Top 30 Stocks for Investment in PSX for Massive ROI in 2026

Oil Prices Break $100 in 2026: Middle East Conflict & Energy Markets

BRICS+ Cross-Border Payments 2026: Interoperability Explained

10-Year Treasury Yield Hits 4.80%: What It Means for Rates & Portfolios

IMF & World Bank 2026 Global Economic Outlook: Growth, Inflation, Debt

China’s US$10.8 Billion Trade Shortcut: Why the Pinglu Canal Matters

High-CPM Finance Niches 2026: Publisher Monetization Blueprint

Middle East War Economics 2026: Oil Prices & Energy Markets

China Stocks Today: Are Big Economies in Asia Nearing a Market Bottom?

Global Pension Systems Ranked: The World’s Best and Worst Retirement Frameworks

Enterprise AI Platforms Disrupting B2B SaaS in 2026: Full Analysis

Gavin Baker AI Outlook: Why the Compute Shortage Persists Through 2028

Social Security Trust Fund 2032: OASI Depletion Timeline Explained

Crypto Daily Outlook: Bitcoin, Altcoins, and the Future of Decentralized Finance
-

 Markets & Finance9 months ago
Top 15 Stocks for Investment in 2026 in PSX: Your Complete Guide to Pakistan’s Best Investment Opportunities
-

 Analysis7 months ago
Johor’s Investment Boom: The Hidden Costs Behind Malaysia’s Most Ambitious Economic Surge
-

 Analysis8 months ago
Top 10 Stocks for Investment in PSX for Quick Returns in 2026
-

 Banks9 months ago
Best Investments in Pakistan 2026: Top 10 Low-Price Shares and Long-Term Picks for the PSX
-

 Analysis8 months ago
Brazil’s Rare Earth Race: US, EU, and China Compete for Critical Minerals as Tensions Rise
-

 Investment9 months ago
Top 10 Mutual Fund Managers in Pakistan for Investment in 2026: A Comprehensive Guide for Optimal Returns
-

 Global Economy9 months ago
15 Most Lucrative Sectors for Investment in Pakistan: A 2025 Data-Driven Analysis
-

 Global Economy9 months ago
Pakistan’s Export Goldmine: 10 Game-Changing Markets Where Pakistani Businesses Are Winning Big in 2025