
Analysis
The $63 Billion Question: Why the Gulf Crisis Is a Double-Edged Windfall for American Oil

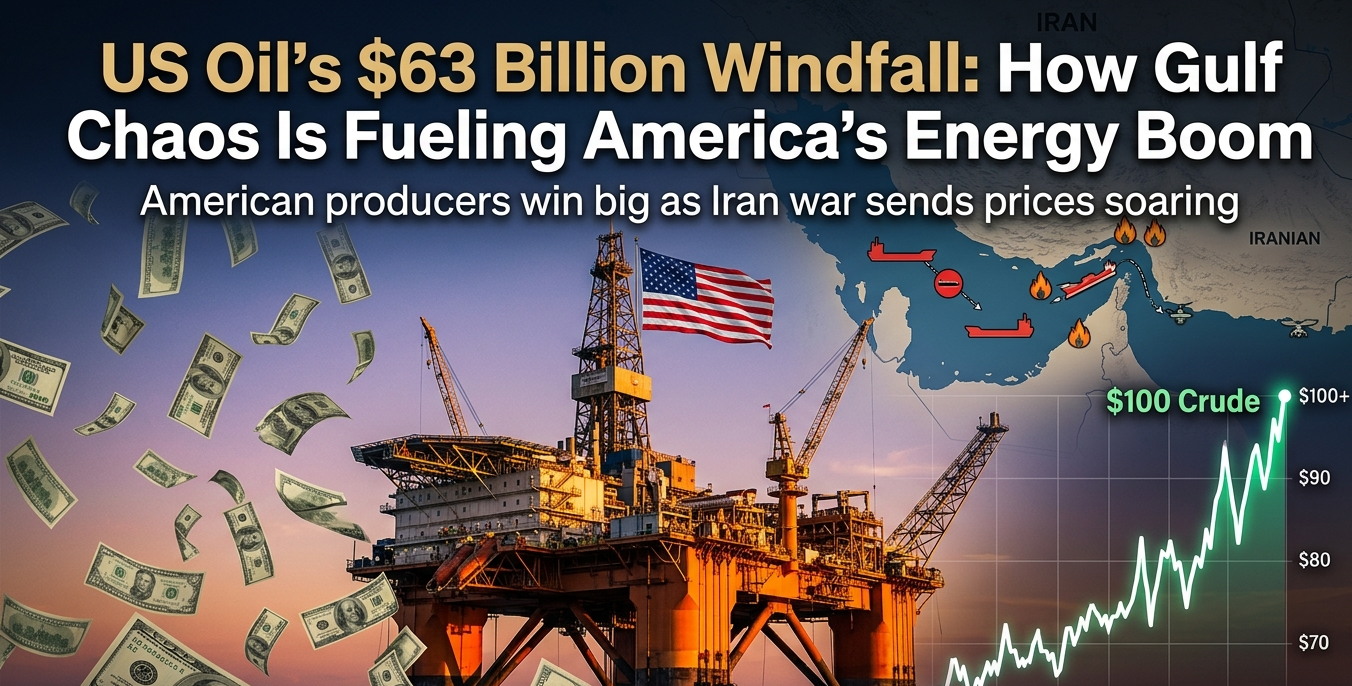
As the Strait of Hormuz closure pushes Brent past $100, US shale producers stand to gain $63bn this year. But geopolitical risk, inflationary pressure, and investor discipline complicate the narrative.
The tiny coral outcrop of Kharg Island, sitting astride Iran’s economic lifeline, was never supposed to be the epicentre of the world’s next great energy shock. Yet when US Central Command confirmed Saturday that precision strikes had taken out naval mine storage facilities on the island while carefully preserving its oil infrastructure, it encapsulated the paradoxical moment confronting global energy markets .
The war is real. The disruption is historic. And American oil producers are, by any conventional measure, about to make an extraordinary amount of money.
If crude prices average $100 per barrel this year—Brent closed Friday at $103.14, with WTI at $98.71—US oil companies will reap approximately $63.4 billion in additional revenue compared to pre-conflict expectations, according to Rystad Energy modelling cited by the Financial Times . Jefferies calculates that American producers are already generating an extra $5 billion in monthly cash flow following the 47 per cent price surge since February 28 .
But for C-suite executives and policymakers accustomed to reading this story as a straightforward tale of American energy dominance, the reality is considerably more layered. The $63 billion windfall arrives with strings attached: a schism between international majors and domestic shale players, the spectral return of 1970s-style stagflation fears, and an uncomfortable truth about who actually benefits when the world’s most critical waterway goes dark.
‘The Largest Supply Disruption in History’
To understand the magnitude of what is unfolding, one must start with the Strait of Hormuz. Before February 28, approximately 20 million barrels of crude and oil products flowed through this narrow passage daily—roughly a fifth of global consumption . Today, that figure has fallen to nearly zero.
The International Energy Agency, not given to hyperbole, described the situation in its March report as “the largest supply disruption in the history of the global oil market” . Gulf producers have been forced to cut at least 10 million barrels per day of total production—8 million barrels of crude plus 2 million barrels of condensates and natural gas liquids. Storage facilities across Iraq, Qatar, Kuwait, the UAE, and Saudi Arabia are filling rapidly, with tankers unable or unwilling to load .
What makes this crisis distinct from previous Gulf conflicts is its simultaneous impact on production, refining, and shipping. More than 3 million barrels per day of regional refining capacity have already shut down due to attacks and the absence of viable export routes . The liquefied natural gas market has been hit even harder, with approximately one-fifth of global LNG supply stalled—prompting Shell to declare force majeure on shipments from QatarEnergy’s Ras Laffan plant .
The $63 Billion Math
The windfall calculation is straightforward in theory, nuanced in practice.
Rystad’s $63.4 billion figure represents incremental revenue—the difference between what US producers would have earned at pre-conflict price levels and what they stand to capture at sustained $100 oil. But as any energy CFO will note, revenue is not profit, and profit is not free cash flow returned to shareholders.
The investment bank Jefferies offers a more granular window: US producers are generating an extra $5 billion in cash flow this month alone . If sustained across twelve months, that translates to approximately $60 billion in additional free cash flow—money that can be deployed toward dividends, share buybacks, debt reduction, or, in theory, new production.
The distinction matters because it reveals how this moment differs from previous oil shocks. During the 2011 Libyan crisis or even the immediate aftermath of Russia’s 2022 invasion of Ukraine, the US shale patch responded with alacrity, deploying rigs and completion crews to capture higher prices. This time, the response has been conspicuously muted.
The Discipline Paradox
Morgan Stanley analysts tracking the oilfield services sector note something unusual: American drilling and completion companies are “hesitant to underwrite significant gains in U.S. activity” despite the price spike . Public US exploration and production companies remain tethered to capital discipline, with private explorers considering only marginal activity increases.
This restraint reflects a fundamental shift in how US shale is governed. The era of growth-at-any-cost, which burned through billions of investor dollars during the 2010s, has given way to a return-on-capital ethos enforced by institutional shareholders who remember the previous decade’s disappointments. Patterson-UTI Energy and Helmerich and Payne are waiting for a more sustained signal before deploying additional rigs .
There is also a pragmatic calculation at work. The US Strategic Petroleum Reserve release of 172 million barrels, part of a coordinated 400-million-barrel IEA action, provides a temporary buffer but cannot substitute for resumption of Hormuz flows . Goldman Sachs projects Brent could exceed $128 per barrel within three to four weeks if the conflict persists . Yet the same bank also forecasts prices falling back to $85 by April—a volatility that makes multi-year capital commitments hazardous .
Winners and Losers in the New Calculus
The $63 billion windfall is not evenly distributed. US shale producers with minimal Middle East exposure—companies like Pioneer Natural Resources, EOG Resources, and ConocoPhillips—stand to capture the full benefit of higher prices without the offsetting operational pain afflicting their international peers .
For the global majors, the picture is more complicated.
ExxonMobil and Chevron, alongside European counterparts BP, Shell, and TotalEnergies, have spent years expanding their footprint across the Gulf region, signing agreements in Syria, Libya, and several Gulf states to increase reserves and production. That strategic bet has now become a liability. According to Rystad data, more than one-fifth of BP and ExxonMobil’s 2026 free cash flow was expected to come from their Middle East oil and LNG businesses . With those assets now shuttered or operating under force majeure, the parent companies face a direct hit to earnings even as commodity prices soar.
TotalEnergies acknowledged as much in a trading update Friday, noting that higher oil prices are “enough to offset the impact of declining Middle East output”—a formulation suggesting the calculus is close to neutral rather than unambiguously positive . ExxonMobil CEO Darren Woods offered a blunter assessment: the shutdown of the “world’s central supply source” will hit everyone in the industry, though the company’s scale provides some purchasing advantages .
The stock market has rendered its own verdict. Since the conflict began, ExxonMobil shares have risen only 2 per cent, lagging behind BP and Shell’s 11 per cent and 9 per cent gains . The divergence reflects investor expectations that European majors’ large trading operations will benefit from price volatility, while US majors’ Gulf exposure creates unwanted complexity.
Norwegian oil giant Equinor has outperformed them all—it has no Middle East business whatsoever .
The Inflation Conundrum
For the Biden (and potentially Trump) administration watching from Washington, the $63 billion windfall creates a policy dilemma of the first order.
The consumer price index showed energy prices rising 0.6 per cent month-over-month in February, pushing core PCE back to 3.0 per cent—well above the Federal Reserve’s target . Goldman Sachs has already pushed its first expected rate cut from June to September, with FedWatch data showing 99 per cent probability of a rate freeze at the March FOMC meeting .
Former President Donald Trump, never one for policy nuance, took to Truth Social to demand immediate rate cuts even as inflationary pressures mount—a contradiction not lost on markets . Columbia University’s Joseph Stiglitz warns of “stagflation,” invoking the 1974 oil crisis comparison that haunts central bankers’ nightmares .
The political economy here is brutal. American oil producers capture $63 billion. American consumers pay $4-plus gasoline. The Federal Reserve confronts a inflation shock it cannot address without potentially tipping the economy into recession. And the Strategic Petroleum Reserve, that hard-won buffer against supply disruptions, is being drawn down at the very moment when its long-term adequacy comes into question.
The Energy Transition Reckoning
There is a longer-term story buried beneath the immediate price volatility, and it concerns the fate of the energy transition.
Before February 28, the prevailing narrative in Davos and Dubai was one of managed decline for fossil fuels. The COP summits had enshrined transition language. Investment capital was flowing toward renewables. The major oil companies were repositioning themselves as “energy companies” with diversified portfolios.
That narrative has not been destroyed, but it has been complicated. RBC Capital Markets expects the conflict to last into spring, with all that implies for supply chains and investment certainty . Paul Sankey of Sankey Research notes that the crisis could drive a more active pivot toward domestic energy sources not affected by supply disruptions—but also warns that “this could turn into a demand destruction event, ultimately hurting everyone” .
The hardest-hit regions may be in Asia, where reliance on Gulf oil and LNG is highest. Sankey suggests some countries may reconsider their aversion to nuclear power—a development that would have seemed improbable before the Strait of Hormuz became a war zone .
What Comes Next
The $63 billion windfall is real, but it is not yet banked. Three variables will determine whether US producers ultimately capture these gains or watch them evaporate.
First, the duration of the Hormuz closure. Iran’s new Supreme Leader Mojtaba Khamenei has vowed to keep the waterway shut, seeking leverage over the US and Israel . But storage capacity is finite, and Gulf producers are already feeling the pain of curtailed output. Something will break—either the blockade or the region’s production infrastructure.
Second, the response of OPEC+ spare capacity. Before the conflict, OPEC held approximately 5 million barrels per day of spare capacity, predominantly in Saudi Arabia and the UAE. That capacity is now largely inaccessible due to the same shipping constraints affecting Gulf producers. The IEA’s coordinated reserve release buys time, but it does not solve the underlying supply problem .
Third, the reaction of US shale’s capital allocators. If discipline holds and producers return cash to shareholders rather than chasing growth, the $63 billion will manifest as dividends and buybacks rather than a supply response that eventually undercuts prices. If discipline fractures, the industry risks repeating the boom-bust cycle that left it vulnerable to the last decade’s price collapses.
A Double-Edged Sword
The historian Daniel Yergin has observed that oil markets are never just about oil—they are about the intersection of geology, technology, and human conflict. The current moment vindicates that observation in uncomfortable ways.
American oil companies are indeed line for a windfall that would have seemed improbable three weeks ago. The $63 billion figure will appear in earnings releases, investor presentations, and analyst notes throughout 2026. It will fuel debates about windfall profits taxes, strategic reserves, and the proper role of domestic production in national security.
But the same crisis that delivers this windfall also exposes the vulnerabilities beneath American energy dominance. The US is the world’s largest oil producer, yet it cannot insulate its economy from a supply shock originating 7,000 miles away. The shale revolution conferred resilience, but not immunity. And the energy transition, whatever its long-term merits, offers no protection against the immediate pain of $100 oil.
Martin Houston, the oil industry veteran now chairing Omega Oil & Gas, put it succinctly: “This is not a situation with any winners” . The $63 billion is real. But so is everything that comes with it.
Discover more from The Economy
Subscribe to get the latest posts sent to your email.



Key Takeaways
- Rolex’s secondary market rose approximately 7.9% year-over-year as of 2026 (per WatchCharts data) — trailing Patek Philippe (+16.2%) and Tudor (+11.4%) but still outperforming Audemars Piguet (+3.4%).
- Rolex raised U.S. retail prices 4–9% in January 2026 (steel models ~5.6%, gold models ~8.7%), narrowing the historical gap between retail and pre-owned pricing.
- Not every model appreciates: steel sports references (Submariner, GMT-Master II, Daytona) have held value far better than two-tone or widely available dress references like the standard Datejust.
- The Lady-Datejust posted the sharpest 2026 gain among tracked collections — up 22.73%, from roughly $9,269 to $11,376 — driven by demand for smaller, “everyday luxury” watches.
- Gold’s rise past $2,400/oz has directly lifted the investment case for Rolex’s precious-metal references (Day-Date, Sky-Dweller, Yacht-Master).
The Model-by-Model Picture
| Category | 2026 Trend |
|---|---|
| Lady-Datejust | +22.73% (strongest performer among tracked collections) |
| Steel sports models (Submariner, GMT-Master II) | Held value well; corrected from 2022 peak but stabilized above retail |
| Daytona | Corrected from highs above $50,000 to the mid-$30,000s; still among the most sought-after references |
| Two-tone/widely available Datejust | Flat to negative — “holds value” is an overstatement for this category |
| Gold references (Day-Date, Sky-Dweller) | Lifted by gold’s rise above $2,400/oz |
Why the “Rolex Always Appreciates” Myth Is Fading
The pandemic-era boom pushed some references — the Daytona above all — to speculative highs disconnected from historical norms. Since the March 2022 peak, steel sports models have compressed meaningfully, and dealers who bought inventory near the top have in some cases faced 20–40% markdowns on liquidation. The lesson for 2026 buyers: Rolex as a category is not a monolith. Value retention depends heavily on specific reference, condition, and whether the piece comes with box and papers (“full set”).
What’s Actually Driving 2026 Strength
- Retail price increases raise the floor. When a new Submariner retails at $10,050 (up from $9,500), a pre-owned example at $11,000–$12,000 suddenly represents a smaller premium — narrowing the gap without secondary prices actually moving.
- Supply discipline remains Rolex’s core lever. The brand has never confirmed production numbers, and secondary-market premiums remain entirely a function of Rolex’s own manufacturing decisions — a risk factor as much as a support.
- Certified Pre-Owned rollout. Rolex’s now fully rolled-out CPO program has changed how buyers transact in the used market, adding a layer of brand-verified legitimacy that supports pricing.
The Case for Rolex as a Portfolio Diversifier
Financial advisors increasingly frame luxury watches not as a replacement for equities or bonds, but as a tangible, historically low-correlation diversifier — one that carries its own risks (illiquidity, condition-dependent pricing, no yield) but has demonstrated multi-decade resilience for specific references.
Is Rolex a good investment in 2026?
It depends heavily on the specific reference. Steel sports models like the Submariner and Daytona have held or grown in value; two-tone and widely available dress models generally have not. Overall, Rolex’s secondary market rose about 7.9% year-over-year in 2026, trailing Patek Philippe but ahead of Audemars Piguet.
Discover more from The Economy
Subscribe to get the latest posts sent to your email.

Navigating Mortgage and Loan Refinancing in a High-Yield Environment
Global public debt crossing critical thresholds has kept central bank policies volatile, resulting in fluctuating US Treasury yields throughout 2026. For homeowners and commercial property holders burdened by previous high-interest borrowing cycles, finding optimal refinance windows has become a high-stakes financial puzzle. Stalled disinflation and stubborn employment numbers mean rate cuts are incremental, requiring borrowers to act with precision.
Timing your mortgage or commercial loan refinance in this environment requires a deep understanding of yield curve movements and lender risk appetites.
Decoding 2026 Refinance Dynamics
The 10-Year Treasury Yield Benchmark
Mortgage rates continue to track closely with the 10-year US Treasury yield. When macroeconomic anxiety spikes debt issuance, yields rise, tightening consumer borrowing capacity. Savvy borrowers monitor weekly Treasury auctions to lock in rates during brief dip windows.
Hybrid ARMs and Alternative Structures
With fixed rates remaining elevated, 7/1 and 10/1 adjustable-rate mortgages (ARMs) have surged in popularity. These products offer lower initial monthly payments, giving borrowers breathing room until central bank easing cycles fully materialize.
| Loan Product | Current Rate Range | Best For | Key Risk Factor |
| 30-Year Fixed Mortgage | 6.2% – 6.8% | Long-term predictability | Higher initial monthly outlay |
| 7/1 Hybrid ARM | 5.5% – 5.9% | Short-term ownership / flipping | Rate reset risk after year 7 |
| Commercial Refinance | 7.0% – 8.2% | Corporate asset restructuring | Strict DSCR lender covenants |
Actionable Steps for Successful Refinancing
To maximize your chances of securing favorable refinance terms in a volatile market, follow a disciplined preparation strategy.
Boost Your Credit Score Immediately: Lenders in 2026 are applying stringent credit tiering; a 20-point increase can drop your APR by a crucial quarter-point.
Shop Regional Credit Unions: Smaller financial institutions often offer portfolio loans with more flexible underwriting than major national banks.
Calculate the Break-Even Point: Ensure your total closing costs are recouped through monthly savings within 24 months of closing.
“Market Strategist View: Refinancing in 2026 is an exercise in opportunistic timing. Borrowers must maintain immaculate financial profiles ready to strike the moment Treasury yields dip.”
Mastering the complexities of today’s debt environment ensures you can successfully lower your debt service costs and protect your long-term financial stability.
Discover more from The Economy
Subscribe to get the latest posts sent to your email.

The days of pulling generic auto insurance quotes based purely on your zip code and age are officially over. In 2026, insurance comparison engines are powered entirely by generative AI and real-time telematics. These platforms digest thousands of live data points—ranging from your driving smoothness via connected vehicle sensors to real-time traffic congestion patterns—to generate hyper-personalized premiums instantly.
For consumers, this evolution represents both a massive opportunity for savings and a hidden trap for penalty pricing. Understanding how AI algorithms evaluate risk is essential for anyone looking to lower their monthly auto insurance premiums.
How AI Comparison Engines Evaluate Your Risk Profile
Behavioral Telematics and Connected Cars
Modern cars stream performance data directly to insurance aggregators. Generative AI models analyze braking sharpness, acceleration curves, cornering G-forces, and phone distraction metrics. Drivers who maintain smooth, defensive habits are rewarded with dynamic rate cuts of up to 40% compared to traditional rating tiers.
Predictive Traffic and Weather Modeling
AI tools now cross-reference your daily commute route with predictive weather and accident probability models. If your standard parking location or driving corridor has a statistically higher incidence of uninsured motorist claims, your quotes will reflect that hyper-local risk assessment.
| Comparison Factor | Traditional Rating Model | 2026 Generative AI Model | Impact on Premium |
| Mileage & Usage | Annual estimated odometer reading | GPS tracking & live trip duration | High (up to 35% savings) |
| Driving Behavior | MVR driving record & accidents | Real-time braking, speed, & G-force | Critical (determines tier) |
| Vehicle Tech | Make, model, and safety rating | ADAS calibration & repair cost data | Moderate |
Strategies to Lower Your AI-Driven Insurance Quote
To outsmart the algorithm and secure the lowest possible premium in 2026, drivers must proactively manage their digital footprint on insurance platforms.
Opt-In for Telematics Trial Periods: Many insurers offer immediate 15% discounts just for installing their driving app; let it track safe habits for 30 days to lock in permanent savings.
Scrub Unverified Public Records: Ensure your motor vehicle report is free of clerical errors that AI risk models misinterpret as reckless behavior.
Compare AI Aggregators: Use platforms that integrate multi-carrier API feeds rather than single-brand comparison sites to find the best risk-adjusted rate.
“Industry Note: AI-driven pricing rewards transparency and precision. Drivers who actively manage their telematics data consistently out-save those relying on legacy quote calculators.”
Embracing AI comparison tools allows savvy policyholders to customize coverage limits precisely to their driving habits, eliminating wasted premium spend while ensuring robust protection.
Discover more from The Economy
Subscribe to get the latest posts sent to your email.

Fidelity Investments Review: Maximizing Returns in a Volatile Stock Market

How Crypto Transformed the Trump Fortune: A $1.4 Billion Financial Breakdown

Global Pension Systems Ranked: The World’s Best and Worst Retirement Frameworks

Global Supply Chain Vulnerabilities: From Eurasian Trade Corridors to Food Consumer Recalls

Why 5% U.S. Treasury Yields Signal a Global Market Regime Shift.

Federal Reserve Defies White House Pressure: Inside Trump’s Demand for Sub-1% Interest Rates After Historic 2026 Rate Hike

How Rising Interest Rates Impact Gig Economy Apps: DoorDash, Uber, and Urban Services

GasBuddy Market Insights: How Crude Price Shifts Impact Local Fuel Cost Averages

DoorDash Driver Payouts, Fee Structures, and Market Competition Analysis

OPINION:Breaking the 3.5% Growth Trap: How Pakistan Can Build a High-Productivity Export Economy

Global Equity Market Divergence: US Tech vs. European Dividend Stocks vs. Asian Growth

Asian Markets Analysis: Navigating Volatility in China, Japan, and Singapore Stocks

Stagflation vs. Soft Landing: How Central Bank Rates Are Reshaping European and Asian Economies

IMF & World Bank Global Economic Outlook: Growth Forecasts Across Europe and Asia

State Farm’s $5B Dividend 2026: Who Qualifies & Payout Dates

US-China Relations in Q3 2026: Trade Tariffs and Supply Chain Risks

SpaceX Starship Flight 14: First Orbital Attempt & Starlink V3 Launch Explained

Top 30 Stocks for Investment in PSX for Massive ROI in 2026

The 2026 Crypto Regulatory Shift: What It Means for Institutional Investors

AI Chip Stocks 2026: The Best Semiconductor Investments Beyond Marvell

AI-Powered Training: The Next Multi-Billion Dollar Ecosystem in Fitness

Tween Back-to-School Trends 2026: What’s Driving the $85B Season

Oil Prices Break $100 in 2026: Middle East Conflict & Energy Markets

10-Year Treasury Yield Hits 4.80%: What It Means for Rates & Portfolios

Shein Clothes Quality & Safety in 2026: What Lab Tests Show

Fidelity Investments Review 2026: SPAXX Yields & Zero-Fee Funds

MRVL Earnings 2026: Why Marvell Sank Despite Beating Estimates

China’s US$10.8 Billion Trade Shortcut: Why the Pinglu Canal Matters
-

 Markets & Finance9 months ago
Top 15 Stocks for Investment in 2026 in PSX: Your Complete Guide to Pakistan’s Best Investment Opportunities
-

 Analysis7 months ago
Johor’s Investment Boom: The Hidden Costs Behind Malaysia’s Most Ambitious Economic Surge
-

 Analysis7 months ago
Top 10 Stocks for Investment in PSX for Quick Returns in 2026
-

 Analysis7 months ago
Brazil’s Rare Earth Race: US, EU, and China Compete for Critical Minerals as Tensions Rise
-

 Banks8 months ago
Best Investments in Pakistan 2026: Top 10 Low-Price Shares and Long-Term Picks for the PSX
-

 Investment8 months ago
Top 10 Mutual Fund Managers in Pakistan for Investment in 2026: A Comprehensive Guide for Optimal Returns
-

 Global Economy9 months ago
15 Most Lucrative Sectors for Investment in Pakistan: A 2025 Data-Driven Analysis
-

 Global Economy9 months ago
Pakistan’s Export Goldmine: 10 Game-Changing Markets Where Pakistani Businesses Are Winning Big in 2025