
Rea Estate
Real Estate 2026: What Jackson Hole Means for Mortgage Rates & Home Buyers


30-year mortgage rates are stuck near 6.5%-6.7% as Fed Chair Warsh’s Jackson Hole speech looms. Here’s what it means for home buyers, sellers, and real estate investors this fall.
Key Takeaways
- The 30-year fixed mortgage rate sits around 6.54%–6.65% as of late August 2026, with Freddie Mac’s weekly average at 6.65% — down from over 7% just weeks earlier but still elevated by historical standards.
- Long-term Treasury yields, not the Fed’s overnight rate, are the real driver of mortgage pricing — the 30-year Treasury yield hit 5.31% on August 17, its highest level since 2007.
- New-home sales fell 10.5% in July, according to HUD data, while inflation (PCE) held at 3.7% annually, nearly double the Fed’s 2% target.
- Builders are responding with incentives: nearly two-thirds are offering some form of sales incentive, and roughly 30% are cutting prices outright to move inventory.
- Even a rate cut may not translate into cheaper mortgages if long-term bond markets remain unconvinced the Fed has inflation under control.
Why Mortgage Rates Aren’t Just About the Fed
A common misconception among home buyers is that Fed rate cuts automatically translate into lower mortgage rates. In reality, mortgage rates track the 30-year Treasury yield far more closely than the Fed’s short-term overnight rate — and that yield is set by whoever is willing to buy long-dated government debt, not by the Federal Reserve directly.
This distinction matters enormously right now. The 30-year Treasury yield closed at 5.31% on August 17, 2026, its highest level since 2007, reflecting persistent concerns about federal deficits and sticky inflation rather than the Fed’s policy stance alone. As one macro analysis put it: the Fed can influence the overnight rate and the expected path of short-term rates, but it cannot manufacture an unlimited supply of global savings to buy up long-term debt at lower yields.
The practical implication for buyers: even a dovish surprise from Fed Chair Kevin Warsh’s Jackson Hole keynote may not meaningfully lower 30-year mortgage rates if bond investors remain unconvinced that inflation is truly under control.
Current State of the Housing Market
Mortgage Rate Snapshot (Late August 2026)
- 30-year fixed: ~6.54%–6.65% (Zillow/Freddie Mac)
- 15-year fixed: ~5.86%
- 5/1 ARM: ~6.31%
- 10-year Treasury yield: ~4.66%, having peaked near 4.74% in late August
Demand and Supply Signals
- New-home sales fell 10.5% in July, according to the Department of Housing and Urban Development — a sharp signal that elevated rates and prices are sidelining would-be buyers.
- Existing-home sales have run modestly above year-ago levels, but the flow of new resale listings has slowed sharply, tightening available inventory even as overall demand softens.
- Inflation remains the binding constraint: July’s Personal Consumption Expenditures (PCE) report — the Fed’s preferred inflation gauge — came in at 3.7% annually, above the 3.6% economists had forecast and nearly double the Fed’s 2% target.
How Builders Are Adapting
Facing a large existing stock of resale homes and buyer hesitancy at current rates, homebuilders are increasingly using pricing tools that individual sellers can’t easily replicate:
- Nearly two-thirds of builders are offering some form of sales incentive.
- Roughly 30% are cutting list prices outright.
- Mortgage rate buydowns are a common builder tactic, allowing them to lower a buyer’s effective financing cost even while the underlying market rate stays elevated — an advantage most individual home sellers cannot offer.
What Jackson Hole Means for the Housing Market
Fed Chair Kevin Warsh’s first Jackson Hole keynote as chair carries specific stakes for real estate:
- A hawkish tone (emphasizing sticky inflation, “restrictive” policy) would likely keep long-term yields — and mortgage rates — elevated or push them higher.
- A dovish tone (emphasizing labor-market cooling, a “patient approach”) could ease rate pressure somewhat, though the disconnect between Fed policy and long-term Treasury yields means the effect on actual mortgage pricing may be smaller than headlines suggest.
- Silence or vague language — Warsh’s likely base case given his track record of withholding forward guidance — would probably leave mortgage rates trading in their current mid-6% range, as they have for much of the past several weeks.
Mortgage industry analysts have noted that if Warsh’s comments “lack substance” on inflation, in the market’s assessment, that could actually push mortgage rates higher, not lower — underscoring that ambiguity itself carries downside risk for borrowers waiting on the sidelines.
Actionable Takeaways for Buyers, Sellers, and Investors
For Home Buyers
- Don’t wait for a dramatic rate drop. Given the disconnect between Fed policy and long-term Treasury yields, rates may stay in the mid-6% range for an extended period even if the Fed eventually cuts.
- Negotiate builder incentives aggressively if considering new construction — rate buydowns and price cuts are currently widespread and represent real, actionable savings.
- Get pre-approved and lock rates when comfortable, rather than trying to perfectly time a Fed announcement; historical data shows most single-speech reactions are modest.
For Home Sellers
- Expect a more balanced market. More inventory and slower price growth in many regions are giving buyers additional negotiating leverage compared to the ultra-tight markets of recent years.
- Consider offering rate buydown concessions to compete more directly with builder incentives in your local market.
For Real Estate Investors
- Cap rate compression may be limited as long as financing costs remain elevated — factor a “higher for longer” base case into underwriting models rather than assuming near-term rate relief.
- Watch regional divergence: markets with rising new listings and cooling price growth may offer better entry points for value-oriented investors than tighter coastal markets.
- Diversify across property types and geographies to manage exposure to a housing market that remains highly sensitive to Fed communication and Treasury market sentiment.
Frequently Asked Questions
Will mortgage rates go down after the Fed’s Jackson Hole speech?
Not necessarily — mortgage rates track long-term Treasury yields more closely than the Fed’s short-term overnight rate, so even a dovish signal from the Fed Chair may not meaningfully lower 30-year mortgage rates if bond investors remain concerned about inflation and federal deficits.
Is now a good time to buy a house given current mortgage rates?
That depends on individual financial circumstances and local market conditions; with rates in the mid-6% range and builders widely offering incentives and price cuts, buyers may find more negotiating leverage than in recent years, but a licensed real estate or mortgage professional can help evaluate your specific situation.
Why are mortgage rates still high even though inflation has cooled from its peak? Inflation remains elevated relative to the Fed’s 2% target (around 3.7% as of the latest PCE reading), and long-term Treasury yields — which drive mortgage pricing — reflect ongoing investor concerns about federal deficits and sustained inflation risk, not just the Fed’s current policy rate.
Discover more from The Economy
Subscribe to get the latest posts sent to your email.



The word “correction” is doing a lot of work in housing coverage this year, and most of it is wrong.
A correction implies falling prices. What the data actually shows is something stranger: prices barely moving, transactions barely happening, and a market frozen in place by a mortgage rate that will not fall.
The 30-year fixed rate sits at 6.76%, with the median home price at $410,700 — just 0.5% above one year ago. That is not a crash. It is stasis.
But beneath the national average, something more interesting is happening.
Key Takeaways
- Rates rose, not fell. The 30-year fixed fell to 5.98% in February before climbing to 6.65% by August.
- Price weakness is spreading. 46 metros posted monthly price declines in July, up from 28 the prior month.
- Coastal markets are cracking first. San Francisco fell 2.6% over three months despite being up 7.0% year-on-year.
- A national correction remains unlikely. Delinquencies are near historic lows and homeowner equity is at record levels.
- First-time buyers are locked out. The NAR first-time buyer affordability index stands at just 70 against an overall index of 105.
What the Numbers Actually Say
| Indicator | Level | Direction |
|---|---|---|
| 30-year fixed mortgage | 6.76% (mid-Sept) | Up from 5.98% February low |
| Median home price | $410,700 | +0.5% year-on-year |
| Annual price appreciation | 1.4% (July) | Essentially flat monthly |
| Existing home sales | 4.06 million SAAR (July) | –1.7% month, +0.7% year |
| Inventory | 1.54 million homes / 4.6 months | –1.9% from June |
| Affordability index (overall) | 105 (Q2) | Barely above the 100 threshold |
| Affordability index (first-time) | 70 | Severe gap |
| Mortgage delinquency | ~1.86% | Near historic lows |
The mortgage rate story is the whole story. The 30-year fixed fell to 5.98% on 26 February then rose to 6.65% by 20 August, while the 10-year Treasury yield climbed from 3.94% to 4.70% over the same period.
Housing does not respond to the Fed. It responds to the long end of the curve — and the long end went the wrong way.
The Cooling Is Real, and It Is Spreading
The rise in mortgage rates from about 6% in spring to more than 6.6% since June cooled home prices in July. Annual appreciation edged up to 1.4% from 1.3%, but prices were essentially flat for the month — against a typical pre-pandemic June-to-July gain of 0.4%.
Two data points matter more than the headline:
Negative momentum is broadening. Among the 100 largest markets, 19 posted negative three-month price momentum in July, up from 10 in June. Monthly declines hit 46 metros versus 28 the month before.
High-cost markets are leading down. San Francisco was up 7.0% year-on-year but fell 2.6% over three months and 1.4% month-on-month — the steepest declines among the top 100 metros. Philadelphia posted the sharpest drop in annual momentum, falling 2.3 percentage points from June. Boise followed with a 1.8-point slowdown.
Cotality’s analysis attributes the coastal weakness to elevated prices, buyer fatigue and uncertainty around AI-fuelled wealth gains weighing on higher-priced markets.
That last phrase deserves attention. Bay Area housing has been underwritten by technology equity compensation. When the AI trade wobbles, San Francisco real estate is a leveraged derivative of it.
Why a National Crash Is Still Unlikely
Three structural factors separate 2026 from 2008.
1. Nobody Is Forced to Sell
Mortgage delinquencies sit near historic lows and foreclosures are relatively rare. Most homeowners are sitting on record equity — $17.8 trillion as of Q2 2025.
Distressed supply is what turns a slowdown into a crash. It does not exist in this cycle.
2. The Lock-In Effect Works Both Ways
For every percentage point between current market rates and a homeowner’s existing fixed rate, the probability of choosing to sell declines by 18.1%.
That suppresses demand — but it suppresses supply harder. Redfin’s framing is precise: slow demand has historically caused prices to fall, but that is unlikely here because sellers will pull back too.
3. Forecasts Cluster Around Flat
| Forecaster | 2026 Price Growth |
|---|---|
| Zillow | 1.2% |
| Redfin | 1% |
| Fannie Mae | 3.6% |
| Compass (Simonson) | 0.5%, ±4% variation |
The spread between the most and least bullish is under four percentage points. That is unusual consensus — and it says “flat,” not “falling.”
The Correction That Is Actually Happening
Something is correcting: affordability, and it is correcting through time rather than price.
With home prices growing more slowly than wages for a sustained period for the first time since the financial crisis, real affordability improves even while nominal prices hold. Inflation-adjusted buying costs could decline for a second consecutive year.
There is also a negotiation-based correction. A slower market often adjusts through negotiation before prices fall sharply — longer days on market, seller-paid repairs, closing cost concessions. Buyers gain leverage even when headline values hold.
That leverage does not show up in the Case-Shiller index. It shows up in your closing statement.
What Buyers and Sellers Should Actually Do
If you are buying:
- Negotiate concessions before negotiating price. Sellers defend the headline number and surrender on everything else.
- Compare three-month momentum, not year-on-year appreciation. The former tells you where your market is going.
- Price in taxes and insurance. Higher property taxes and rising insurance premiums are compounding mortgage-driven affordability pressures.
- Consider seasonality. Autumn and winter historically deliver more negotiating power.
If you are selling:
- Accept that your pricing anchor is 2022, and the market’s is not.
- In markets with negative three-month momentum, the first offer is often the best offer.
- Expect longer marketing periods — inventory is flat, but so is urgency.
What This Means for the Global Market in 2027
The 10-year Treasury is the only variable that matters. Mortgage rates track it, not the policy rate. Any 2027 recovery in transaction volume requires the long end to fall — which requires inflation to fall.
Regional divergence will widen, not narrow. High-cost coastal markets tied to technology compensation face a different cycle from Sun Belt and Midwest markets tied to wage growth and migration. National averages will become progressively less useful.
Volume recovery precedes price recovery. Zillow projects 4.26 million existing home sales in 2026, a 4.3% increase. Watch transaction counts as the leading indicator.
The lock-in effect erodes slowly. Every year, life events force some locked-in owners to move. Supply returns gradually rather than in a wave — which is why this market grinds rather than breaks.
Sub-6% is the psychological unlock. LendingTree’s experts do not predict rates dropping below 6% any time soon. Until they do, the freeze holds.
Frequently Asked Questions
Is the housing market going to crash in 2026?
A national crash is unlikely. Mortgage delinquencies are near historic lows at around 1.86%, homeowner equity is at record levels, and forecasters project roughly flat to 1–2% price growth rather than declines.
What are mortgage rates right now?
The 30-year fixed rate is around 6.76% as of mid-September 2026, up from a February low of 5.98%. Most forecasts see rates holding between 6% and 7%.
Which housing markets are falling?
46 metros posted monthly price declines in July. San Francisco recorded the steepest, down 2.6% over three months, followed by weakness in Philadelphia and Boise.
Is 2026 a good year to buy a house?
Buyers have more negotiating power than at any point since 2021, with prices growing slower than wages. Affordability remains difficult for first-time buyers, whose affordability index sits at just 70.
Discover more from The Economy
Subscribe to get the latest posts sent to your email.

Dubai real estate hit AED286bn in H1 2026 sales, its second-best half ever, even as hotel occupancy collapsed on war-related tourism disruption. Here’s the divergence explained.
Dubai’s economy is telling two very different stories at once, and both are true. Per Khaleej Times, the emirate recorded AED286.43 billion in property sales across 79,229-plus transactions between January and June 2026, reinforcing its position as one of the world’s most active real estate markets. Separately, per Skift’s reporting on a CBRE study, UAE-wide hotel occupancy fell nearly 28 percentage points year-on-year through June, with Dubai recording the sharpest declines of any emirate.
Key Takeaways
- Dubai property sales reached AED286.43 billion ($78 billion) across more than 86,000 transactions in H1 2026 — the second-highest first-half total on record.
- Commercial property sales hit an all-time high of AED19.5 billion, a 183% year-on-year jump, already exceeding all of 2025.
- UAE-wide hotel occupancy fell nearly 28 percentage points year-on-year through June, with Dubai’s decline nearly double Abu Dhabi’s.
- Dubai’s citywide hotel occupancy averaged 56% in H1 2026, down from roughly 80% the prior year, with luxury and upper-upscale hotels hit hardest.
- Full-year hotel occupancy is forecast to recover to 60.4-66.2%, still below 2025’s record levels.
The property numbers, on closer inspection, represent genuine strength rather than a headline exaggeration. A detailed breakdown from Arabian Business shows Dubai real estate generated more than $78 billion in H1 2026, the second-highest first-half performance in the emirate’s history — trailing only H1 2025’s record AED326.6 billion — with total real estate transactions including mortgages reaching AED419.9 billion, per Emirates 24|7. Commercial real estate posted an outright record: per Economy Middle East, commercial transactions hit AED19.5 billion, a 183% year-on-year jump that already exceeded the entirety of 2025’s commercial sales, with W Capital’s chairman describing it as reflecting “real business activity, increasing corporate presence” rather than speculation.
The hospitality picture is the mirror opposite. Per ZAWYA’s coverage of the same CBRE report, Dubai’s occupancy fell to 56.4% in H1 2026 from 81% in H1 2025, while RevPAR across the UAE tumbled 31.8%. A CBRE Mena research head attributed the shift directly to “regional geopolitical developments” weighing on business activity and tourism flows since the conflict escalated in late February. Segment-level data from Breaking Travel News shows luxury and upper-upscale hotels were hit hardest, averaging just 51-52% occupancy, while budget-friendly upper-midscale properties held up best at nearly 66% — a sign that whatever travel demand remained skewed toward value-conscious, likely regional and domestic travelers rather than the high-spending international visitors Dubai’s luxury sector depends on.
The scale of the initial shock is worth putting in context. Earlier in the year, per Skift’s May reporting citing Moody’s Analytics, Dubai hotel occupancy was projected to fall as low as 10% in Q2, down from around 80% in February — described by Moody’s as “an effective shutdown of large parts of the hospitality sector.” That represented a sector contributing about $72 billion, or nearly 13% of UAE GDP, and supporting roughly 925,000 jobs in 2025, per AGBI’s reporting.
Recovery is underway but incomplete. Khaleej Times reports Dubai’s hospitality market is expected to gradually recover in H2 2026, with full-year occupancy forecast at 60.4-66.2%, average daily rates around Dh600-675, and annual passenger traffic of 67.6-79.3 million — still below 2025’s record levels, with Cavendish Maxwell noting momentum should pick up from Q4 as air connectivity improves and winter tourism arrives.
Why It Matters
The divergence is a genuine case study in how a diversified Gulf economy absorbs a regional shock unevenly: capital-intensive, longer-horizon investment (real estate, corporate relocation) has proven far more resilient than short-cycle, confidence-sensitive activity (tourism, hospitality) — a distinction with implications for how other Gulf economies might structure their own diversification bets.
Data and Evidence
- Dubai H1 2026 property sales: AED286.43bn ($78bn), second-highest H1 ever
- Commercial property sales: AED19.5bn, +183% YoY, an all-time high
- UAE-wide hotel occupancy: -27.7 to -28 percentage points YoY through June
- Dubai hotel occupancy: 56.4% (H1 2026) vs. 81% (H1 2025)
- Hospitality sector’s 2025 UAE GDP contribution: ~$72bn (~13%), ~925,000 jobs
Global Impact
Dubai’s resilience in capital markets even amid a regional war offers a data point for global investors assessing Gulf political-risk premiums broadly, while the tourism collapse is a live case study for other regional destinations (including parts of the Levant and broader GCC) on how quickly conflict-adjacent geography can dent visitor confidence independent of a country’s own security situation.
What Happens Next
Watch Q4 2026 occupancy data against the 60.4-66.2% full-year forecast, and whether Strait of Hormuz de-escalation (Article 5) translates into faster airline capacity restoration into Dubai International.
Frequently Asked Questions
Is Dubai’s property market in trouble?
No — H1 2026 was its second-best first half on record, with commercial real estate hitting an all-time high.
Why did Dubai hotel occupancy collapse?
Regional war-related travel disruption and reduced international airline capacity beginning in late February 2026.
Which hotel segment was hit hardest?
Luxury and upper-upscale properties, while budget-friendly upper-midscale hotels held up comparatively well.
When will Dubai tourism fully recover?
Full-year 2026 occupancy is forecast at 60.4-66.2%, still below 2025’s record, with recovery accelerating in Q4.
Why are real estate and tourism diverging so sharply?
Real estate reflects longer-horizon capital and corporate investment decisions; tourism is highly sensitive to short-term traveler confidence and airline capacity.
Discover more from The Economy
Subscribe to get the latest posts sent to your email.
Analysis
Dubai Real Estate 2026: Inside the $5.1 Billion Ultra-Prime Boom and the Cooling Mid-Market
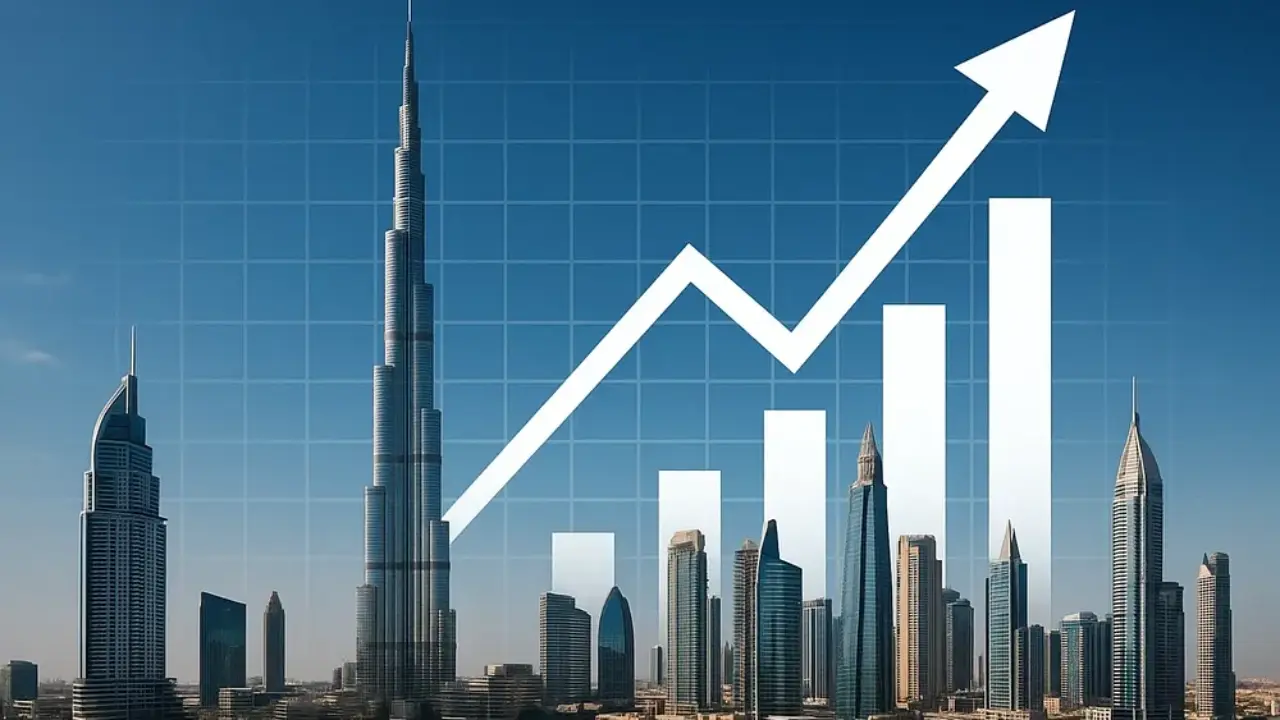
Dubai recorded 296 home sales above $10 million in the first half of 2026 — a record $5.1 billion in ultra-prime transactions, according to Knight Frank data — even as the broader rental and mid-market segment continued to soften, with Abu Dhabi’s rent freeze still in place and over 18,000 units handed over in Dubai in the first five months of the year alone (Mitchell’s Commercial Realty).
The Headline Number vs. the Structural Story
Dubai’s GDP expanded 2.4% year-on-year in Q1 2026 to AED 232 billion, led by non-oil sectors including wholesale, retail, and financial and insurance services — growth that held up through the regional conflict period even as some external commentary predicted it would stall (Edwards & Towers). Total H1 property sales reached $78 billion across more than 86,000 transactions, the second-highest first-half performance on record, though still below 2025’s exceptional run (Arabian Business).
The Angle Most Property Coverage Misses: This Isn’t the 2008 Cycle
A single data point captures why this cycle behaves differently from Dubai’s prior boom-bust pattern: only 4% of homes sold in Dubai last year were resold within 12 months of purchase, compared with 25% during the 2008 cycle, according to market data reported by Edwards & Towers (Edwards & Towers). That shift from short-term flipping toward end-user and long-term investor ownership is the single most important structural difference between today’s market and the speculative excess that preceded the global financial crisis.
Foreign Capital Is Flowing In, Not Out
Foreign investment in Dubai real estate rose 26% to $40.4 billion in the first half of 2026, while luxury real estate investment specifically increased 26% to $23.9 billion (Arabian Business). The UAE’s 2025 foreign direct investment reached a record AED 177.3 billion ($48.3 billion), placing the country among the world’s top ten FDI destinations — a base that is cushioning the property sector’s adjustment even as Q2 saw three consecutive months of price declines in the broader residential segment (Mitchell’s Commercial Realty).
Oil Output Hit a Record, and Technology Access Just Expanded
UAE crude output reached an all-time high of 4.1 million barrels per day in June, even as Dubai’s own growth is now overwhelmingly non-oil in composition. Separately, a US technology access upgrade now places the UAE alongside the UK, India and South Korea in terms of advanced technology availability — a shift with multi-year implications for data-centre, power infrastructure and high-income technical talent demand, rather than an immediate market catalyst (Mitchell’s Commercial Realty).
The Population Story Underpinning Demand
Dubai’s population surpassed 4 million in 2025, with a further 175,000–225,000 residents projected for 2026, driven increasingly by long-term residents and skilled migrants rather than short-term speculative buyers, according to Engel & Völkers’ market review — a demand base the IMF expects to be supported by roughly 5% UAE economic growth in 2026 (Engel & Völkers).
What to Watch for the Rest of 2026
The UAE Central Bank has forecast 9.8% economic growth for 2027, a figure that, if realised, would mark a sharp acceleration from the current cycle’s more moderate pace — and would test whether Dubai’s pipeline of over 100,000 additional announced units can be absorbed without reproducing the oversupply dynamics of prior cycles.
Discover more from The Economy
Subscribe to get the latest posts sent to your email.

KOSPI Crash October 2026: What Korea’s Chip Selloff Reveals

CoreWeave Stock 2026: CRWV, AI Infrastructure Debt and the Selloff Explained

OP-ED:The AI Race Has No Single Winner — And Pakistan Must Choose Its Own Future

VA Disability Rates Increase 2027: The Confirmed 3.6% COLA Explained

US–China AI Export Controls in 2026: Chips, Testing Rules and Corporate Risk

World Trade in 2026: Tariffs, Supply Chains and the Cost of Fragmentation

Global Economy Outlook 2026–27: What to Watch Ahead of the IMF October Report

Strait of Hormuz in 2026: Why Shipping Risks Matter for Oil, Insurance and Food Prices

US–China Critical Minerals Competition in 2026: Who Controls the Supply Chain?

Oil and Diesel Prices in October 2026: How Supply Shocks Can Reach Inflation

AI Chip Demand in 2026: What TSMC, Nvidia and Data-Center Spending Reveal

Q3 2026 Earnings Season: The Bank, AI and Consumer Signals That Really Matter

Treasury Yields in 2026: Why Higher Bond Rates Matter for Stocks, Mortgages and Savings

KOSPI 2026: Why South Korean Stocks Turned Volatile and What AI Investors Should Watch

World’s Largest Economies: Ranking the Top Global Powers

Global Pension Systems Ranked: The World’s Best and Worst Retirement Frameworks

Elon Musk’s Next Moves: Disrupting the 2026 Global Economy

Crude Oil & Petroleum Market Analysis: OPEC+ Decisions and Price Forecasts

Pakistan Economy 2026: Inside the SBP’s Balancing Act

GasBuddy Market Insights: How Crude Price Shifts Impact Local Fuel Cost Averages

Global Equity Market Divergence: US Tech vs. European Dividend Stocks vs. Asian Growth

IMF & World Bank Global Economic Outlook: Growth Forecasts Across Europe and Asia

Bitcoin Price Forecast 2026–2027: Will the 4-Year Cycle Hold?

Silver Price Today: Why the Xi-Trump AI Standoff Is Fueling a Safe-Haven Rally

The Future of Silicon: Supply Chain Vulnerabilities in the 2026 Tech Sector

Asian Stock Markets 2026: Japan, China, Pakistan & More

Stagflation vs. Soft Landing: How Central Bank Rates Are Reshaping European and Asian Economies

SpaceX IPO: How Aerospace Is Reshaping Tech Startup News
-

 Markets & Finance9 months ago
Top 15 Stocks for Investment in 2026 in PSX: Your Complete Guide to Pakistan’s Best Investment Opportunities
-

 Analysis8 months ago
Johor’s Investment Boom: The Hidden Costs Behind Malaysia’s Most Ambitious Economic Surge
-

 Analysis8 months ago
Top 10 Stocks for Investment in PSX for Quick Returns in 2026
-

 Banks9 months ago
Best Investments in Pakistan 2026: Top 10 Low-Price Shares and Long-Term Picks for the PSX
-

 Analysis8 months ago
Brazil’s Rare Earth Race: US, EU, and China Compete for Critical Minerals as Tensions Rise
-

 Investment9 months ago
Top 10 Mutual Fund Managers in Pakistan for Investment in 2026: A Comprehensive Guide for Optimal Returns
-

 Global Economy10 months ago
15 Most Lucrative Sectors for Investment in Pakistan: A 2025 Data-Driven Analysis
-

 Global Economy10 months ago
Pakistan’s Export Goldmine: 10 Game-Changing Markets Where Pakistani Businesses Are Winning Big in 2025