
Markets & Finance
Motley Fool Stock Advisor Review 2026: Worth $99/Year?

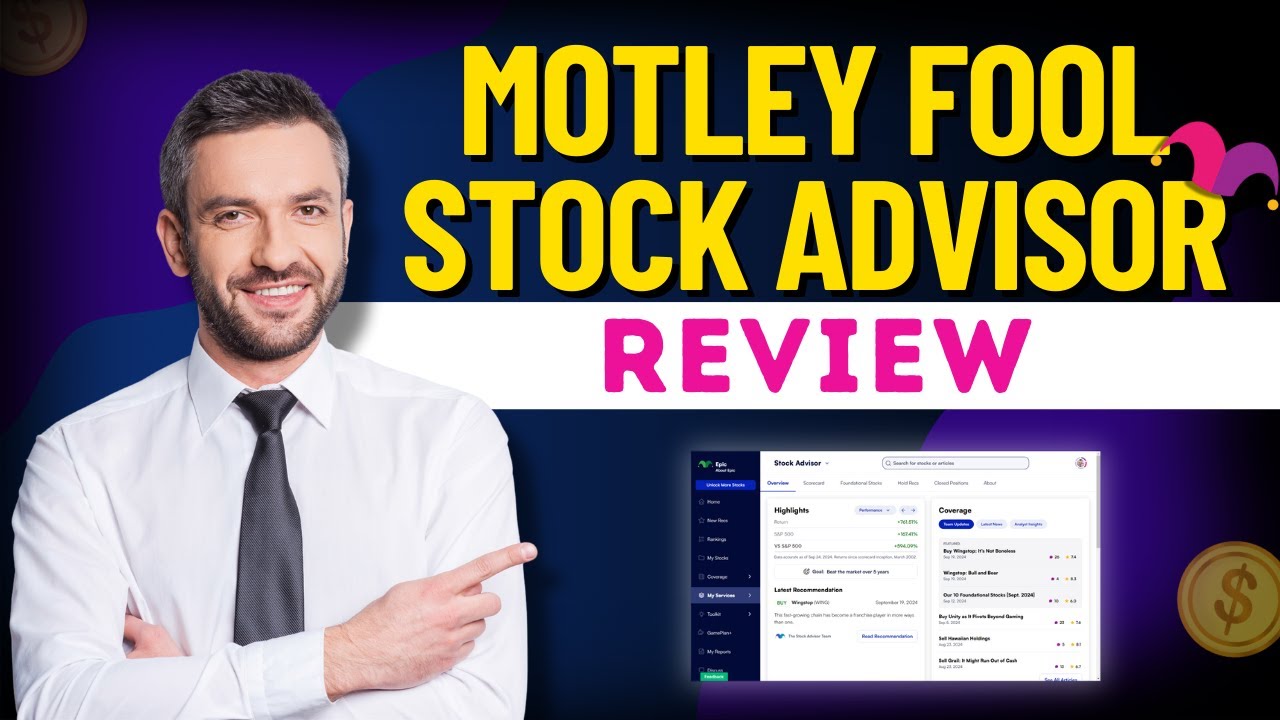
The Motley Fool’s flagship Stock Advisor newsletter has returned roughly 900–980% since its 2002 launch against the S&P 500’s 195–216% over the same period, a gap of nearly 4-to-5x that has made it one of the most successful and most scrutinized stock-picking services in financial media — but the headline number obscures a messier reality about dispersion, survivorship, and whether an individual investor can actually stomach the ride.
The Headline Numbers, and Why They Vary by Source
Depending on which snapshot date you check, Stock Advisor’s cumulative return since inception ranges from roughly 883% to 981%, against an S&P 500 benchmark return of 193% to 216% over the same window. One independent audit from mid-August 2026 put the live “official book” at +981% versus the index’s +216%, translating a hypothetical $10,000 investment in 2002 into approximately $108,100 by following Stock Advisor’s recommendations, versus about $31,600 for the same amount tracking the S&P 500. An earlier independent audit in February 2026 produced a slightly lower pair — $98,841 for Stock Advisor against a comparable index path — a reminder that these figures move meaningfully depending on exactly when they’re measured and which positions remain in the “official” book.
Other reviewers cite different but directionally similar figures: one calculation from July 2026 put Stock Advisor’s average pick return at 934% against the S&P 500’s 210%, while a broader review from earlier in the year cited nearly 1,000% versus roughly 200% for the index, implying a $20,000 investment would have grown to around $200,000 following Stock Advisor versus $60,000 in an index fund.
What’s Actually Driving the Outperformance
The overwhelming driver of Stock Advisor’s long-run numbers is not consistent stock-picking skill across hundreds of recommendations — it’s a handful of extraordinary early calls. The service’s cumulative returns since 2002 include original recommendations on Amazon, Netflix, and Nvidia, each of which delivered extraordinary multi-decade compounding that a handful of newer or smaller subscriptions could never replicate in the same way. A more recent independent audit found 49 “ten-baggers” (positions up 1,000% or more) and 173 “doublers” among 523 consolidated positions tracked since inception, alongside a 66% overall win rate.
That last figure matters. A 66% win rate means roughly one in three recommended stocks has lost money relative to the market, or outright lost value. The service’s philosophy explicitly embraces this: Motley Fool’s own messaging emphasizes long holding periods of five-plus years and treats volatility as the cost of capturing rare, outsized winners, rather than something to avoid through diversification alone.
The Part the Marketing Doesn’t Emphasize: Dispersion
2026 in particular has been described by one independent reviewer as “not a flat-index year.” The S&P 500 itself was up roughly 14.5% for the year as of mid-August, but that headline figure masks what the same source called “a 211-point civil war” within the market: the average top-20 performing stock in the index was up 170.4%, while the average bottom-20 was down 40.5%. Similarly wide swings show up inside Stock Advisor’s own book, with one flagged example — SanDisk — up 591% while other positions in the same portfolio sat 25–50% underwater at the same time.
This dispersion is the crux of any honest Motley Fool vs Fidelity or fool.com stock advisor comparison: the aggregate return figure is real, but it says little about what it actually feels like to hold the portfolio day to day. An investor who panic-sells the underwater names while the market “looks fine” on the surface is likely to capture a small fraction of the headline return, because the entire strategy depends on holding losers long enough for the eventual winners to compound.
Cost and Structure: What You’re Actually Paying For
Stock Advisor’s base subscription runs at a promotional rate as low as roughly $1.43 per week for new members (a discount off the standard $199/year list price), though pricing structures and promotional offers shift throughout the year. Beyond the core newsletter, subscribers get:
- Monthly stock recommendations from co-founders David and Tom Gardner’s research teams
- “Best Buys Now” — ten timely picks curated from a broader universe of 300-plus tracked securities
- “Starter Stocks” recommendations aimed at newer investors
- Full historical access to every previous recommendation and its tracked performance
- A community forum for discussion among subscribers
The Motley Fool also operates several higher-tier services — reportedly ranging up to $13,999 per year for its most exclusive offerings — which industry reviewers have criticized for aggressive upselling once a subscriber joins the base Stock Advisor tier.
Stock Advisor vs. Index Funds vs. Fidelity: A Practical Comparison
| Approach | Typical Cost | Historical Return Profile | Best Fit For |
|---|---|---|---|
| Motley Fool Stock Advisor | ~$99–$199/year | High dispersion, ~4–5x index over 20+ years (driven by a few big winners) | Long-term investors who can hold through 30–50% drawdowns on individual names |
| S&P 500 index fund (e.g., via Fidelity) | Often 0% expense ratio on Fidelity ZERO funds | Broad market return, lower dispersion | Investors prioritizing simplicity and lower behavioral risk |
| Fidelity brokerage + individual stock-picking | Trade commissions may apply | Depends entirely on individual skill | DIY investors who want control without a subscription fee |
Trustpilot data cited by one reviewer shows Stock Advisor holding a 3.5 “average” TrustScore across roughly 9,000 reviews — respectable but not exceptional, reflecting a customer base that includes both satisfied long-term holders and subscribers frustrated by drawdowns or aggressive sales tactics toward higher-tier products.
Who Should Actually Subscribe
Reviewers broadly converge on a similar verdict: Stock Advisor tends to suit investors with a portfolio in the tens of thousands of dollars who are comfortable holding individual stock positions for five or more years and who won’t abandon a recommendation purely because it’s down 30–40% from its purchase price. It tends to be a poor fit for investors who are already fully allocated to index funds and satisfied with market returns, or for anyone seeking short-term trading signals, income-focused strategies, or frequent market-timing calls — none of which are part of the service’s stated philosophy.
Key Takeaways
- Motley Fool Stock Advisor has returned approximately 900–980% since 2002, versus roughly 195–216% for the S&P 500 over the same period, depending on the measurement date.
- The outperformance is heavily concentrated in a small number of extraordinary early winners (Amazon, Netflix, Nvidia), not uniform skill across all picks.
- The service’s own win rate sits around 66%, meaning roughly a third of recommendations underperform or lose money.
- 2026 has shown unusually wide dispersion between top and bottom performers both in the S&P 500 and within Stock Advisor’s own book.
- The service costs roughly $99–$199/year at the base tier, with significantly more expensive upsell tiers reaching into the thousands of dollars.
Frequently Asked Questions
Does Motley Fool Stock Advisor really beat the S&P 500?
Historically, yes, on a cumulative basis since its 2002 launch — but the outperformance is concentrated in a handful of exceptional picks, and past performance doesn’t guarantee similar future results.
Is Motley Fool Stock Advisor better than just buying an index fund?
It depends on your risk tolerance and time horizon. Index funds offer more predictable, lower-dispersion returns; Stock Advisor’s approach requires tolerating significant drawdowns on individual names in pursuit of outsized long-term winners.
How much does Motley Fool Stock Advisor cost?
The base subscription typically lists at $199/year, though promotional pricing has offered new members rates as low as roughly $1.43/week. Higher-tier services cost substantially more.
Discover more from The Economy
Subscribe to get the latest posts sent to your email.



The KOSPI is sensitive to major Korean semiconductor companies but is not solely a technology index. Currency, sector weights and market timing all matter. Original research October 12; updated October 15, 2026. Verify newer developments before publication.
On October 15 the KOSPI closed 7.57% lower at 5,554.22 amid an AI-linked chip stock selloff. Reuters reported that the exchange invoked its circuit breaker during the session. This verified update supersedes earlier articles dated October 12. Source. Historical material further below is contextual and must not be mistaken for a live quotation or price.
What changed since the original research cutoff
On October 15 the KOSPI closed 7.57% lower at 5,554.22 amid an AI-linked chip stock selloff. Reuters reported that the exchange invoked its circuit breaker during the session. This verified update supersedes earlier articles dated October 12. The publication date and observation time are crucial: market prices, competition results and government announcements cannot be extrapolated from an earlier snapshot. A more useful reader question is what remains current today and what requires verification at the moment of a financial or travel decision. The new development should be checked against the primary or contemporary reference rather than assumed from an older headline.
What is happening and why readers are searching
South Korea’s KOSPI has become a vivid measure of the rewards and risks of the AI hardware trade. October 12 coverage described a sharp retracement following an exceptionally strong first-half rally, with Samsung Electronics and SK Hynix central to market moves. Such reporting should be read in context: a dramatic fall after a large rise can coexist with a positive year-to-date performance. Sources: Business Insider KOSPI analysis and Barron’s chip market coverage.
The important context competitors can overlook
KOSPI is a stock-market index, not an ETF or an individual security. Investors considering exposure must distinguish the benchmark from specific Korea funds, currency hedges and concentrated semiconductor holdings. Global demand for high-bandwidth memory matters, but so do chip pricing, inventory cycles, capital spending and the Korean won. A profitable technology cycle can still produce volatile stock returns when valuations already anticipate perfection. For primary-source checks and current reporting, see Business Insider KOSPI analysis and Reuters chip demand report. The key distinction is explain memory-chip concentration and cross-market exposures.
A practical way to use this information
When comparing KOSPI with Taiwan’s Taiex or the Nasdaq, choose the same observation window and clearly state whether figures are measured in local currency or dollars. Look at index sector weights and market breadth, not simply at a sensational one-day percentage. For an American investor, foreign-market trading hours and fund tracking error also complicate any quick “buy the dip” narrative.
Three comparisons KOSPI commentary should not mix
First, a single-session decline measures the change from yesterday’s close, not the loss from a peak. Second, a drawdown from the year’s high measures market turbulence even if the year-to-date return stays positive. Third, an unhedged foreign investor’s return includes the Korean won against the investor’s home currency. The three numbers can point in different directions without contradiction.
The October 12 Barron’s chip coverage highlights why semiconductor movements deserve separate treatment. Do not infer exact index performance from the percentage declines of two chipmakers.
What to verify before making a decision
The right next step is to identify the source, timestamp and applicable market or jurisdiction. Check whether a number is a historical observation, official announcement, target, forecast or scenario. If you intend to act financially, legally or commercially, use the relevant provider’s current terms and obtain professional advice where appropriate. The sources cited here establish context; they are not a substitute for live prices, individual eligibility checks or binding agreements.
Reader questions
Why does KOSPI move when AI chips move? Large South Korean technology and memory-chip companies have a significant influence on the index.
Can an index decline while remaining up for the year? Yes; the result depends on the starting point and the comparison period.
Why the KOSPI is not simply a technology index
The Korea Composite Stock Price Index tracks a broad share market, but its largest constituents can make semiconductor news disproportionately important. Changes in expectations for memory-chip prices, AI servers and electronics demand can therefore move the benchmark even when many other domestic businesses are relatively stable. Investors should distinguish an index-weighting effect from evidence that every Korean company is experiencing the same change. A semiconductor downturn may hurt export earnings while benefiting downstream buyers from lower component costs.
South Korea also has globally connected manufacturing companies in automobiles, batteries, chemicals, shipbuilding and industrial equipment. Domestic policy, currency trends and global trade conditions can influence those industries differently. An accurate KOSPI explainer identifies which sector is moving the index on a particular day and whether the move is broad or concentrated. It does not describe a drop in two heavyweight stocks as proof that the entire economy has entered a recession.
The role of memory chips and AI infrastructure
High-bandwidth memory, often discussed as HBM, supports demanding AI workloads by providing fast data movement near computing accelerators. Demand for HBM can benefit qualified suppliers, but profitability depends on manufacturing yields, product mix, competition and customer pricing. Traditional DRAM and NAND markets have different end uses and inventory cycles. Consequently, a headline saying “AI chip prices are rising” may be too broad to explain a specific company’s quarter. Investors should read product-level commentary rather than infer that every semiconductor shipment is equally profitable.
Semiconductor investment is cyclical. Producers commit to costly factories and equipment well before their output reaches the market. Strong prices may encourage capacity expansion; later, oversupply can compress margins. Conversely, constrained manufacturing capacity can support pricing for some products while limiting volume growth. Supply contracts and technical qualifications can smooth these fluctuations, but they do not eliminate them. A balanced market note includes both demand and the possibility of supply catching up.
Currency and foreign-investor flows
A U.S. investor buying a Korean equity fund has at least two kinds of exposure: share-price changes and the won-dollar exchange rate, unless the investment vehicle hedges currency. Imagine Korean shares rise 8% in local currency while the won weakens against the dollar. The dollar return can be lower than 8%; if the currency move is sufficiently large, the investor could lose money in dollars despite positive local share performance. Conversely, won appreciation can amplify a local gain. Actual fund returns also reflect fees and tracking differences.
Foreign investors may shift exposure because of global interest rates, geopolitical developments or a change in the perceived risk of Asian hardware companies. Those flows can intensify short-term price moves. They are not evidence of a permanent change in Korea’s long-run technological position. Readers should use closing data in the correct time zone and avoid comparing Seoul’s closing prices with a U.S. market snapshot several hours later as if the observations were simultaneous.
A five-indicator KOSPI dashboard
Track the index’s performance both year to date and from its recent peak; those windows answer different questions. Review market breadth to see whether small and medium-sized companies are sharing the move. Compare major semiconductor companies’ operating outlooks, particularly memory product mix and capacity plans. Note the won-dollar rate and the direction of foreign-investor flows. Finally, monitor relevant global AI capital-spending announcements—but distinguish an announced customer budget from actual Korean supplier orders.
For long-term investors, the right comparison may be a diversified Asian equity portfolio rather than an individual semiconductor name. Country, sector and currency concentration can compound one another. A fund that appears to provide “international diversification” may still be heavily exposed to the global technology investment cycle. Review the fund’s holdings and benchmark methodology rather than relying on the label alone.
What the index cannot tell you
A sharp daily selloff is a price signal, not a direct measurement of factory production, employment or household welfare. Nor does a strong rally guarantee that companies will meet aggressive earnings expectations. The meaningful question is whether the latest market price embeds assumptions about AI demand, semiconductor margins and currency conditions that remain plausible. Different investors will answer that question differently depending on horizon and tolerance for losses.
For a useful daily update, record the exact KOSPI close, its point and percentage change, the date in Korea, and the principal named contributors. Without that basic timestamp discipline, even an otherwise informed global-market article can unintentionally misstate what happened.
Discover more from The Economy
Subscribe to get the latest posts sent to your email.

CoreWeave shares have become a direct test of how investors value artificial-intelligence infrastructure when the cost of capital rises. An October 14 Reuters report described a severe selloff across AI-related stocks after unexpectedly strong U.S. inflation data and singled out CoreWeave’s financing exposure. The central investing question is not whether AI demand exists. It is whether the company’s contracted demand, operating cash generation and available funding can support the speed and cost of construction implied by its expansion plans. For primary-source background, consult Reuters October 14 AI selloff; Financial Times CoreWeave funding; CoreWeave investor relations. In a fast-moving topic, publication time and information cutoff matter: subsequent events may require updating the figures or legal status, not merely changing the date in the footer.
What triggered the latest CoreWeave attention
The October inflation surprise raised investors’ expectations for interest rates and the price of financing long-duration projects. Reuters reported sharp declines in AI-infrastructure names, including CoreWeave, during the October 14 session. A one-day stock move is an observed price reaction, not evidence that its customers have canceled contracts. But the selloff makes funding structure newly important. Businesses that must invest cash today to earn revenue over years are highly sensitive to financing rates, payment schedules and equipment-value assumptions. Investors should confirm the trading session, percentage return and share class from an exchange or market-data service before republishing a price snapshot.
CoreWeave shares have become a direct test of how investors value artificial-intelligence infrastructure when the cost of capital rises.
Why AI infrastructure differs from an ordinary software company
CoreWeave supplies compute infrastructure, including GPU-intensive capacity used for AI workloads. Unlike a software business that can sell more subscriptions with limited marginal hardware investment, a compute provider may need expensive servers, electricity arrangements, networking, cooling systems and leases before customer revenue arrives. This can create a timing mismatch between contracted demand and free cash flow. Contract backlog can indicate future business, but it should never be substituted for cash already received. Terms for delivery, termination, prepayments and customer concentration can matter as much as the top-line headline number.
Debt, leases and the financing sensitivity
The Financial Times described CoreWeave seeking institutional financing for a large infrastructure build-out. Debt and lease obligations create fixed or contractual costs even when equipment utilization fluctuates. Investors should distinguish balance-sheet borrowings, lease liabilities, securitized equipment financing and contingent commitments; simplistic claims that all financing is identical distort risk. The cost of debt can rise sharply if lenders demand more compensation for uncertainty. At the same time, long-duration enterprise contracts can reduce revenue uncertainty. A sensible analysis weighs both sides and studies repayment schedules rather than judging the company by one leverage ratio.
Demand quality and customer concentration
AI companies and enterprise customers can require substantial compute, but customer contracts differ in reliability and profitability. A long agreement with a strong counterparty may support asset-backed financing more effectively than several short contracts with uncertain collection. Yet dependence on a few large buyers creates negotiating power and renewal risks. Look for disclosure about remaining performance obligations, revenue recognition, prepayments, utilization and customer concentration. An impressive backlog can coincide with negative free cash flow because building the capacity to fulfill those obligations is costly. The investment case strengthens only when large demand translates into economic returns after depreciation, interest and maintenance.
What valuation methods tell different stories
Price-to-sales ratios focus on revenue growth but ignore the cost required to deliver it. Enterprise value to EBITDA can obscure heavy capital replacement costs if depreciation is particularly meaningful. Free cash flow, measured consistently, makes investment intensity visible but may temporarily penalize a fast-growing construction phase. No single metric is decisive. Compare the company with infrastructure providers facing similar capital needs rather than only with asset-light software companies. Then stress-test outcomes under higher borrowing rates, slower installations, lower GPU pricing and changes in customer demand. These are scenarios, not assertions about what management will do.
Worked example: how to interpret a difficult headline
Imagine two AI-cloud projects with identical contracted revenue. Project A finances infrastructure at a lower fixed rate and launches on time; Project B faces a financing reset, a construction delay and higher electricity costs. The revenue headline may look the same, but cash generation and equity value could differ considerably. This is why debt maturity, deployment timing and customer collection are better questions than the size of an announced deal alone. This is a deliberately illustrative comparison unless explicit documented numbers are identified. It should not be mistaken for a real person’s financial circumstances, an unverified event, or a guaranteed forecast. Its purpose is to show how a reader can apply the underlying principle and identify which information still needs to be checked.
Three concepts that are often confused
| Concept | What it actually establishes |
|---|---|
| Revenue growth | Describes delivered services; does not equal net cash generation. |
| Backlog or contract value | Indicates potential future work subject to conditions and timing. |
| Cash flow after capital spending | Tests whether expansion economics can sustain funding obligations. |
These distinctions are more than technical niceties. They change the answer to the reader’s question. An estimate does not carry the same evidentiary weight as a final rule; an announcement does not have the same practical consequence as a completed transaction; and a provisional interpretation should not be presented as a confirmed event. Wherever a live source supplies a new fact, the editor should check whether the old text still describes the right stage of the process.
A reader’s verification workflow
Start by recording the precise claim and the date it was allegedly true. Open the primary announcement or filing rather than a social-media screenshot. Ask whether the source has an incentive to present only the most favorable interpretation, and corroborate material facts with reputable independent reporting where available. For numerical claims, note the denominator, timeframe and whether the number is a stock, a flow, a forecast or a realized result. For legal claims, note the court, agency, stage of proceedings and exact published document.
Next, separate information useful for immediate decisions from context that merely explains the headline. A person may need to act on a deadline even when the long-run political debate remains unresolved. Someone evaluating a security may need financing details, while a customer comparing technology products needs a tested specification and local warranty terms. The same headline can matter for different reasons; the article should therefore provide an actionable answer without implying that every reader faces the same circumstances.
Indicators and developments worth monitoring
- Company quarterly financial filings and debt footnotes.
- Interest rates and spreads on financing vehicles.
- Capacity construction and customer-service activation.
- New customer agreements and changes in utilization.
Avoid treating these signals as a checklist that mechanically predicts the future. Some are leading indications and others are lagging measurements. A change becomes significant only after its magnitude, source and comparison period are understood. If two reputable sources disagree, explain the source of the difference—definitions, timing, jurisdiction, measurement or uncertainty—instead of selecting whichever number makes the strongest headline. That practice strengthens both reader trust and the article’s usefulness in search features that surface isolated paragraphs.
The specific information advantage of this article
Growth forecasts grab attention but often hide the cost of building the revenue-generating assets. Treat contract backlog and installed capacity as distinct measures, then compare them with borrowing needs, lease liabilities and cash returns. This is the difference between an AI-demand story and a credible investment-risk story.
Frequently asked questions
Is CoreWeave stock the same as buying Nvidia?
No. CoreWeave operates compute infrastructure with financing and customer risks unlike a semiconductor designer. For individual decisions, consult the primary institution or product provider, and use the exact relevant date.
Why did rising rates matter?
More expensive capital can reduce the present value of future cash flows and make funding new servers costlier. For individual decisions, consult the primary institution or product provider, and use the exact relevant date.
Does backlog guarantee profit?
No. Contracts must be fulfilled, and expenses, financing and accounting recognition determine profitability. For individual decisions, consult the primary institution or product provider, and use the exact relevant date.
What is the biggest unresolved question?
Whether contracted capacity can generate durable cash returns after equipment, power and financing costs. For individual decisions, consult the primary institution or product provider, and use the exact relevant date.
Bottom line
CoreWeave shares have become a direct test of how investors value artificial-intelligence infrastructure when the cost of capital rises. An October 14 Reuters report described a severe selloff across AI-related stocks after unexpectedly strong U.S. inflation data and singled out CoreWeave’s financing exposure. The central investing question is not whether AI demand exists. It is whether the company’s contracted demand, operating cash generation and available funding can support the speed and cost of construction implied by its expansion plans. The best next step is to identify which of the monitored developments could change this answer and use a current, authenticated record before acting. Clear distinctions between confirmed facts, estimates, proposals and contested claims are more valuable than dramatic certainty.
Discover more from The Economy
Subscribe to get the latest posts sent to your email.
Markets & Finance
Strait of Hormuz in 2026: Why Shipping Risks Matter for Oil, Insurance and Food Prices

The Strait of Hormuz connects Persian Gulf exporters with global sea routes, making uncertainty around maritime passage a global cost issue. Recent October 2026 reporting linked Middle East tensions with elevated energy prices. That is a reason to analyze shipping risk; it is not evidence that every reported confrontation caused an enduring closure of the waterway. Sources: Associated Press energy coverage and International Monetary Fund.
The important context competitors can overlook
The transmission mechanism runs through multiple channels: cargo delays, tanker insurance, longer voyages, available ships, refinery feedstock and energy prices. Diesel, jet fuel and petrochemicals may respond differently. High transport costs can also affect importers that do not buy oil directly from the Gulf because global fleets and commodity prices are interconnected. For primary-source checks and current reporting, see Associated Press energy coverage and World Trade Organization. The key distinction is explain chokepoint transmission without predicting incidents.
Hormuz shipping risk can raise costs even without a sustained closure. Distinguish maritime warnings from confirmed supply interruptions. Research cutoff: October 12, 2026; confirm developing facts before publication.
A practical way to use this information
When covering an incident, check time, coordinates, vessel identity and independent verification. Distinguish a threat, a temporary diversion, a passage restriction and a sustained closure. For readers, show how businesses might respond with inventory buffers, alternative suppliers or freight surcharges, but avoid quoting a precise inflation impact without a defensible model.
What to verify before making a decision
The right next step is to identify the source, timestamp and applicable market or jurisdiction. Check whether a number is a historical observation, official announcement, target, forecast or scenario. If you intend to act financially, legally or commercially, use the relevant provider’s current terms and obtain professional advice where appropriate. The sources cited here establish context; they are not a substitute for live prices, individual eligibility checks or binding agreements.
Reader questions
Why is Hormuz important beyond crude oil?
Refined-fuel supply chains, ship insurance and freight costs can spread impacts across industries.
Is a shipping incident proof the strait is closed?
No. Specific passage restrictions require separate verification.
Why the geography creates outsized economic exposure
The Strait of Hormuz is a maritime passage connecting the Persian Gulf with the Gulf of Oman and onward sea routes. Energy producers, importers, ship operators and insurers pay attention because a disruption in a narrow passage can affect many cargoes at once. Its importance does not require the claim that the strait has been closed. Even elevated uncertainty can change how shipowners price voyages or how refiners plan inventories. The actual effect depends on severity, duration, geography and whether commercial vessels can continue operating safely.
Not every barrel that leaves a Gulf producer has exactly the same destination or transport option. Some infrastructure can reduce reliance on particular routes, but it does not imply that all cargoes have an easy substitute path. The availability of alternatives depends on product type, pipeline and port capacity, contracts and political circumstances. Articles should avoid unverified claims about the share of all world oil that travels through the waterway without citing a dated primary-energy assessment.
The difference between a threat and a closure
A reported warning, a temporary security incident, a route diversion and a sustained interruption are materially different events. An isolated confrontation may raise perceived risk without stopping most commercial traffic. A major insurance repricing can occur even when vessels continue sailing. Conversely, a prolonged interruption could reduce shipments and force changes in procurement. Journalists should establish what is confirmed, including location, time, vessel identities, official notices and independent maritime evidence, before describing an incident as a shipping blockade.
Vessel-tracking displays are useful but imperfect. Ships can have delayed reporting, technical gaps or intentionally limited signals. One missing tracking point is not proof that a tanker was seized or attacked. When incident claims circulate, prioritize corroboration from shipping operators, maritime authorities and credible reporting. Time-zone conversion and ship-name accuracy are important because a single voyage may appear under different timestamps in public databases.
Insurance, freight rates and refinery feedstock
Ship operators may face higher war-risk premiums, charter rates or security costs when a route becomes dangerous. Those costs can be passed into freight contracts depending on commercial terms. A longer journey uses ship capacity for more days and can tighten fleet availability beyond the immediate route. Refineries may also pay more for feedstock or seek substitute grades if usual supply becomes uncertain. All of these adjustments can change delivered costs before any final consumer-price effect is visible.
Energy markets also distinguish crude oil, refined diesel, gasoline, aviation fuel and liquefied natural gas. Cargo routes and supply buffers are not identical. A single oil futures chart therefore cannot measure the exposure of every importing country. A chemical manufacturer worried about feedstock, an airline worried about jet fuel and a utility worried about gas supplies may need separate analysis despite sharing concern about the same shipping region.
How the shock might reach household budgets
The transmission path can run from transport disruption to higher wholesale energy prices, then to logistics, manufacturing and certain retail costs. The size and speed of pass-through depend on inventories, contracts, taxes, domestic competition and currency values. Import-dependent countries may feel a stronger immediate effect than producers with ample domestic supply, but outcomes are not uniform. Central banks may monitor whether energy volatility changes inflation expectations; that does not establish an automatic interest-rate response.
Food prices can be affected indirectly through agricultural fuel, fertilizer and freight, yet blaming a given grocery-price change on Hormuz requires evidence. Weather, local production and retail competition also matter. An explanatory article should trace the mechanism without claiming a precise household inflation effect when no suitable model or data is available.
A practical risk dashboard
Track verified maritime advisories, commercial-traffic continuity, freight and insurance developments, crude and product benchmarks, inventory data and the relevant government’s policy response. Mark each indicator with a date and distinguish confirmed conditions from forecasts. For a business importing critical inputs, the operational questions include alternate suppliers, shipment buffers and exposure under freight contracts. For households, generalized resilience may involve budgeting for energy volatility rather than reacting to unverified predictions of imminent shortages.
The central lesson is proportionality: a narrow maritime passage can create global risk without every tense incident automatically becoming a global supply shutdown. The article should reflect that difference every time a new headline arrives.
Hormuz risk scenarios and the evidence each requires
A temporary maritime warning: Confirm the issuing authority, geographic scope and duration. Such a warning can raise concern without stopping ordinary passage. Report what commercial operators are actually doing, rather than treating a warning itself as proof that all shipping has ceased.
A measurable freight-cost increase: Obtain a dated freight or insurance measure and establish whether the movement is linked to the relevant route. Shipping prices also respond to global fleet supply, fuel costs and seasonal trade, so a single increase may have multiple causes. Explain whether the quoted charge applies per ship, cargo value or voyage.
A prolonged physical disruption: Verify evidence of sustained passage restrictions and the duration. Consider inventory buffers, substitute routes, refinery demand and government responses before estimating economic effects. A hypothetical supply-loss scenario can help readers understand risk, but must be labeled clearly and not reported as an observed event.
Discover more from The Economy
Subscribe to get the latest posts sent to your email.

KOSPI Crash October 2026: What Korea’s Chip Selloff Reveals

CoreWeave Stock 2026: CRWV, AI Infrastructure Debt and the Selloff Explained

OP-ED:The AI Race Has No Single Winner — And Pakistan Must Choose Its Own Future

VA Disability Rates Increase 2027: The Confirmed 3.6% COLA Explained

US–China AI Export Controls in 2026: Chips, Testing Rules and Corporate Risk

World Trade in 2026: Tariffs, Supply Chains and the Cost of Fragmentation

Global Economy Outlook 2026–27: What to Watch Ahead of the IMF October Report

Strait of Hormuz in 2026: Why Shipping Risks Matter for Oil, Insurance and Food Prices

US–China Critical Minerals Competition in 2026: Who Controls the Supply Chain?

Oil and Diesel Prices in October 2026: How Supply Shocks Can Reach Inflation

AI Chip Demand in 2026: What TSMC, Nvidia and Data-Center Spending Reveal

Q3 2026 Earnings Season: The Bank, AI and Consumer Signals That Really Matter

Treasury Yields in 2026: Why Higher Bond Rates Matter for Stocks, Mortgages and Savings

KOSPI 2026: Why South Korean Stocks Turned Volatile and What AI Investors Should Watch

World’s Largest Economies: Ranking the Top Global Powers

Global Pension Systems Ranked: The World’s Best and Worst Retirement Frameworks

Crude Oil & Petroleum Market Analysis: OPEC+ Decisions and Price Forecasts

Pakistan Economy 2026: Inside the SBP’s Balancing Act

GasBuddy Market Insights: How Crude Price Shifts Impact Local Fuel Cost Averages

Global Equity Market Divergence: US Tech vs. European Dividend Stocks vs. Asian Growth

IMF & World Bank Global Economic Outlook: Growth Forecasts Across Europe and Asia

Bitcoin Price Forecast 2026–2027: Will the 4-Year Cycle Hold?

Silver Price Today: Why the Xi-Trump AI Standoff Is Fueling a Safe-Haven Rally

The Future of Silicon: Supply Chain Vulnerabilities in the 2026 Tech Sector

Asian Stock Markets 2026: Japan, China, Pakistan & More

Stagflation vs. Soft Landing: How Central Bank Rates Are Reshaping European and Asian Economies

SpaceX IPO: How Aerospace Is Reshaping Tech Startup News

SpaceX IPO 2026: History’s Biggest Stock Debut?
-

 Markets & Finance9 months ago
Top 15 Stocks for Investment in 2026 in PSX: Your Complete Guide to Pakistan’s Best Investment Opportunities
-

 Analysis8 months ago
Johor’s Investment Boom: The Hidden Costs Behind Malaysia’s Most Ambitious Economic Surge
-

 Analysis8 months ago
Top 10 Stocks for Investment in PSX for Quick Returns in 2026
-

 Banks9 months ago
Best Investments in Pakistan 2026: Top 10 Low-Price Shares and Long-Term Picks for the PSX
-

 Analysis8 months ago
Brazil’s Rare Earth Race: US, EU, and China Compete for Critical Minerals as Tensions Rise
-

 Investment9 months ago
Top 10 Mutual Fund Managers in Pakistan for Investment in 2026: A Comprehensive Guide for Optimal Returns
-

 Global Economy10 months ago
15 Most Lucrative Sectors for Investment in Pakistan: A 2025 Data-Driven Analysis
-

 Global Economy10 months ago
Pakistan’s Export Goldmine: 10 Game-Changing Markets Where Pakistani Businesses Are Winning Big in 2025