
Analysis
Indonesia Trade Deficit 2026: The Real Story Behind Rupiah

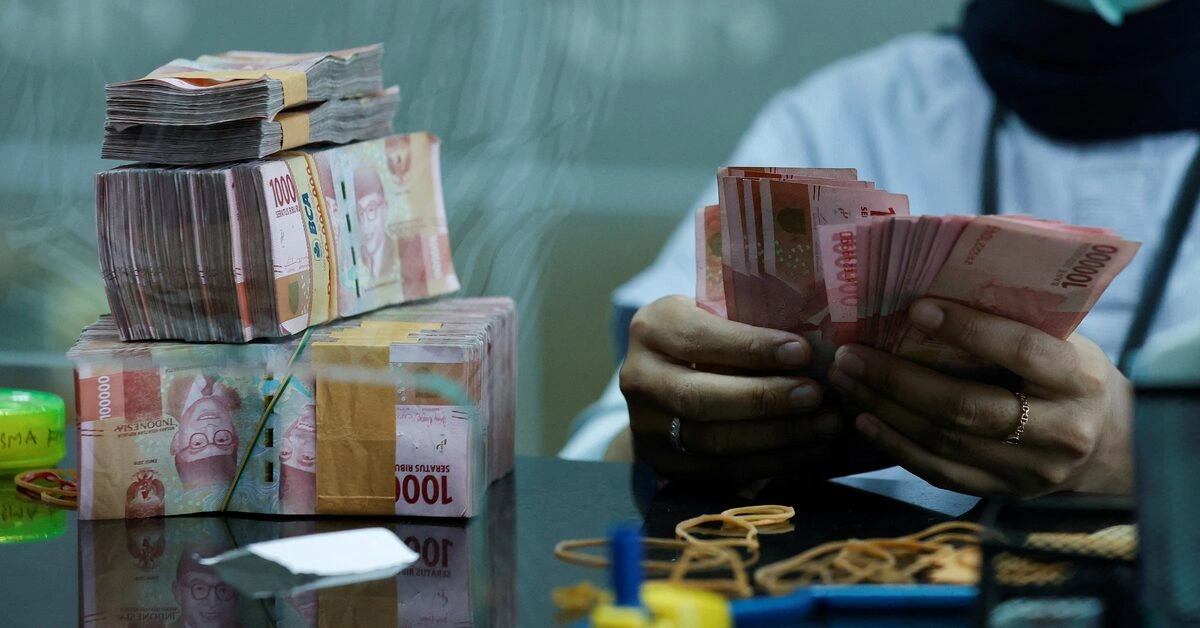
Indonesia’s balance of trade turned negative for the first time in six years, with skyrocketing oil prices pushing up import costs while weak global demand simultaneously suppressed exports (The Jakarta Post). That headline alone would normally dominate a news cycle. But it’s actually the second-most important economic story unfolding in Indonesia right now — and understanding why requires looking past the trade numbers to what’s happening with the rupiah and the country’s manufacturing base simultaneously.
The Currency Squeeze
The rupiah has been under sustained pressure, trading near Rp 18,000 per US dollar as weak manufacturing data and concerns over Indonesia’s foreign exchange reserves weighed on sentiment (Jakarta Globe). Bank Indonesia has responded with aggressive rate hikes specifically aimed at defending the currency — a defensive posture that international ratings agency Fitch has characterized as underscoring the central bank’s resolve amid policy uncertainty and investor concern (Jakarta Globe).
That’s an important signal in itself: when a central bank is hiking rates primarily to defend a currency rather than to cool domestic demand, it usually means the currency pressure is coming from external or structural sources that domestic monetary policy can only partially offset.
The Manufacturing Collapse Hiding Behind the Trade Headline
Here’s the detail that deserves far more attention than it’s getting: Indonesia’s manufacturing sector suffered its sharpest contraction in a year, with the S&P Global Indonesia Manufacturing PMI plunging to 46.9 in June from 50.0 in May — the exact threshold separating expansion from contraction. New orders dried up while factory-gate prices rose at their fastest pace in nearly 13 years (The Jakarta Post).
That combination — collapsing new orders alongside accelerating input costs — is a genuinely difficult one for policymakers to address, because it doesn’t respond cleanly to either rate hikes (which would further squeeze weak demand) or rate cuts (which would worsen currency pressure and imported inflation). It’s the kind of stagflationary bind that tends to get buried under trade-deficit headlines but actually poses the harder policy problem.
Rising Inflation From an Unexpected Source
Indonesia’s June inflation accelerated to 3.34%, driven higher by rising non-subsidized fuel prices and airfares that pushed up transport costs specifically (Jakarta Globe). Gasoline alone was the largest single contributor to transportation inflation, adding 0.21 percentage points, with airfare and engine lubricants following close behind (The Jakarta Post).
This matters because it shows Indonesia’s inflation is currently import- and energy-driven rather than demand-driven — reinforcing why Bank Indonesia keeps the door open for further rate hikes even as domestic manufacturing and household purchasing power weaken simultaneously.
Danantara: The Sovereign Wealth Fund Under Scrutiny
Running parallel to the trade and currency story is a governance controversy around Danantara, Indonesia’s consolidated sovereign wealth vehicle. Finance Minister Purbaya has had to publicly defend Danantara’s “Patriot Bond” program, rejecting money laundering allegations after a civil society coalition formally appealed to the Financial Action Task Force (FATF) requesting an investigation into changes to Indonesia’s financial law (Jakarta Globe).
Separately, Indonesia’s existing sovereign wealth fund, INA (Indonesia Investment Authority), reported it has mobilized $4.7 billion in investments and secured $25 billion in additional commitments since its 2021 launch, with its new chief executive stating no immediate plans to issue debt because the fund holds sufficient capital despite recent market volatility affecting parts of its portfolio (The Jakarta Post). Danantara’s first consolidated financial report has been described by independent economists as a positive step toward transparency, though they stress timely disclosure and stronger governance remain essential going forward (Jakarta Globe).
For international investors, the FATF appeal specifically is worth monitoring closely — a formal international financial-crime watchdog inquiry, even if it ultimately clears the fund, introduces a reputational and compliance overhang that can affect how comfortable large institutional investors feel deploying capital alongside Danantara-linked vehicles in the near term.
Indonesia’s Answer: A New International Financial Hub
In the middle of this currency and governance turbulence, Indonesia is simultaneously moving forward with plans to launch a new international financial hub explicitly designed to attract global investors into government bonds and development projects, structured with a common-law framework modeled on Singapore’s approach rather than Indonesia’s existing civil-law system (Jakarta Globe).
That’s a notable structural bet — building a legally distinct enclave specifically to offer foreign investors the kind of contract predictability and dispute-resolution familiarity that Singapore has used to become Southeast Asia’s dominant financial centre. Whether it succeeds will depend heavily on execution details that remain largely unannounced.
The Coal Export Standoff: A Microcosm of the Bigger Tension
A smaller but telling story illustrates the friction between Indonesia’s export ambitions and domestic energy needs: the government temporarily suspended some coal exports to address rolling blackouts, but miners have shown they’re willing to export coal and simply pay resulting fines rather than sell into the domestic market at lower mandated prices (Nikkei Asia). That’s a clear signal that global coal prices currently offer a big enough premium over domestic obligations that financial penalties aren’t an effective deterrent — a policy design problem regulators will likely need to revisit.
What Foreign Investors Are Actually Doing Right Now
Despite all of this turbulence, foreign investors have poured $9 billion into Indonesian securities this year, with higher interest rates specifically boosting market confidence in fixed-income instruments (Jakarta Globe). That’s a genuinely important counter-signal to the doom-and-gloom trade deficit headlines — it suggests sophisticated capital is treating Indonesia’s higher-rate environment as a yield opportunity rather than purely a risk signal, even as the rupiah struggles.
What to Watch Next
The practical signals worth tracking over the coming months: whether Bank Indonesia’s rate path stabilizes or requires further hikes if June’s inflation trend persists; whether the June PMI contraction proves to be a one-month blip or the start of a sustained manufacturing downturn; how the FATF inquiry into Danantara’s Patriot Bond program resolves; and whether concrete details emerge on the new common-law international financial hub, which could meaningfully change Indonesia’s positioning as a capital markets destination if executed well.
The Bottom Line
Indonesia’s first trade deficit in six years is a real and legitimate warning sign, but it’s arguably the most visible symptom of a more complex underlying story: a currency under structural pressure, a manufacturing sector contracting for the first time in a year, energy-driven inflation squeezing households, and a sovereign wealth governance question still working through international scrutiny — all happening while foreign capital continues flowing into Indonesian bonds and the government bets on a Singapore-style financial hub to secure the country’s next growth chapter. Investors and businesses tracking only the trade balance headline are missing most of the actual story.
Discover more from The Economy
Subscribe to get the latest posts sent to your email.



Key Takeaways
- Rolex’s secondary market rose approximately 7.9% year-over-year as of 2026 (per WatchCharts data) — trailing Patek Philippe (+16.2%) and Tudor (+11.4%) but still outperforming Audemars Piguet (+3.4%).
- Rolex raised U.S. retail prices 4–9% in January 2026 (steel models ~5.6%, gold models ~8.7%), narrowing the historical gap between retail and pre-owned pricing.
- Not every model appreciates: steel sports references (Submariner, GMT-Master II, Daytona) have held value far better than two-tone or widely available dress references like the standard Datejust.
- The Lady-Datejust posted the sharpest 2026 gain among tracked collections — up 22.73%, from roughly $9,269 to $11,376 — driven by demand for smaller, “everyday luxury” watches.
- Gold’s rise past $2,400/oz has directly lifted the investment case for Rolex’s precious-metal references (Day-Date, Sky-Dweller, Yacht-Master).
The Model-by-Model Picture
| Category | 2026 Trend |
|---|---|
| Lady-Datejust | +22.73% (strongest performer among tracked collections) |
| Steel sports models (Submariner, GMT-Master II) | Held value well; corrected from 2022 peak but stabilized above retail |
| Daytona | Corrected from highs above $50,000 to the mid-$30,000s; still among the most sought-after references |
| Two-tone/widely available Datejust | Flat to negative — “holds value” is an overstatement for this category |
| Gold references (Day-Date, Sky-Dweller) | Lifted by gold’s rise above $2,400/oz |
Why the “Rolex Always Appreciates” Myth Is Fading
The pandemic-era boom pushed some references — the Daytona above all — to speculative highs disconnected from historical norms. Since the March 2022 peak, steel sports models have compressed meaningfully, and dealers who bought inventory near the top have in some cases faced 20–40% markdowns on liquidation. The lesson for 2026 buyers: Rolex as a category is not a monolith. Value retention depends heavily on specific reference, condition, and whether the piece comes with box and papers (“full set”).
What’s Actually Driving 2026 Strength
- Retail price increases raise the floor. When a new Submariner retails at $10,050 (up from $9,500), a pre-owned example at $11,000–$12,000 suddenly represents a smaller premium — narrowing the gap without secondary prices actually moving.
- Supply discipline remains Rolex’s core lever. The brand has never confirmed production numbers, and secondary-market premiums remain entirely a function of Rolex’s own manufacturing decisions — a risk factor as much as a support.
- Certified Pre-Owned rollout. Rolex’s now fully rolled-out CPO program has changed how buyers transact in the used market, adding a layer of brand-verified legitimacy that supports pricing.
The Case for Rolex as a Portfolio Diversifier
Financial advisors increasingly frame luxury watches not as a replacement for equities or bonds, but as a tangible, historically low-correlation diversifier — one that carries its own risks (illiquidity, condition-dependent pricing, no yield) but has demonstrated multi-decade resilience for specific references.
Is Rolex a good investment in 2026?
It depends heavily on the specific reference. Steel sports models like the Submariner and Daytona have held or grown in value; two-tone and widely available dress models generally have not. Overall, Rolex’s secondary market rose about 7.9% year-over-year in 2026, trailing Patek Philippe but ahead of Audemars Piguet.
Discover more from The Economy
Subscribe to get the latest posts sent to your email.

Navigating Mortgage and Loan Refinancing in a High-Yield Environment
Global public debt crossing critical thresholds has kept central bank policies volatile, resulting in fluctuating US Treasury yields throughout 2026. For homeowners and commercial property holders burdened by previous high-interest borrowing cycles, finding optimal refinance windows has become a high-stakes financial puzzle. Stalled disinflation and stubborn employment numbers mean rate cuts are incremental, requiring borrowers to act with precision.
Timing your mortgage or commercial loan refinance in this environment requires a deep understanding of yield curve movements and lender risk appetites.
Decoding 2026 Refinance Dynamics
The 10-Year Treasury Yield Benchmark
Mortgage rates continue to track closely with the 10-year US Treasury yield. When macroeconomic anxiety spikes debt issuance, yields rise, tightening consumer borrowing capacity. Savvy borrowers monitor weekly Treasury auctions to lock in rates during brief dip windows.
Hybrid ARMs and Alternative Structures
With fixed rates remaining elevated, 7/1 and 10/1 adjustable-rate mortgages (ARMs) have surged in popularity. These products offer lower initial monthly payments, giving borrowers breathing room until central bank easing cycles fully materialize.
| Loan Product | Current Rate Range | Best For | Key Risk Factor |
| 30-Year Fixed Mortgage | 6.2% – 6.8% | Long-term predictability | Higher initial monthly outlay |
| 7/1 Hybrid ARM | 5.5% – 5.9% | Short-term ownership / flipping | Rate reset risk after year 7 |
| Commercial Refinance | 7.0% – 8.2% | Corporate asset restructuring | Strict DSCR lender covenants |
Actionable Steps for Successful Refinancing
To maximize your chances of securing favorable refinance terms in a volatile market, follow a disciplined preparation strategy.
Boost Your Credit Score Immediately: Lenders in 2026 are applying stringent credit tiering; a 20-point increase can drop your APR by a crucial quarter-point.
Shop Regional Credit Unions: Smaller financial institutions often offer portfolio loans with more flexible underwriting than major national banks.
Calculate the Break-Even Point: Ensure your total closing costs are recouped through monthly savings within 24 months of closing.
“Market Strategist View: Refinancing in 2026 is an exercise in opportunistic timing. Borrowers must maintain immaculate financial profiles ready to strike the moment Treasury yields dip.”
Mastering the complexities of today’s debt environment ensures you can successfully lower your debt service costs and protect your long-term financial stability.
Discover more from The Economy
Subscribe to get the latest posts sent to your email.

The days of pulling generic auto insurance quotes based purely on your zip code and age are officially over. In 2026, insurance comparison engines are powered entirely by generative AI and real-time telematics. These platforms digest thousands of live data points—ranging from your driving smoothness via connected vehicle sensors to real-time traffic congestion patterns—to generate hyper-personalized premiums instantly.
For consumers, this evolution represents both a massive opportunity for savings and a hidden trap for penalty pricing. Understanding how AI algorithms evaluate risk is essential for anyone looking to lower their monthly auto insurance premiums.
How AI Comparison Engines Evaluate Your Risk Profile
Behavioral Telematics and Connected Cars
Modern cars stream performance data directly to insurance aggregators. Generative AI models analyze braking sharpness, acceleration curves, cornering G-forces, and phone distraction metrics. Drivers who maintain smooth, defensive habits are rewarded with dynamic rate cuts of up to 40% compared to traditional rating tiers.
Predictive Traffic and Weather Modeling
AI tools now cross-reference your daily commute route with predictive weather and accident probability models. If your standard parking location or driving corridor has a statistically higher incidence of uninsured motorist claims, your quotes will reflect that hyper-local risk assessment.
| Comparison Factor | Traditional Rating Model | 2026 Generative AI Model | Impact on Premium |
| Mileage & Usage | Annual estimated odometer reading | GPS tracking & live trip duration | High (up to 35% savings) |
| Driving Behavior | MVR driving record & accidents | Real-time braking, speed, & G-force | Critical (determines tier) |
| Vehicle Tech | Make, model, and safety rating | ADAS calibration & repair cost data | Moderate |
Strategies to Lower Your AI-Driven Insurance Quote
To outsmart the algorithm and secure the lowest possible premium in 2026, drivers must proactively manage their digital footprint on insurance platforms.
Opt-In for Telematics Trial Periods: Many insurers offer immediate 15% discounts just for installing their driving app; let it track safe habits for 30 days to lock in permanent savings.
Scrub Unverified Public Records: Ensure your motor vehicle report is free of clerical errors that AI risk models misinterpret as reckless behavior.
Compare AI Aggregators: Use platforms that integrate multi-carrier API feeds rather than single-brand comparison sites to find the best risk-adjusted rate.
“Industry Note: AI-driven pricing rewards transparency and precision. Drivers who actively manage their telematics data consistently out-save those relying on legacy quote calculators.”
Embracing AI comparison tools allows savvy policyholders to customize coverage limits precisely to their driving habits, eliminating wasted premium spend while ensuring robust protection.
Discover more from The Economy
Subscribe to get the latest posts sent to your email.

Q3 2026 Earnings Preview: Can Record Profit Expectations Keep Wall Street’s Rally Alive?

Russia Diesel Deal 2026: Oil Prices and Inflation Risks

Fed Rates 2026: Treasury Yields, Bonds and SGOV Explained

S&P 500 Market Breadth 2026: Weak Rally or Rotation?

The AI Capex Boom: Data Centers Reshaping Growth

Palantir Stock in 2026: Extraordinary AI Growth

Tesla Physical AI 2026: Robotaxis, Optimus and TSLA Risks

NVIDIA’s AI Grip in 2026: Record Revenue Is Only Half the Investment Story

Hormuz Diesel Shortage: Why Crude Oil Recovery Isn’t Enough

Social Security Extra $90 Deposit: Who Qualifies for the October 2026 Medicare Rebate?

Anthropic Bans Sustained Abuse of Claude AI Under New Usage Policy Effective November 12, 2026

Jeff Bezos Three-Day Workweek View: What He Really Said

Celeste Frozen Pizza Discontinued: What Conagra Confirmed

US–China Critical Minerals Competition: Why a Trade Deal Cannot Fix Every Supply Risk

Oil Prices Break $100 in 2026: Middle East Conflict & Energy Markets

Middle East War Economics 2026: Oil Prices & Energy Markets

China Stocks Today: Are Big Economies in Asia Nearing a Market Bottom?

PSX Forecast 2026: KSE-100, IMF Reviews & Geopolitics

Crypto Daily Outlook: Bitcoin, Altcoins, and the Future of Decentralized Finance

Global Pension Systems Ranked: The World’s Best and Worst Retirement Frameworks

World’s Largest Economies: Ranking the Top Global Powers

Elon Musk’s Next Moves: Disrupting the 2026 Global Economy

Pakistan Economy 2026: Inside the SBP’s Balancing Act

GasBuddy Market Insights: How Crude Price Shifts Impact Local Fuel Cost Averages

World Bank & IMF Reports 2026: Why the “3% Growth” Consensus Is Actually a Debate

Global Equity Market Divergence: US Tech vs. European Dividend Stocks vs. Asian Growth

IMF & World Bank Global Economic Outlook: Growth Forecasts Across Europe and Asia

Stock Market Today: Dow Climbs 500 Points as Markets Shake Off Inflation Jitters
-

 Markets & Finance9 months ago
Top 15 Stocks for Investment in 2026 in PSX: Your Complete Guide to Pakistan’s Best Investment Opportunities
-

 Analysis8 months ago
Johor’s Investment Boom: The Hidden Costs Behind Malaysia’s Most Ambitious Economic Surge
-

 Analysis8 months ago
Top 10 Stocks for Investment in PSX for Quick Returns in 2026
-

 Banks9 months ago
Best Investments in Pakistan 2026: Top 10 Low-Price Shares and Long-Term Picks for the PSX
-

 Analysis8 months ago
Brazil’s Rare Earth Race: US, EU, and China Compete for Critical Minerals as Tensions Rise
-

 Investment9 months ago
Top 10 Mutual Fund Managers in Pakistan for Investment in 2026: A Comprehensive Guide for Optimal Returns
-

 Global Economy10 months ago
15 Most Lucrative Sectors for Investment in Pakistan: A 2025 Data-Driven Analysis
-

 Global Economy10 months ago
Pakistan’s Export Goldmine: 10 Game-Changing Markets Where Pakistani Businesses Are Winning Big in 2025