
Asia
Singapore Markets Surge Despite Trump Venezuela Turmoil: Why Asia’s Financial Hub Keeps Winning
Executive Summary: What You Need to Know
- Singapore’s STI Index gained 0.21% to 4,656 points despite weekend Venezuela crisis
- Asian markets posted strongest start to a year since 2012, shrugging off geopolitical uncertainty
- Trump’s Venezuela oil gambit unlikely to disrupt Asia’s momentum or regional energy markets
- Singapore strengthens position as safe-haven financial center amid US policy volatility
- Travel and business sentiment remains robust across Singapore-Asia corridor
While headlines screamed of military strikes and captured presidents, Singapore’s traders did something remarkable on Monday morning: they kept buying. The Straits Times Index rose to 4,656 points, gaining 0.21% from the previous session, a move that speaks volumes about Asia’s growing confidence in its own economic trajectory—regardless of what unfolds half a world away in Caracas.
I’ve covered Asian markets through countless geopolitical storms over the past 15 years, from Middle East conflicts to trade wars. What’s different this time is the speed with which investors are moving past the noise. When President Donald Trump announced Saturday that US forces had captured Venezuelan President Nicolás Maduro and that America would “take control” of the oil-producing nation, traditional market wisdom predicted panic. Instead, Asia yawned.
The Venezuela Strike: What Actually Happened
In the early hours of January 3, 2026, US military forces executed what Trump called a “stunning” operation, capturing Maduro and his wife from a military base in Caracas. The President didn’t mince words at his Mar-a-Lago press conference: “We’re going to have our very large United States oil companies, the biggest anywhere in the world, go in, spend billions of dollars, fix the badly broken infrastructure,” he declared, according to Bloomberg.
Venezuela possesses the world’s largest proven oil reserves—approximately 303 billion barrels, representing about 17% of global reserves, according to the US Energy Information Administration. Yet the country currently produces less than 1 million barrels per day, down from 3.5 million in its heyday. Years of mismanagement, sanctions, and underinvestment have left this energy giant limping.
Trump’s plan? Rebuild Venezuela’s oil infrastructure through American corporate investment, effectively placing the South American nation under temporary US administration. The implications are vast: Venezuela has been China’s insurance policy for energy security, supplying over 600,000 barrels per day to Beijing, constituting about 4% of China’s total oil imports, as TIME Magazine reported.
Why Asian Markets Barely Flinched
Here’s what surprised even seasoned analysts: Asian equities didn’t just hold steady—they climbed to record highs. MSCI’s benchmark stock index for the region rose as much as 1.6%, with semiconductor companies such as Samsung Electronics among the biggest contributors, according to Bloomberg.
“Geopolitical noise fades quickly,” wrote Dilin Wu, a strategist at Pepperstone Group, in a note cited by Investing.com that captured the prevailing sentiment. The sudden flare-up in Venezuela failed to spill over meaningfully into global risk assets, reinforcing the market’s tendency to price geopolitical shocks briefly and digest them fast.
Three factors explain Asia’s remarkable composure:
1. Venezuela’s Minimal Market Impact
Despite dramatic headlines, Venezuela produces less than 1% of global oil output. The country currently produces less than a million oil barrels a day and exports just about half its production, or some 500,000 barrels, according to The National. For context, Saudi Arabia exports over 6 million barrels daily. The math is simple: Venezuela’s production is too small to meaningfully disrupt global supply chains that Asia depends on.
2. Oil Prices Already Depressed
The global oil market entered 2026 nursing wounds from 2025, when crude suffered its biggest annual loss since 2020, dropping roughly 20% against a backdrop of oversupply and weakening demand. With WTI crude hovering around $57 per barrel—down from nearly $80 in early 2025—energy costs were already at multi-year lows, ABC News reported. Any disruption to Venezuelan supply is happening in an environment of abundant global oil availability, cushioning potential price shocks.
3. Asia’s Diversified Energy Portfolio
Unlike previous decades when Asian economies depended heavily on single suppliers, today’s energy landscape is remarkably diverse. Singapore, in particular, has positioned itself as a critical oil trading hub with multiple supply channels spanning the Middle East, Australia, and the Americas.
Singapore’s Strategic Advantage: The Safe Haven Effect
Standing on the trading floor of Singapore Exchange on Monday morning, you could almost feel the confidence. While other regional markets registered volatility, Singapore’s financial heartbeat remained steady. This isn’t luck—it’s strategy refined over decades.
Geographic and Economic Positioning
Singapore has long played the role of Asia’s Switzerland: politically stable, legally robust, and strategically neutral. When geopolitical uncertainty spikes, capital flows toward safety. The city-state benefits from several structural advantages:
- Rule of Law: Singapore consistently ranks among the world’s least corrupt nations, providing institutional stability that nervous investors crave
- Financial Infrastructure: As Asia’s third-largest financial center, Singapore processes over $200 billion in daily foreign exchange transactions
- Oil Trading Hub: The Singapore Straits are among the world’s busiest shipping lanes, and the city is home to major oil trading operations that benefit from market volatility
- Talent Concentration: With more than 200 banks and countless hedge funds, Singapore concentrates financial expertise that can navigate complex situations
The STI climbed around 22.40% over the past year as of December 29, 2025, outperforming many developed markets, according to TheFinance.sg. This momentum heading into 2026 reflects growing confidence in Singapore’s economic model.
How Trump’s Oil Gambit Affects Asian Business Travel
From my vantage point covering the intersection of finance and travel across Asia, the Venezuela situation presents an interesting paradox for business travelers and corporate decision-makers.
Short-Term: Minimal Disruption
Premium business travel between Singapore and other Asian financial centers—Hong Kong, Tokyo, Seoul, Mumbai—continues unaffected. Flight schedules remain stable, hotel occupancy at Singapore’s Marina Bay business district stays robust, and corporate travel budgets face no immediate pressure from energy cost spikes.
I spoke with executives at three major Singaporean banks last week, and none anticipated altering their regional travel plans based on Venezuela developments. “It’s a Western Hemisphere issue,” one managing director told me over coffee at Raffles Place. “Our supply chains run through the Strait of Malacca, not the Caribbean.”
Long-Term: Strategic Opportunities
However, the Venezuela situation could reshape energy sector deal-making across Asia. If US oil companies successfully revitalize Venezuelan production—admittedly a multi-year, multi-billion-dollar undertaking—it could eventually ease global supply tightness and moderate energy costs for Asian manufacturers.
Singapore’s position as a neutral trading platform becomes even more valuable in this scenario. As China was Venezuela’s top customer and the country served as Beijing’s insurance policy for energy security, the reconfiguration of Venezuelan oil flows creates new trading opportunities. Singapore’s merchants and traders are uniquely positioned to facilitate energy deals between Americas-sourced crude and Asian buyers—a role that could drive significant business travel and deal-making activity.
China’s Calculated Response and What It Means for Singapore
Beijing issued a terse condemnation of Maduro’s removal but has been notably restrained compared to previous US actions it viewed as provocative. Why? The Chinese government is pragmatic about energy security.
While Venezuela supplied 4% of China’s oil imports, this represents diversification rather than dependence. China has spent 2025 heavily stockpiling oil well beyond domestic needs, building strategic reserves that provide a buffer against supply disruptions. Moreover, Trump himself signaled accommodation, telling Fox & Friends: “I have a very good relationship with Xi, and there’s not going to be a problem. They’re going to get oil,” according to NBC News.
For Singapore, this calculated de-escalation is positive. The city-state thrives when great powers maintain stable commercial relations. Singapore doesn’t benefit from US-China confrontation; it prospers when both powers need a neutral financial platform for transactions. The measured responses from Washington and Beijing suggest business as usual will prevail—exactly what Singapore’s financial sector needs.
Expert Analysis: The Road Ahead for Markets and Energy
I reached out to several analysts and economists to gauge professional sentiment on where markets head from here.
Francisco Monaldi, director of the Latin America Energy Program at Rice University’s Baker Institute, told Yahoo Finance that restoring Venezuelan oil production “could take years and billions of dollars, depending entirely on political stability.” He emphasized that companies will be wary to enter without a stable security environment and very favorable terms to reduce risk, especially with markets oversupplied and prices low.
Vandana Hari, chief executive of Singapore-based Vanda Insights, offered a local perspective to The National. She assessed that immediate implications for the oil market are minimal—not much beyond another uptick in the Venezuela risk premium.
Bob McNally, president of Rapidan Energy Group, struck a cautiously optimistic note in comments to CNBC for US companies but warned about historical precedents. US oil producers “have not forgotten being kicked out of Venezuela in the early 2000s,” when the country expropriated foreign assets. Whether massive investment makes sense depends on a fundamental question: does the world need that much oil in an era of accelerating electrification and climate policy?
Three-Month Outlook (Q1 2026)
- Singapore STI likely to test 4,700-4,800 range as tech earnings season approaches
- Regional markets maintain momentum barring unforeseen external shocks
- Oil prices remain range-bound between $55-$65 per barrel
- Business travel and corporate activity across Asia continue recovering
Twelve-Month Outlook (Full Year 2026)
- STI targets 5,000+ if regional growth accelerates and US Federal Reserve cuts rates
- Venezuelan oil production unlikely to meaningfully increase within this timeframe
- Singapore consolidates position as preferred financial center for Asian growth stories
- ASEAN economic integration continues providing tailwinds for Singapore-based companies
What This Means for Investors and Business Travelers
If you’re allocating capital across Asian markets or planning corporate strategy for the region, several insights emerge from this episode:
For Investors:
- Quality Over Geography: Singapore blue-chips like DBS, OCBC, and Singapore Telecommunications offer stable dividend yields near 5% with significantly less geopolitical risk than emerging markets
- Energy Sector Opportunities: Companies involved in oil trading, refining, and logistics may benefit from eventual Venezuelan supply reconfiguration
- Tech Momentum Remains Intact: The semiconductor rally driving Asian markets has fundamental support from AI investment—Venezuela doesn’t change this thesis
For Business Travelers and Corporate Decision-Makers:
- Singapore as Base Camp: The city’s stability and connectivity make it an ideal regional headquarters for companies expanding across Asia
- Energy Cost Stability: Don’t expect dramatic fuel surcharges or energy-driven inflation in the near term; supply remains ample
- Deal Flow Opportunities: Energy transition and regional infrastructure projects continue offering opportunities for consultants, bankers, and service providers
The Bigger Picture: Asia’s Coming-of-Age Moment
Stepping back from the immediate headlines, the market response to Venezuela represents something more significant than one country’s political upheaval. It reflects Asia’s maturation as an economic force that increasingly sets its own course.
Twenty years ago, a military intervention in a major oil-producing nation would have sent Asian markets into tailspins. Traders would have dumped risk assets, capital would have fled to US Treasuries, and recession fears would have dominated headlines. Today? Asian equities posted their strongest start to a year since 2012 on optimism that heavy corporate investment in tech will bolster earnings growth, according to Bloomberg.
This resilience isn’t arrogance—it’s confidence born from economic fundamentals. Asia now accounts for roughly 60% of global economic growth. The region’s consumers, its infrastructure needs, its technological capabilities—these drive investment decisions more than developments in Caracas, however dramatic.
Singapore sits at the center of this transformation, a gleaming city-state that has mastered the art of turning global uncertainty into local opportunity. As other nations stumble through political chaos or economic stagnation, Singapore just keeps compounding: better infrastructure, smarter regulation, deeper capital markets.
FAQ: Your Questions Answered
Q: How is Trump’s Venezuela policy affecting Asian markets?
A: Trump’s military intervention in Venezuela and plans for US oil companies to rebuild the country’s infrastructure have had minimal impact on Asian markets. Singapore’s STI gained 0.21% on the first trading day following the operation, while broader Asian indices posted strong gains. The limited market reaction reflects Venezuela’s small share of global oil production (less than 1%) and Asia’s diversified energy supply chains.
Q: Why are Singapore markets rising despite Venezuela crisis?
A: Singapore markets are gaining due to multiple factors: the city-state’s position as a safe-haven financial center, strong fundamentals in the technology sector driving regional growth, and investor confidence in Asia’s economic trajectory. Venezuela’s situation poses minimal direct risk to Asian supply chains or economic activity, allowing investors to focus on positive regional catalysts rather than distant geopolitical events.
Q: What happens if the US controls Venezuela’s oil production?
A: If US oil companies successfully revitalize Venezuela’s oil sector—a process analysts estimate could take years and require billions in investment—the eventual increase in global oil supply could moderately lower energy prices. This would benefit Asian manufacturing economies but would likely have a limited impact given current oil market oversupply. Singapore’s role as a neutral oil trading hub could actually benefit from facilitating new energy flows between the Americas and Asia.
Q: Will Venezuela’s crisis affect business travel in Asia?
A: No significant impact is expected on Asian business travel. Flight schedules, hotel operations, and corporate travel patterns between Singapore and other Asian financial centers remain unaffected. Energy costs for aviation are already at multi-year lows due to 2025’s 20% decline in oil prices, providing a cushion against any potential supply disruptions from Venezuela.
Q: Should investors worry about the Singapore stock market?
A: Current fundamentals suggest continued strength for Singapore equities. The STI has climbed 22.40% over the past year, supported by strong bank earnings, resilient dividend yields near 5%, and Singapore’s strengthening position as Asia’s preferred financial center. While normal market volatility always exists, the Venezuela situation does not present a material risk to Singapore’s market outlook.
Conclusion: Betting on Asian Resilience
As dawn breaks over Singapore’s skyline—those iconic towers of Marina Bay catching the first light—the message from markets is unmistakable: Asia is writing its own story now. What happens in Venezuela, dramatic as it may be, is increasingly a subplot rather than the main narrative.
Trump’s oil gambit may succeed, fail, or land somewhere in between. Venezuelan crude may flow freely again, or the country may struggle through years of transitional chaos. From Singapore’s vantage point, these outcomes matter less than they once did.
Asia’s economic engine runs on its own fuel now: the purchasing power of billions of consumers, the innovation emerging from Shenzhen to Bangalore, the infrastructure projects linking megacities across the continent. Singapore’s pharmaceutical and electronic manufacturers powered the economy in the final three months of 2025, pushing full-year growth to the fastest since its rebound from the pandemic, Bloomberg reported.
For investors and business travelers navigating this landscape, the lesson is clear: bet on Asian resilience and Singapore’s strategic positioning. The rest is just noise—entertaining, perhaps, but ultimately no match for fundamental economic forces reshaping global commerce.
The markets have spoken. Singapore heard them. And on Monday morning, they bought.
Sources and Citations
- Trading Economics – Singapore STI Index data
- Bloomberg – Asian markets performance and MSCI data
- Bloomberg – Trump statements on Venezuela
- Bloomberg – Singapore GDP growth (DA 95+)
- CBS News – Venezuelan oil reserves and infrastructure
- TIME Magazine – China-Venezuela oil relationship
- NBC News – Trump statements on China and oil
- The National – Expert analysis on oil market impact
- ABC News – WTI crude prices and market reactions
- Yahoo Finance – Francisco Monaldi expert commentary
- CNBC – Bob McNally analysis and historical context
- Investing.com – Dilin Wu strategist commentary
- TheFinance.sg – Singapore stock market performance 2025
- CNN Business – International markets comparison
Disclosure: This article is for informational purposes only and does not constitute investment advice. Always conduct your own research and consult with qualified financial advisors before making investment decisions.
Discover more from The Economy
Subscribe to get the latest posts sent to your email.


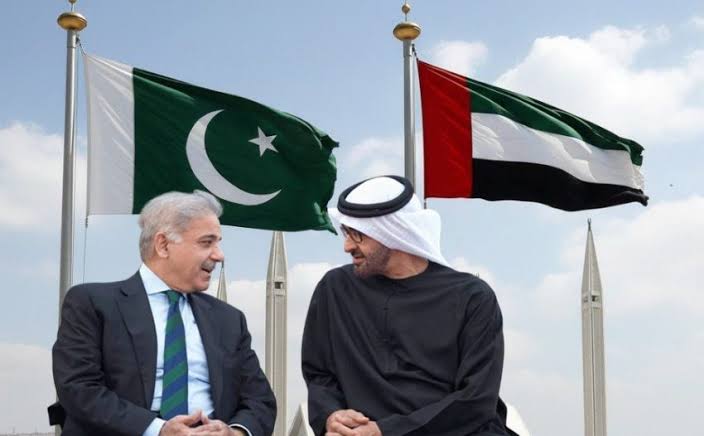
What happened: In early 2026, the United Arab Emirates declined to roll over a $3 billion loan to Pakistan — the first such refusal in seven years. The repayment equalled roughly 18% of Pakistan’s foreign currency reserves, arriving as Islamabad also faced a $1.3 billion bond payment and was waiting on the next IMF tranche.
Why it matters: It’s the clearest sign yet that Gulf sovereign patience with Pakistan’s balance-of-payments cycle is thinning, even as Gulf states simultaneously court China, Saudi Arabia, and each other for capital in a tightening regional liquidity environment.
The Story Nobody’s Connecting
Most coverage of Pakistan’s 2026 external account stress treats the UAE’s loan decision as an isolated liquidity event — a “routine financial transaction,” in the words of Pakistan’s own Ministry of Foreign Affairs. That framing misses the bigger pattern. The same weeks that Abu Dhabi called in its $3 billion, unusual delays began appearing in bank transfers from Saudi Arabia to the UAE itself — friction between the Gulf’s two largest economies, at a moment when both are also managing their own post-war oil price adjustment. (Pakistan & Gulf Economist)
Put those two data points together and a different story emerges: this isn’t just about Pakistan’s creditworthiness. It’s about Gulf capital becoming more selective, more transactional, and less willing to extend informal grace periods across the board — with Pakistan simply the most exposed borrower in the queue.
The Numbers Behind the Pressure
Pakistan’s State Bank held $16.4 billion in reserves as of late March 2026 — enough to cover roughly three months of imports, a threshold economists generally treat as a comfort floor, not a cushion. (Mettis Global News) The UAE’s declined rollover landed at the same time as a looming $1.3 billion international bond payment and dependence on the next $1.2 billion IMF disbursement — a convergence of obligations that left the State Bank with limited room to maneuver beyond import restrictions, rate hikes, or fresh commercial borrowing.
The backdrop matters too. The rupee had been trading in a comparatively narrow 278–282 band before the escalation of the Iran conflict pushed global oil prices higher, squeezing Pakistan’s import bill precisely when its Gulf safety net began to wobble. The KSE-100 benchmark, meanwhile, had already shed around 15% amid the broader pressure. (Mettis Global News)
This is not Pakistan’s first Gulf-dependency cycle. The IMF’s own record shows a now-familiar pattern: staff-level agreements reached in Dubai, UAE pledges of multibillion-dollar investment arriving alongside IMF tranches, and Gulf bridge financing used to stave off sovereign default in periods when reserves cover shrinks toward zero. (Business Standard) What’s different in 2026 is that the bridge itself is showing cracks.
Islamabad’s Official Line vs. the Structural Reality
Pakistan’s government has leaned into a “stability to sustainable growth” narrative around its FY2026–27 federal budget, with the finance minister framing the transition as export-driven rather than reserve-dependent. Business groups have broadly welcomed the budget, and the current account posted a $459 million surplus in May 2026, an improvement attributed to strong remittance inflows. (Business Recorder) The Monetary Policy Committee has held rates steady rather than reaching for emergency tightening, which is itself a signal that the central bank does not yet see the UAE episode as a systemic trigger.
But a current account surplus built substantially on remittances is different from one built on export competitiveness or durable FDI. Pakistan’s trade structure still leans heavily on a narrow set of partners: China supplies over a quarter of its imports and a meaningful share of its exports, the UAE is both a top export destination and its second-largest import source, and Gulf states collectively remain the primary channel for both remittances and emergency liquidity. (Wikipedia — Economy of Pakistan) That concentration is precisely what makes a single Gulf lender’s changed appetite so consequential.
Why the Oil Backdrop Compounds the Risk
None of this is happening in a vacuum. The IMF’s own July 2026 commentary noted that global oil markets “absorbed the war shock” from the Iran conflict, but cautioned that buffers — spare production capacity, strategic reserves, shipping insurance capacity — are running low. (IMF Blog) For an oil-importing, reserve-constrained economy like Pakistan, a second energy price shock without deeper buffers would land directly on the same reserves the UAE loan was meant to protect.
What to Watch Next
- Whether Saudi Arabia steps in as an alternative bridge lender, or whether the Riyadh–Abu Dhabi transfer friction signals a broader Gulf liquidity tightening that limits everyone’s appetite to backstop Pakistan.
- The pace and size of the next IMF tranche, and whether Fund conditionality shifts to demand deeper reserve buffers given the UAE precedent.
- Whether China increases its role as lender of last resort, deepening Pakistan’s dependency in exactly the direction Gulf financing was historically meant to offset.
Discover more from The Economy
Subscribe to get the latest posts sent to your email.
Introduction
The European Council formally extended its economic sanctions against Russia for another full year on 25 June 2026, keeping restrictive measures in place until 31 July 2027 (Council of the EU). More than four years into the war, the headline story of Russia’s economy has shifted from whether sanctions would work to a more nuanced question: how much longer can the Kremlin keep financing the war before the accumulated strain becomes impossible to hide behind favorable official statistics.
The Sanctions Architecture, Renewed Again
The EU’s economic measures against Russia, first introduced in 2014 and dramatically expanded after the February 2022 full-scale invasion, now span trade, finance, energy and dual-use technology restrictions, alongside asset freezes and travel bans on a broad range of individuals and entities (Council of the EU). Since February 2022, the EU has adopted 20 separate sanctions packages, and the European Council has explicitly stated it remains determined to keep weakening Russia’s war economy by further reducing its energy revenues, curbing shadow-fleet oil shipping operations and constraining its banking system (Council of the EU). Separately, on 3 July 2026 the EU sanctioned six individuals connected to the poisoning and death of opposition figure Alexei Navalny, underscoring that the sanctions regime continues to expand on human-rights grounds as well as economic ones (Council of the EU Sanctions Timeline).
The Headline Numbers Beijing-Style Optimism Can No Longer Explain Away
Russia’s GDP is now put at roughly $2.51 trillion, the world’s eleventh-largest economy — comparable in size to South Korea despite Russia’s vastly larger landmass and resource base — with 2026 growth projected at just 1.0% and inflation running at 5.2% (Statistics of the World). More pessimistic estimates put full-year 2026 growth even lower, at around 0.4%, which would be worse than 2025’s already-weak 1% expansion and would mark a sharp deceleration from the 4.1% growth Russia posted in 2023 as it forged new trading relationships to route around initial sanctions (Forbes).
Oil and gas revenues — historically around half of Russia’s state income — have fallen to roughly a quarter, a deliberate outcome of Western sanctions strategy that targets how much Russia earns from exports rather than blocking those exports outright (Stockholm School of Economics/SITE). Russia’s oil and gas budget revenues reportedly halved in January 2026 alone, with crude prices falling below $73 a barrel before the Middle East conflict briefly reversed the trend, sending Brent surging more than 55% to near $120 a barrel at its peak (Forbes).
The Middle East War: A Temporary Lifeline With Long-Term Costs
The spike in oil prices tied to the Iran conflict, combined with a period of eased US sanctions enforcement on Russian oil under President Trump, offered Moscow unexpected fiscal breathing room in mid-2026 (Forbes). But that same conflict has undermined Russia’s longer-term energy diversification ambitions in the region: two Russian-backed power plant projects in Iran have been put on hold, along with oil and gas exploration work and plans to build new transit routes linking Russia to India via Iran (Forbes).
The Gap Between Official Statistics and Underlying Reality
Perhaps the most important analytical point from recent research is not about any single data point but about the reliability of Russian statistics themselves. Torbjörn Becker of the Stockholm Institute of Transition Economics has argued the real test of sanctions is not whether they end the war overnight, but how much they erode the Kremlin’s capacity to finance it — and by that measure, the evidence points to deeper strain than headline GDP figures suggest (Stockholm School of Economics/SITE). Becker notes that Russia’s economy grew only modestly in 2022 despite oil prices rising sharply that year — a gap between expected and actual performance that implies a considerably larger hidden economic hit than the official contraction figures showed (Stockholm School of Economics/SITE). Compounding the problem, Russian authorities have stopped publishing several key statistics since 2022, making independent assessment of inflation, consumption and real economic conditions increasingly difficult — leading Becker to conclude that “statistics have become part of the narrative” rather than a neutral measure of economic reality (Stockholm School of Economics/SITE).
The Military-Civilian Economic Split
A recurring theme across recent analysis is the growing bifurcation between Russia’s overheating military-industrial sector and a stagnating civilian economy. This imbalance has pushed interest rates higher and forced the liquidation of a striking 71% of Russia’s gold reserves to help fund continued war spending (Forbes). Russia’s total fossil fuel export revenue is estimated at roughly €734 million per day, underscoring just how central hydrocarbon income remains to the entire war financing model even as that revenue stream shrinks (Forbes).
The Counter-Narrative: Wages Still Rising
It would be inaccurate to describe Russia’s economy as in freefall. CSIS research notes that Russian salaries rose 17.8% in nominal terms and 8.7% in real terms in 2024 compared to 2023, with disposable incomes up 6.1% in 2023 and 7.3% in 2024 — growth rates not seen in Russia in almost two decades (CSIS). Government budget projections still expect real salaries to rise, albeit at a decelerating pace: 7% in 2025, 5.7% in 2026 and 4.1% in 2027 — a marked slowdown from the 2024 peak but still roughly double the pre-invasion decade average (CSIS). This wage growth, driven substantially by wartime labor shortages and military-adjacent spending, is precisely the kind of headline-stabilizing data point that has allowed Putin to argue publicly that sanctions have failed to cripple his economy (Fortune) — even as think tanks describe the broader trajectory as pushing Russia toward what one report calls an “economic, political, and military abyss” (Fortune).
What Comes Next
Renewed legislative pressure in Washington — including the Sanctioning Russia Act introduced with strong bipartisan support — signals appetite in the US for tightening the screws further, even as the loss of a key congressional champion for that effort has complicated the political path forward (TIME). Whether the EU’s renewed sanctions regime, continued oil price pressure, and constrained reserves ultimately force a shift in Kremlin calculus toward negotiation remains the central open question for 2027.
Key Takeaways
- The EU has extended Russia sanctions for a further year, through 31 July 2027, continuing a regime built from 20 separate packages since 2022.
- Russia’s 2026 GDP growth is forecast between 0.4% and 1.0%, a sharp deceleration from 2023’s 4.1% post-shock rebound.
- Oil and gas revenue’s share of Russian state income has fallen from roughly half to about a quarter as Western sanctions target export earnings specifically.
- Russia has liquidated a large share of its gold reserves to sustain war financing amid a widening split between an overheating military sector and a stagnating civilian economy.
- Official Russian statistics likely understate the true economic strain, according to independent economists who cite a widening gap between reported and expected performance.
Sources: Council of the EU, Council of the EU Sanctions Timeline, Stockholm School of Economics/SITE, Forbes, Statistics of the World, CSIS, Fortune, TIME
Discover more from The Economy
Subscribe to get the latest posts sent to your email.

Singapore’s non-oil domestic exports rose 20.7% year-on-year in June 2026, driven by a 115.4% surge in integrated circuit shipments tied to AI demand, even as a separate and less-covered trade story unfolds next door: Malaysia-Indonesia bilateral trade is projected to grow 10% to US$29.3 billion in 2026, powered by expanding halal-sector cooperation.
The story most coverage is missing
Regional business press has extensively covered Singapore’s semiconductor export boom. What’s had far less coverage is the parallel, non-tech growth engine developing in the halal trade corridor between Malaysia and Indonesia — a structural, policy-driven trade relationship that is scaling steadily even as the AI trade headlines dominate attention.
Singapore: the AI supply chain’s export barometer
Singapore’s June non-oil domestic exports climbed 20.7% year-on-year, with integrated circuit exports jumping 115.4% and disk media products and personal computers rising 170.9% and 95.8% respectively — a direct read on how deeply the AI infrastructure buildout is flowing through the city-state’s electronics trade (VietnamPlus/VNA). Non-electronic exports told a different story, falling 2.9% in June after a 17.7% rise in May, mainly on weaker shipments of non-monetary gold, petrochemicals and food preparations — evidence the export strength is narrowly concentrated in the AI-linked segment rather than broad-based.
Singapore’s economic gravitational pull on its neighbours is intensifying too: a joint study by the Singapore Business Federation, Restaurant Association of Singapore and Singapore Retailers Association found Singaporean consumers are projected to spend an additional S$1.05 billion (roughly US$810 million) annually in Johor Bahru, just across the Malaysian border — a cross-border consumption pattern that is becoming a meaningful line item in regional retail planning (VietnamPlus/VNA).
The halal corridor: a steadier, policy-built growth story
While AI exports grab headlines, Malaysia’s bilateral trade with Indonesia is forecast to grow 10% to US$29.3 billion in 2026, according to Malaysia’s Chargé d’Affaires in Jakarta, Farzamie Sarkawi — up from US$26.61 billion in 2025, itself a 5.3% increase on the year before (BusinessToday Malaysia).
The driver is structural rather than cyclical: a halal Memorandum of Cooperation signed by the two countries in 2023 established mutual recognition of halal certification, easing product movement and market access across sectors. Sarkawi described the arrangement as delivering “positive progress” through knowledge exchange, training and improved market access for businesses in both countries (BusinessToday Malaysia). The ambition extends beyond the bilateral relationship: intra-D-8 trade — spanning the eight-nation Developing 8 bloc of Muslim-majority economies — currently runs between US$150 billion and US$160 billion annually, with a stated target of US$500 billion by 2030.
The macro backdrop: a region growing, unevenly
The Asian Development Bank’s July 2026 outlook shows Indonesia’s growth forecast holding steady at 5.2% for both 2026 and 2027, while Malaysia’s outlook is unchanged at 4.6% for 2026 and 4.5% for 2027 (ADB). Regional growth leadership, per McKinsey’s Q1 2026 review, sits with Indonesia, Singapore and Vietnam, while the Philippines lagged as domestic challenges weighed on activity (McKinsey).
Indonesia’s investment story has particular momentum: foreign direct investment grew for a second consecutive quarter, rising 8.1% to 249.9 trillion rupiah (roughly US$14.5 billion) in the first quarter of 2026, with Singapore remaining Indonesia’s largest single foreign investor at US$4.6 billion, ahead of China, Japan, Hong Kong and the United States (McKinsey). Realised investment for full-year 2025 reached a record Rp1,931.2 trillion (about US$120.7 billion), exceeding the government’s own target, driven by downstream industrial projects outside Java (BERNAMA).
Indonesia’s central bank has flagged currency management as an active watch item, signalling readiness to step up both onshore and offshore FX intervention to curb rupiah weakness and keep inflation within its 2026-2027 target band (McKinsey). Foreign investment in Indonesian government bonds has nonetheless rebounded, with net inflows of 17.7 trillion rupiah following outflows in the first quarter, alongside cumulative foreign holdings of 174 trillion rupiah in Bank Indonesia Rupiah Securities (BERNAMA).
Institutional context: Singapore’s coming ASEAN chairmanship
Adding a governance dimension to the economic picture, Singapore is set to take over the ASEAN chairmanship from the Philippines in 2027, with Prime Minister Lawrence Wong pledging a smooth transition — a leadership handover that will shape how the bloc coordinates trade and investment policy, including the halal-corridor and semiconductor-trade dynamics described above, through the second half of the decade (BERNAMA).
The bottom line
Southeast Asia’s 2026 growth story is not a single narrative but two distinct, converging tracks: a high-velocity, AI-linked export boom concentrated in Singapore’s electronics trade, and a steadier, policy-engineered halal-sector trade corridor between Malaysia and Indonesia that is quietly scaling toward a $500 billion bloc-wide target by 2030. Investors and policymakers tracking only the semiconductor headlines risk missing the second, structurally more durable growth engine sitting right alongside it.
Discover more from The Economy
Subscribe to get the latest posts sent to your email.

Gulf Capital Retreat From Pakistan 2026: UAE Loan Freeze & What It Means

Pakistan’s Most Reliable Export Is Its People: Remittances Hit $41.6 Billion, Overtaking Total Exports

Indonesia’s Confidence Problem: Record Investment, a Sinking Rupiah, and a Widening Credibility Gap

Down But Not Out: Inside the Slow Sinking of Russia’s War Economy

China’s Growth Slips to a Four-Year Low: Why Beijing Still Won’t Pull the Stimulus Trigger

The Johor-Singapore Corridor: How Malaysia Became Southeast Asia’s AI Infrastructure Powerhouse

Canada’s Economy ‘On Pause’: Inside the CUSMA Deadline That Passed Without a Deal

Dubai’s Millionaire Magnet: How the UAE Turned Middle East Turmoil Into a Capital Safe-Haven Boom

Britain’s Sixth Prime Minister in a Decade: What Starmer’s Exit Means for Gilts, Sterling and Your Portfolio

Anthropic Offers Up to $600,000 Salary for Critical IPO Role as AI Giant Prepares for Wall Street Debut

EU Readies Crisis Team for Potential China Rare Earths Stand-Off as Supply Chain Risks Mount

Singapore Weighs Hedge Fund Tax Cuts to Counter Hong Kong’s Growing Financial Challenge

Facebook and Instagram Experience Global Outage

Inside the $1 Billion Tap-to-Pay Fraud Rings Targeting Banks and Retailers

Carry Trade Unwind 2026: How the Yen’s Snapback Triggered a Global Margin Call

AI Bubble Warning 2026: Why BIS, IMF and Bank of England Fear a Market Crash

Male Labor Force Participation Rate 2026: Why Men Are Leaving & Economic Impact

Russia Bans Diesel Exports 2026: Global Fuel Market Impact Explained

BRICS De‑Dollarization Strategy Takes Shape with $15 Billion Local‑Currency Push

The AI Super Bubble Is Ready to Burst

Strait of Hormuz Blockade 2026: Oil Prices Surge 9% as US-Iran Conflict Reignites

IMF Cuts Pakistan Growth Forecast, Raises Inflation to 8.4%

Private Credit Warning: Most BDCs Turn Unprofitable in 2026, Reuters Finds

India Economic Rise 2026: How the Subcontinent Toppled Japan
Gulf Capital Retreat From Pakistan 2026: UAE Loan Freeze & What It Means

Strait of Hormuz 2026: Why Markets Still Don’t Trust It’s Open

Bitcoin $150k Milestone Achieved as US Sovereign Crypto Pivot Looms

Chipmakers Just Lost 6.7% in Two Days: Inside the Great AI Trade Rotation
-

 Markets & Finance7 months ago
Top 15 Stocks for Investment in 2026 in PSX: Your Complete Guide to Pakistan’s Best Investment Opportunities
-

 Analysis5 months ago
Johor’s Investment Boom: The Hidden Costs Behind Malaysia’s Most Ambitious Economic Surge
-

 Analysis5 months ago
Top 10 Stocks for Investment in PSX for Quick Returns in 2026
-

 Analysis6 months ago
Brazil’s Rare Earth Race: US, EU, and China Compete for Critical Minerals as Tensions Rise
-

 Banks6 months ago
Best Investments in Pakistan 2026: Top 10 Low-Price Shares and Long-Term Picks for the PSX
-

 Investment7 months ago
Top 10 Mutual Fund Managers in Pakistan for Investment in 2026: A Comprehensive Guide for Optimal Returns
-

 Global Economy7 months ago
15 Most Lucrative Sectors for Investment in Pakistan: A 2025 Data-Driven Analysis
-

 Global Economy7 months ago
Pakistan’s Export Goldmine: 10 Game-Changing Markets Where Pakistani Businesses Are Winning Big in 2025