
Asia
China’s Economy in 2025: Resilience Amid Headwinds as GDP Hits 5% Target Despite Q4 Slowdown

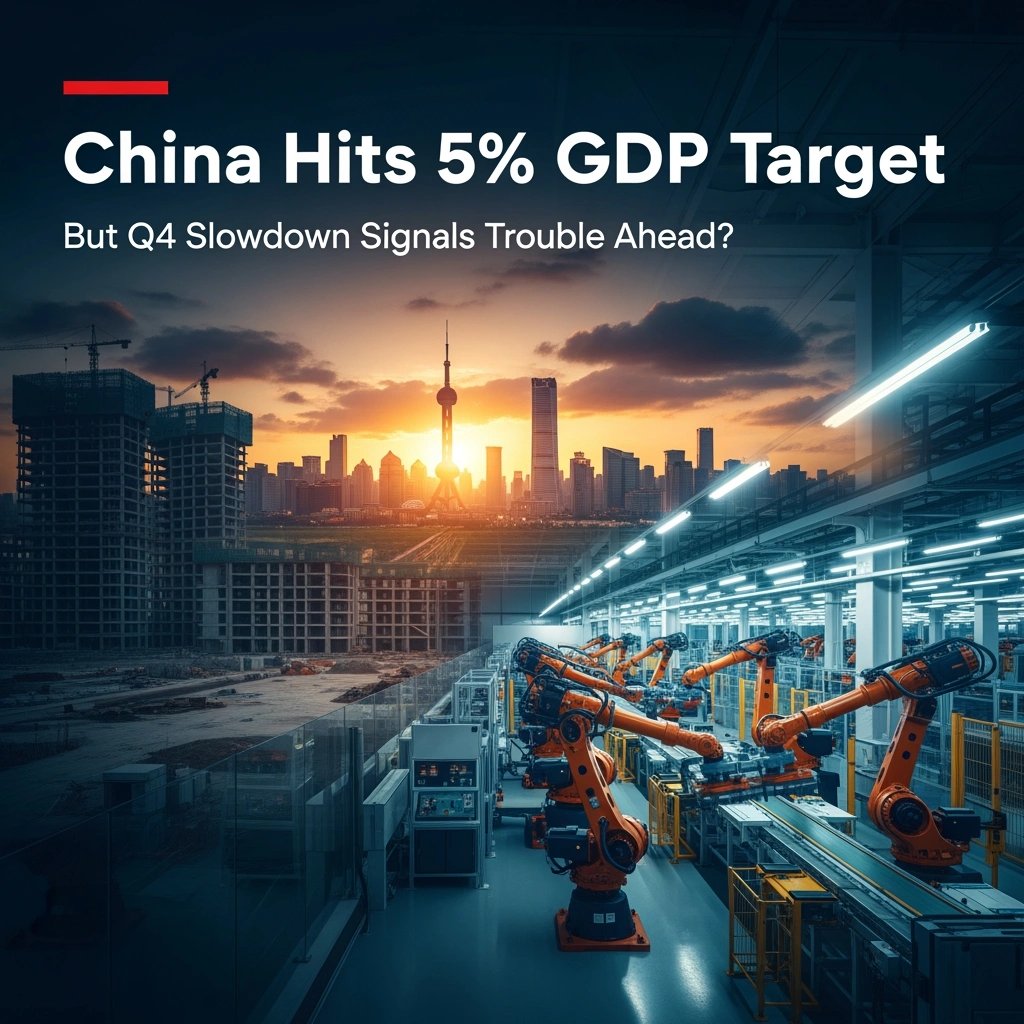
On a gray January morning in Shenzhen, the production lines at BYD’s sprawling electric vehicle plant hum with algorithmic precision—robotic arms fitting battery cells, workers in crisp uniforms monitoring quality control dashboards. Sixty kilometers north, in the dormant construction zones of Evergrande’s unfinished Guangzhou towers, cranes stand motionless against the skyline, monuments to China’s protracted property crisis. These contrasting scenes capture the dual narrative of China’s economy in 2025: a nation that met its official growth target through manufacturing resilience and export diversification, yet confronts deepening structural headwinds that cloud the path ahead.
On January 17, 2026, the National Bureau of Statistics delivered a mixed verdict on China’s economic performance. Full-year GDP growth reached 5.0% for 2025—exactly meeting Beijing’s “around 5%” target and defying earlier skepticism from global forecasters. Yet beneath this headline achievement lies a more complicated reality: fourth-quarter growth decelerated sharply to 4.5% year-on-year, down from 4.8% in Q3 and marking the slowest quarterly expansion in three years. The bifurcation between official success and underlying fragility raises fundamental questions about sustainability, policy effectiveness, and what 2026 holds for the world’s second-largest economy.
The Numbers Behind the 5% Target: Precision or Fortune?
China’s achievement of its 5% GDP growth target represents both a policy victory and a testament to the government’s willingness to deploy fiscal and monetary stimulus when needed. The 5.0% full-year figure slightly exceeded the consensus analyst forecast of 4.9% compiled by Reuters in December 2025, though the margin was razor-thin. For context, this marks a deceleration from 2024’s 5.2% growth and continues the gradual cooling trend from the 8.4% post-COVID rebound in 2021.
According to data released by the NBS, China’s nominal GDP reached approximately 135 trillion yuan ($18.5 trillion) in 2025, cementing its position as the dominant economic force in Asia despite persistent speculation about when—or whether—it will surpass the United States in absolute terms. The quarterly breakdown reveals a pattern of diminishing momentum:
- Q1 2025: 5.3% y/y
- Q2 2025: 5.1% y/y
- Q3 2025: 4.8% y/y
- Q4 2025: 4.5% y/y
This sequential deceleration underscores that China’s growth trajectory remains under pressure from structural forces that stimulus measures can only partially offset. As Bloomberg economics noted in its post-release analysis, hitting the target “required considerable policy support in the final months of the year, including accelerated infrastructure spending and interest rate cuts by the People’s Bank of China.”
The precision of landing at exactly 5.0% has inevitably sparked questions about data reliability—a perennial concern among China watchers. While most mainstream economists accept the broad directional accuracy of NBS figures, some analysts point to discrepancies between GDP growth and proxy indicators like electricity consumption and freight volumes, which showed weaker trajectories in late 2025. Nevertheless, independent estimates from institutions like the Organisation for Economic Co-operation and Development have broadly validated China’s reported growth rates when adjusted for statistical methodology differences.
Manufacturing’s Unexpected Lift: High-Tech Sectors Drive Industrial Resilience
Against expectations of broad-based weakness, China’s manufacturing sector emerged as the surprising pillar of 2025’s growth story. Industrial production expanded 5.8% for the full year, outpacing both services (5.1%) and construction (3.2%), according to NBS sectoral breakdowns. This manufacturing strength defied Western narratives of exodus and “de-risking,” instead reflecting a rapid evolution toward higher-value production.
The star performers were concentrated in advanced manufacturing and green technology:
- Electric vehicles and batteries: Production surged 32% year-on-year, with companies like BYD, CATL, and Nio capturing expanding global market share despite European and American tariff threats
- Solar panel manufacturing: Output jumped 51%, driven by both domestic installation booms and exports to emerging markets in Southeast Asia, Latin America, and the Middle East
- Semiconductor equipment: Despite US export controls, China’s domestic chip-making equipment production grew 28%, narrowing technological gaps in legacy node production
- Industrial robotics: Manufacturing of automation equipment rose 19%, supplying both domestic factories upgrading production lines and international buyers
As Caixin Global reported in December 2025, foreign direct investment in China’s high-tech manufacturing sectors actually increased 7.3% despite overall FDI declining 11.2%—suggesting that while some low-margin producers are relocating to Vietnam and Mexico, sophisticated operations requiring deep supply chains and skilled workforces continue to favor Chinese locations.
The Purchasing Managers’ Index (PMI) for manufacturing hovered around the 50.0 threshold throughout most of 2025, oscillating between contraction and modest expansion. However, the new export orders sub-index strengthened markedly in Q4, rising from 48.2 in September to 51.3 in December—the highest reading since early 2023. This improvement reflected both the ongoing diversification of export markets away from the US and Europe, and the competitive advantage Chinese manufacturers maintained through automation investments that reduced unit labor costs.
“China’s manufacturing resilience in 2025 wasn’t about volume—it was about value,” noted George Magnus, research associate at Oxford University’s China Centre, in a Financial Times interview. “The transition from ‘world’s factory’ to ‘world’s advanced factory’ is happening faster than most Western policymakers recognize, particularly in sectors like EVs, batteries, and renewable energy equipment.”
The Persistent Property Drag: A Crisis Enters Its Fourth Year
If manufacturing provided the accelerator for China’s 2025 growth, the property sector remained the brake pedal pressed firmly to the floor. Real estate investment contracted 9.8% for the full year, marking the fourth consecutive year of decline since the sector’s peak in 2021. New construction starts plummeted 21.4%, while property sales by floor area fell 15.3%, according to NBS data.
The numbers tell a story of a sector in structural decline rather than cyclical downturn. Despite unprecedented government intervention—including interest rate cuts, reduced down payment requirements, relaxed purchase restrictions in most tier-2 and tier-3 cities, and direct state purchases of unsold inventory—the property market failed to stabilize in 2025. Home prices in 70 major cities tracked by the NBS declined 4.7% on average, with steeper drops of 8–12% in smaller cities burdened by massive oversupply.
The human dimension of this crisis grew more acute. As The Economist detailed in its October 2025 cover story, millions of Chinese families remain trapped in “pre-sale purgatory”—having paid deposits for apartments whose construction stalled when developers like Evergrande, Country Garden, and Sunac defaulted. While Beijing’s “whitelist” financing program channeled approximately 4 trillion yuan to complete roughly 3.2 million stalled units, an estimated 2–3 million additional units remain frozen in legal and financial limbo.
The ripple effects extended far beyond construction sites:
- Local government finances: Property-related revenues (land sales and related taxes) comprise roughly 30% of local government income and fell another 18% in 2025, forcing municipalities to slash services and delay infrastructure projects
- Household wealth: Real estate represents approximately 60% of Chinese household assets; the sustained price decline eroded consumer confidence and discretionary spending capacity
- Financial sector stress: Non-performing loan ratios at smaller regional banks ticked upward to 2.8% as property developers, construction firms, and related businesses defaulted
- Demographic feedback loop: Collapsing property sector employment (down an estimated 6 million jobs since 2021) exacerbated youth unemployment concerns and accelerated marriage/birth rate declines
The central government’s approach evolved from crisis management to managed decline. Policymakers increasingly signal acceptance that property will not return to its former role as a growth engine. The 14th Five-Year Plan (2021-2025) targeted reducing real estate’s GDP share from roughly 25% to below 20%, and 2025 data suggests this structural shift is well underway—though the transition costs in terms of slower growth and fiscal pressure remain substantial.
“The property crisis is no longer an emergency—it’s the new normal,” commented Charlene Chu, senior analyst at Autonomous Research, to The Wall Street Journal. “The question isn’t when recovery comes, but how China rebalances its growth model away from this massive sector while avoiding a hard landing.”
Deflation Risks and Weakening Domestic Demand: The Consumption Conundrum
Perhaps the most concerning development in China’s 2025 economic performance was the persistence of deflationary pressure and anemic household consumption. The consumer price index (CPI) rose just 0.4% for the full year—barely above zero and well below the 3% target. More troublingly, the producer price index (PPI) contracted 2.2%, extending the deflation in factory-gate prices that began in late 2022.
This deflationary environment reflected overcapacity in manufacturing, weak pricing power, and—most significantly—tepid consumer demand. Retail sales grew 4.2% in nominal terms for 2025, but adjusted for inflation, real growth was only around 3.8%, the weakest since the pandemic year of 2020 (excluding lockdown months). Adjusted for China’s GDP size and growth trajectory, household consumption contributed just 3.1 percentage points to the 5% overall growth—far below the 4–5 percentage point contribution typical of developed economies.
Several factors suppressed consumer spending:
Property wealth effect: As home values declined and millions faced uncertainty about incomplete pre-purchased apartments, households curtailed spending and increased precautionary saving
Labor market anxiety: While official urban unemployment remained around 5.0%, youth unemployment (ages 16-24, excluding students) was suspended from publication in mid-2023 after hitting record highs. When resumed with revised methodology in early 2025, it showed rates around 17–18%—signaling ongoing stress for young workers
Income inequality: The GINI coefficient remained elevated above 0.46, and wage growth for median workers lagged behind GDP growth, concentrating income gains among higher earners with lower marginal propensity to consume
Cultural shift toward thrift: As CNBC reported, the “lying flat” (tangping) and “let it rot” (bailan) movements reflected deeper malaise among younger Chinese increasingly skeptical about consumption-driven status competition
The government deployed various consumption stimulus measures throughout 2025—cash subsidies for appliance and auto purchases, expanded consumer credit programs, local consumption vouchers—yet these failed to ignite sustained spending momentum. The household savings rate actually increased to approximately 35% of disposable income, suggesting families prioritized balance sheet repair over consumption.
This consumption weakness creates a vicious cycle: weak household spending constrains business revenues and employment, which further depresses income growth and confidence, feeding back into consumption restraint. Breaking this cycle requires either dramatic income redistribution (politically complex), a new source of household wealth creation to replace property (unclear where this emerges), or simply time for consumers to rebuild confidence—a process that could take years.
Trade Dynamics: Export Diversification and the Tariff Shadow
China’s external sector provided crucial support in 2025, though the picture was more nuanced than aggregate trade figures suggested. Total exports grew 5.9% in dollar terms, while imports expanded just 2.1%, resulting in a record trade surplus exceeding $1 trillion for the first time.
However, this topline performance masked significant geographical and compositional shifts. Exports to the United States—still China’s largest single-country destination—contracted 3.7% as buyers front-ran potential tariff increases and diversified supply chains. Exports to the European Union fell 1.2% amid both economic weakness in Germany and Italy and rising anti-subsidy sentiment regarding Chinese EVs and solar panels.
The export growth came almost entirely from alternative markets:
- ASEAN countries: Exports surged 14.2%, making Southeast Asia collectively China’s largest regional trading partner, driven by both intermediate goods for local manufacturing and final consumption goods
- Latin America: Exports jumped 16.8%, particularly vehicles, machinery, and electronics to Brazil, Mexico, and Chile
- Middle East and North Africa: Exports increased 11.3%, led by infrastructure equipment, telecommunications hardware, and consumer electronics
- Belt and Road Initiative countries: Trade with BRI partners grew 12.7%, reflecting infrastructure investments, preferential trade agreements, and deliberate diversification strategy
Equally significant was the product composition shift. While traditional low-margin goods like textiles and footwear saw export declines, high-value manufactured goods surged:
- Electric vehicles: Export volume exceeded 4.2 million units (up 38%), making China the world’s largest auto exporter
- Lithium batteries: Exports rose 27%, capturing nearly 60% of global market share
- Solar panels and components: Exports jumped 43% despite trade barriers in Western markets
- Consumer electronics: Exports of smartphones, laptops, and smart home devices grew 8.4%, with Chinese brands like Xiaomi, Oppo, and Transsion gaining market share in developing countries
The looming shadow over this export performance was geopolitical fragmentation and potential US tariff escalation. President Donald Trump’s return to office in January 2025 brought renewed threats of comprehensive tariffs on Chinese imports—though the feared “universal 60% tariff” failed to materialize in his first year, with more targeted measures imposed instead. Analysis from Goldman Sachs suggested that even a 25% across-the-board US tariff would shave only 0.3–0.5 percentage points from China’s GDP growth, given reduced exposure and supply chain adaptation since the 2018-2019 trade war.
“China’s export machine has proven remarkably adaptable,” said Iris Pang, chief China economist at ING, in a December 2025 note. “The diversification strategy is working—dependence on US and European markets has fallen from about 35% of total exports in 2018 to below 25% in 2025. That creates resilience, though it doesn’t eliminate vulnerability to coordinated Western restrictions on technology sectors.”
Policy Response: Stimulus Calibration and the Limits of Intervention
Beijing’s policy response to slowing growth in 2025 evolved from initial restraint to gradual escalation, though authorities remained notably more cautious than during previous slowdowns. The comprehensive stimulus deployed after the 2008 financial crisis or even the COVID reopening support proved absent—reflecting both debt sustainability concerns and philosophical shift toward “high-quality development” over raw GDP growth.
Monetary policy remained accommodative but relatively modest:
- The People’s Bank of China cut the one-year loan prime rate (LPR) by a cumulative 35 basis points across three reductions
- Reserve requirement ratios were lowered by 50 basis points to increase lending capacity
- Medium-term lending facility operations injected approximately 3.2 trillion yuan in liquidity
- Yet real interest rates remained positive and credit growth stayed around 9%—hardly the flood of cheap money seen in previous cycles
Fiscal policy became more assertive, particularly in the second half:
- The official fiscal deficit target was raised from 3% to 3.8% of GDP mid-year
- Special local government bond issuance exceeded 4 trillion yuan to fund infrastructure
- Direct subsidies for consumption (trade-ins, electric vehicle purchases) totaled roughly 300 billion yuan
- However, the “augmented” deficit (including off-budget borrowing) actually declined to around 12% of GDP from 14% in 2024, suggesting fiscal consolidation at local government level offset central stimulus
Structural reforms advanced incrementally:
- Hukou (household registration) restrictions were further relaxed in 100+ cities to promote labor mobility
- Services sector opening accelerated in healthcare, education, and finance
- Technology self-sufficiency investments continued, with semiconductor subsidies exceeding $50 billion
- State-owned enterprise reforms emphasized profitability over employment/output targets
The overall policy approach reflected what officials termed “precise and forceful” intervention—targeted support for manufacturing and infrastructure while allowing property and inefficient sectors to contract. This calibration achieved the 5% growth target but left structural imbalances substantially unaddressed.
The constraint on more aggressive stimulus was clear: debt. China’s total debt-to-GDP ratio reached approximately 295% by end-2025 (including household, corporate, and government debt), up from 285% in 2024 despite deleveraging rhetoric. Local government financing vehicle (LGFV) debt alone exceeded 60 trillion yuan, with mounting hidden obligations from “white-listed” property completion programs and infrastructure commitments. The International Monetary Fund warned in its October 2025 Article IV consultation that China’s debt trajectory was unsustainable without either much slower growth or serious fiscal reforms including property tax implementation and social security expansion.
“Beijing faces a trilemma,” noted Michael Pettis, finance professor at Peking University, writing in Foreign Policy. “They want high growth, low debt, and no painful structural adjustment. They can pick two at most—and 2025 showed them prioritizing growth and delaying adjustment, which means debt continues climbing.”
Comparative Context: China Versus Other Major Economies
Placing China’s 5% GDP growth in global perspective reveals both relative strength and absolute deceleration. Among major economies in 2025:
- United States: Grew approximately 2.1%, supported by resilient consumer spending and immigration-driven labor force growth
- Eurozone: Expanded just 0.8%, with Germany entering technical recession and France constrained by fiscal pressures
- Japan: Managed 1.2% growth, the strongest performance in five years, aided by tourism recovery and yen depreciation
- India: Surged 6.7%, maintaining its position as the world’s fastest-growing major economy, though questions persist about data quality and sustainability
China’s 5% thus outperformed all developed economies and most emerging markets outside South Asia. However, this comparison obscures the more relevant question: performance relative to potential. China’s working-age population is shrinking (down 0.4% in 2025), productivity growth has slowed from 6–7% annually in the 2000s to perhaps 2–3% currently, and the capital stock is nearing saturation in many regions. Economists estimate China’s “potential growth rate”—the maximum sustainable pace without generating inflation or imbalances—has fallen to around 4.5–5.0%.
By this standard, China’s 2025 performance represented growth at or even slightly above potential—which is why authorities could achieve the target while deflationary pressures persisted. The economy isn’t running “hot”; it’s likely running near capacity given structural constraints.
The more troubling comparison is historical Chinese performance. Annual growth rates have fallen steadily:
- 2010-2015 average: 8.1%
- 2016-2019 average: 6.7%
- 2020-2025 average: 5.0% (including COVID volatility)
This deceleration reflects demographic headwinds, diminishing returns to capital accumulation, technology frontier catching-up completion, and rebalancing away from investment toward consumption (which generates less GDP growth per unit of spending). While the slowdown is in some sense “natural” for a maturing economy, the speed of deceleration and the inability to achieve consumption-driven growth create political and social challenges for a system whose legitimacy rests partly on delivering rising living standards.
Demographic Destiny: The Long Shadow of Population Decline
No analysis of China’s 2025 economic performance would be complete without acknowledging the demographic shift that will increasingly constrain future growth. In early 2025, China’s National Bureau of Statistics confirmed that the population fell for the third consecutive year, declining by approximately 1.3 million to roughly 1.409 billion. More critically, the working-age population (15-59 years) contracted by 6.8 million, while the cohort aged 60+ grew by 5.5 million.
The birth rate fell to a historic low of 6.2 births per 1,000 people, down from 6.7 in 2024 and 10.5 as recently as 2020. Despite policy reversals—the one-child policy abandoned in 2016, two-child policy expanded in 2021, three-child policy introduced with incentives—Chinese couples are choosing to have fewer children due to crushing costs of education and housing, reduced economic optimism, and evolving social values among younger generations.
Demographic projections suggest China’s working-age population could shrink by 170-200 million by 2050—a labor force decline roughly equivalent to losing the entire workforce of Brazil or Indonesia. This creates multiple economic headwinds:
- Labor supply constraints: Fewer workers means slower potential GDP growth unless offset by dramatic productivity gains
- Consumption pressure: Elderly populations consume less than working-age adults, particularly in societies with weak pension systems
- Fiscal burden: Supporting a growing elderly population with a shrinking working-age tax base requires either higher taxes, lower benefits, or both
- Innovation concerns: Younger populations drive entrepreneurship and technology adoption; aging may reduce economic dynamism
Some economists argue that automation, artificial intelligence, and productivity improvements can offset demographic decline. China’s robotics deployment provides evidence for this optimism—the country installed more industrial robots in 2025 than the rest of the world combined. However, productivity growth ultimately depends on innovation, and China’s innovation ecosystem faces challenges from US technology restrictions, reduced foreign technology inflows, and educational system deficiencies in fostering creativity.
“Demography isn’t destiny, but it is gravity,” noted Nicholas Lardy, senior fellow at the Peterson Institute for International Economics. “China can grow faster than demographic fundamentals suggest if productivity accelerates dramatically. But that requires reforms—education, innovation, competition—that create political discomfort. The path of least resistance is slower growth, and that seems to be what we’re getting.”
The 2026 Outlook: Targets, Risks, and Scenarios
As China’s policymakers convene for the annual “Two Sessions” meetings in March 2026, they face the delicate task of setting realistic growth targets while maintaining confidence. Market consensus expects Beijing to announce an “around 5%” target for 2026, possibly with language allowing for 4.5–5.5% flexibility. This would represent continuity with 2025 while acknowledging ongoing headwinds.
The base case scenario for 2026 envisions:
- GDP growth: 4.7–5.2%, supported by modest stimulus, manufacturing resilience, and low baseline effects from 2025’s weak Q4
- Continued property sector contraction, but at a decelerating pace (perhaps -5% investment versus 2025’s -9.8%)
- Export growth moderating to 3–4% as global demand softens and trade barriers accumulate
- Consumption growth remaining weak around 4%, absent major policy shifts
- Inflation staying subdued with CPI around 0.8–1.2%, below target but avoiding outright deflation
Key upside risks include:
- More aggressive fiscal stimulus if growth threatens to fall below 4.5%
- Stronger-than-expected global economic performance boosting export demand
- Property market stabilization if confidence rebuilds and younger buyers re-enter
- Technology breakthrough in semiconductors or other sectors reducing import dependence
- Geopolitical détente with the US enabling trade normalization
Offsetting downside risks:
- US tariff escalation to 30–60% levels severely impacting exports
- Property crisis deepening into financial system contagion
- Local government debt crisis forcing fiscal contraction
- Demographic decline accelerating faster than productivity improvements
- Taiwan crisis precipitating comprehensive Western sanctions
Analysts at UBS outline three scenarios: an optimistic “soft landing” with 5.5% growth driven by consumption recovery; a baseline “muddling through” with 4.8% growth similar to 2025; and a pessimistic “hard adjustment” with 3.5% growth if property and debt crises intensify. They assign probabilities of 20%, 60%, and 20% respectively—suggesting high confidence in continued low-to-mid-single-digit growth, but uncertainty about exact trajectory.
Conclusion: Managed Slowdown or Gradual Stagnation?
China’s 2025 economic performance defies simple characterization. On one hand, meeting the 5% growth target amid fierce headwinds—prolonged property collapse, geopolitical tensions, demographic decline, weak domestic demand—represents genuine achievement. The manufacturing sector’s evolution toward high-value production, export market diversification, and technological advancement in key industries suggest enduring competitive strengths. The government demonstrated both willingness and capacity to deploy stimulus when needed, avoiding the hard landing that pessimists have predicted for years.
Yet the celebration must be tempered by uncomfortable realities. The Q4 slowdown to 4.5% growth—the weakest quarterly performance in three years—reflects fading momentum as stimulus effects wane. Deflationary pressures, weak consumption, property sector distress, and mounting debt burdens remain unresolved. Most concerningly, the policy response in 2025 relied on familiar playbooks—infrastructure spending, export promotion, manufacturing support—rather than the painful structural reforms needed to transition toward consumption-driven, sustainable growth.
The fundamental question facing China is whether the current trajectory represents a “managed slowdown” to a sustainable new normal around 4–5% growth, or the beginning of a gradual stagnation that could see growth drift toward 3% or lower by decade’s end absent major reforms. The answer depends on factors both within and beyond Beijing’s control: the willingness to tolerate painful adjustment in property and local government finances, the success of rebalancing toward consumption, demographic trends, technological self-sufficiency progress, and the evolution of US-China relations under changing American leadership.
For global investors, businesses, and policymakers, China’s 2025 performance reinforces a nuanced view: neither the miracle growth story of past decades nor the collapse narrative popular among certain analysts, but rather a complex, slowly-evolving economy with enduring strengths and mounting structural challenges. The dragon is neither soaring nor crashing—but its flight path is unmistakably descending.
As 2026 unfolds, watching how Beijing balances growth targets, debt sustainability, structural reform, and social stability will provide crucial insights into whether China can navigate this historic transition successfully—or whether the contradictions will eventually force a more disruptive reckoning. The stakes extend far beyond China’s borders: the trajectory of the world’s second-largest economy, largest manufacturer, and largest trading nation will shape global growth, inflation dynamics, commodity markets, and geopolitical stability for years to come.
The verdict on China’s 2025 economic performance is thus mixed—an achievement of official targets secured through familiar policy tools, but underlying fragilities that threaten sustainability. The real test lies not in meeting one year’s growth target, but in building a foundation for stable, consumption-driven prosperity in the decade ahead. On that more fundamental measure, the jury remains out, and the evidence from 2025 offers reasons for both cautious optimism and persistent concern.
Discover more from The Economy
Subscribe to get the latest posts sent to your email.


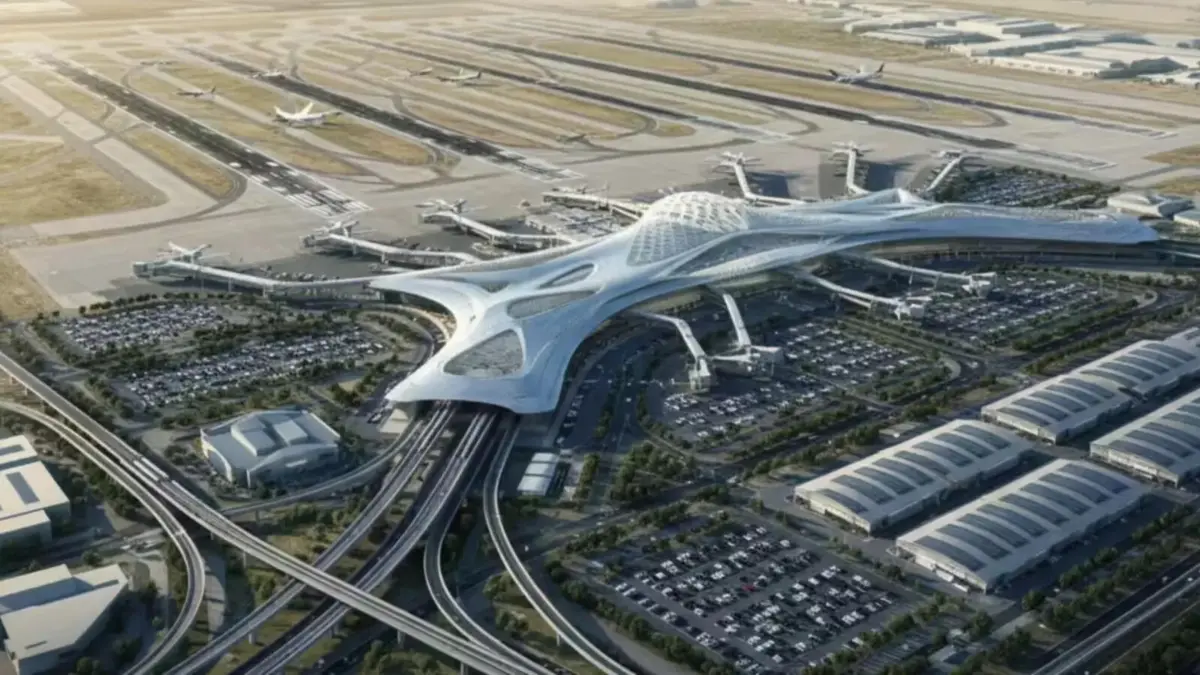
Dubai is in the middle of building what is intended to become the world’s largest airport by capacity — a Dh128 billion ($34.8 billion) expansion of Al Maktoum International Airport at Dubai World Central (DWC), according to Gulf News. When complete, the facility will feature five parallel runways, roughly 400 gates, and the capacity to handle up to 260 million passengers a year — nearly three times the current capacity of Dubai International Airport (DXB), already the world’s second-busiest airport for international traffic, per analysis from K Estates.
Where the project actually stands in 2026
Construction crews have already excavated more than 45 million cubic metres of earth and completed the airport’s second runway, according to MyBayut’s DWC guide. The first phase — a central passenger terminal and four concourses designed to handle 150 million passengers annually — is targeted for completion around 2032, per Khaleej Times. Dubai is set to allocate AED 55 billion worth of expansion contracts by the end of 2026 alone, underscoring the pace at which the project is being financed and built.
The scale of ambition extends beyond aviation infrastructure. DWC is being planned as a self-contained “airport city,” incorporating business, cultural, and residential districts across Dubai South, roughly 35 kilometres from Dubai Marina, according to the same Khaleej Times reporting. All operations currently based at DXB — including Emirates’ long-haul network — are expected to eventually transfer to the new hub.
Part of a much bigger regional aviation build-out
Al Maktoum’s expansion is the largest single project within a broader regional wave of investment: airports across the Middle East, Africa, and South Asia are expected to spend a combined $183 billion on capacity, connectivity, and passenger-experience upgrades, with the UAE and Saudi Arabia leading the push, according to Gulf News. Within the UAE alone, expansion plans extend beyond Dubai to Sharjah and Ras Al Khaimah, with a shared emphasis on AI-enabled operations, IoT systems, and energy-efficient terminal design.
What it means for the region’s real estate and travel markets
The airport build-out is already reshaping property markets nearby. Transactions in Dubai South exceeded AED 15 billion ($4.1 billion) in just the first five months of 2025 — nearly matching the entire AED 16.1 billion recorded across all of 2024 — with analysts forecasting further price appreciation as the airport nears completion, according to K Estates. For travellers and airlines, the eventual payoff is a dramatic increase in regional connectivity capacity at a time when global air travel demand — and airfares — have both been climbing steadily through 2026.
Key takeaways
- Al Maktoum International Airport’s expansion carries a price tag of roughly $34.8 billion (Dh128 billion) and is intended to make it the world’s largest airport by 2050.
- Full build-out capacity: five runways, ~400 gates, up to 260 million passengers annually and 12 million tonnes of cargo.
- Phase one, targeted for around 2032, alone will handle 150 million passengers a year.
- The project has already reshaped Dubai South real estate, with transactions surpassing AED 15 billion in the first five months of 2025.
- It is the anchor project within a broader $183 billion regional airport investment wave across the Middle East, Africa, and South Asia.
FAQ
When will Al Maktoum International Airport be the world’s largest? Full completion is projected around 2050, though the first major phase is targeted for roughly 2032.
How many passengers will Al Maktoum Airport handle? Up to 260 million passengers annually at full capacity, with the first completed phase alone handling 150 million.
Will Emirates move its operations to the new airport? Yes — all Dubai International Airport operations, including Emirates’ long-haul network, are expected to eventually transfer to Al Maktoum International.
Discover more from The Economy
Subscribe to get the latest posts sent to your email.

What happened: In early 2026, the United Arab Emirates declined to roll over a $3 billion loan to Pakistan — the first such refusal in seven years. The repayment equalled roughly 18% of Pakistan’s foreign currency reserves, arriving as Islamabad also faced a $1.3 billion bond payment and was waiting on the next IMF tranche.
Why it matters: It’s the clearest sign yet that Gulf sovereign patience with Pakistan’s balance-of-payments cycle is thinning, even as Gulf states simultaneously court China, Saudi Arabia, and each other for capital in a tightening regional liquidity environment.
The Story Nobody’s Connecting
Most coverage of Pakistan’s 2026 external account stress treats the UAE’s loan decision as an isolated liquidity event — a “routine financial transaction,” in the words of Pakistan’s own Ministry of Foreign Affairs. That framing misses the bigger pattern. The same weeks that Abu Dhabi called in its $3 billion, unusual delays began appearing in bank transfers from Saudi Arabia to the UAE itself — friction between the Gulf’s two largest economies, at a moment when both are also managing their own post-war oil price adjustment. (Pakistan & Gulf Economist)
Put those two data points together and a different story emerges: this isn’t just about Pakistan’s creditworthiness. It’s about Gulf capital becoming more selective, more transactional, and less willing to extend informal grace periods across the board — with Pakistan simply the most exposed borrower in the queue.
The Numbers Behind the Pressure
Pakistan’s State Bank held $16.4 billion in reserves as of late March 2026 — enough to cover roughly three months of imports, a threshold economists generally treat as a comfort floor, not a cushion. (Mettis Global News) The UAE’s declined rollover landed at the same time as a looming $1.3 billion international bond payment and dependence on the next $1.2 billion IMF disbursement — a convergence of obligations that left the State Bank with limited room to maneuver beyond import restrictions, rate hikes, or fresh commercial borrowing.
The backdrop matters too. The rupee had been trading in a comparatively narrow 278–282 band before the escalation of the Iran conflict pushed global oil prices higher, squeezing Pakistan’s import bill precisely when its Gulf safety net began to wobble. The KSE-100 benchmark, meanwhile, had already shed around 15% amid the broader pressure. (Mettis Global News)
This is not Pakistan’s first Gulf-dependency cycle. The IMF’s own record shows a now-familiar pattern: staff-level agreements reached in Dubai, UAE pledges of multibillion-dollar investment arriving alongside IMF tranches, and Gulf bridge financing used to stave off sovereign default in periods when reserves cover shrinks toward zero. (Business Standard) What’s different in 2026 is that the bridge itself is showing cracks.
Islamabad’s Official Line vs. the Structural Reality
Pakistan’s government has leaned into a “stability to sustainable growth” narrative around its FY2026–27 federal budget, with the finance minister framing the transition as export-driven rather than reserve-dependent. Business groups have broadly welcomed the budget, and the current account posted a $459 million surplus in May 2026, an improvement attributed to strong remittance inflows. (Business Recorder) The Monetary Policy Committee has held rates steady rather than reaching for emergency tightening, which is itself a signal that the central bank does not yet see the UAE episode as a systemic trigger.
But a current account surplus built substantially on remittances is different from one built on export competitiveness or durable FDI. Pakistan’s trade structure still leans heavily on a narrow set of partners: China supplies over a quarter of its imports and a meaningful share of its exports, the UAE is both a top export destination and its second-largest import source, and Gulf states collectively remain the primary channel for both remittances and emergency liquidity. (Wikipedia — Economy of Pakistan) That concentration is precisely what makes a single Gulf lender’s changed appetite so consequential.
Why the Oil Backdrop Compounds the Risk
None of this is happening in a vacuum. The IMF’s own July 2026 commentary noted that global oil markets “absorbed the war shock” from the Iran conflict, but cautioned that buffers — spare production capacity, strategic reserves, shipping insurance capacity — are running low. (IMF Blog) For an oil-importing, reserve-constrained economy like Pakistan, a second energy price shock without deeper buffers would land directly on the same reserves the UAE loan was meant to protect.
What to Watch Next
- Whether Saudi Arabia steps in as an alternative bridge lender, or whether the Riyadh–Abu Dhabi transfer friction signals a broader Gulf liquidity tightening that limits everyone’s appetite to backstop Pakistan.
- The pace and size of the next IMF tranche, and whether Fund conditionality shifts to demand deeper reserve buffers given the UAE precedent.
- Whether China increases its role as lender of last resort, deepening Pakistan’s dependency in exactly the direction Gulf financing was historically meant to offset.
Discover more from The Economy
Subscribe to get the latest posts sent to your email.
Introduction
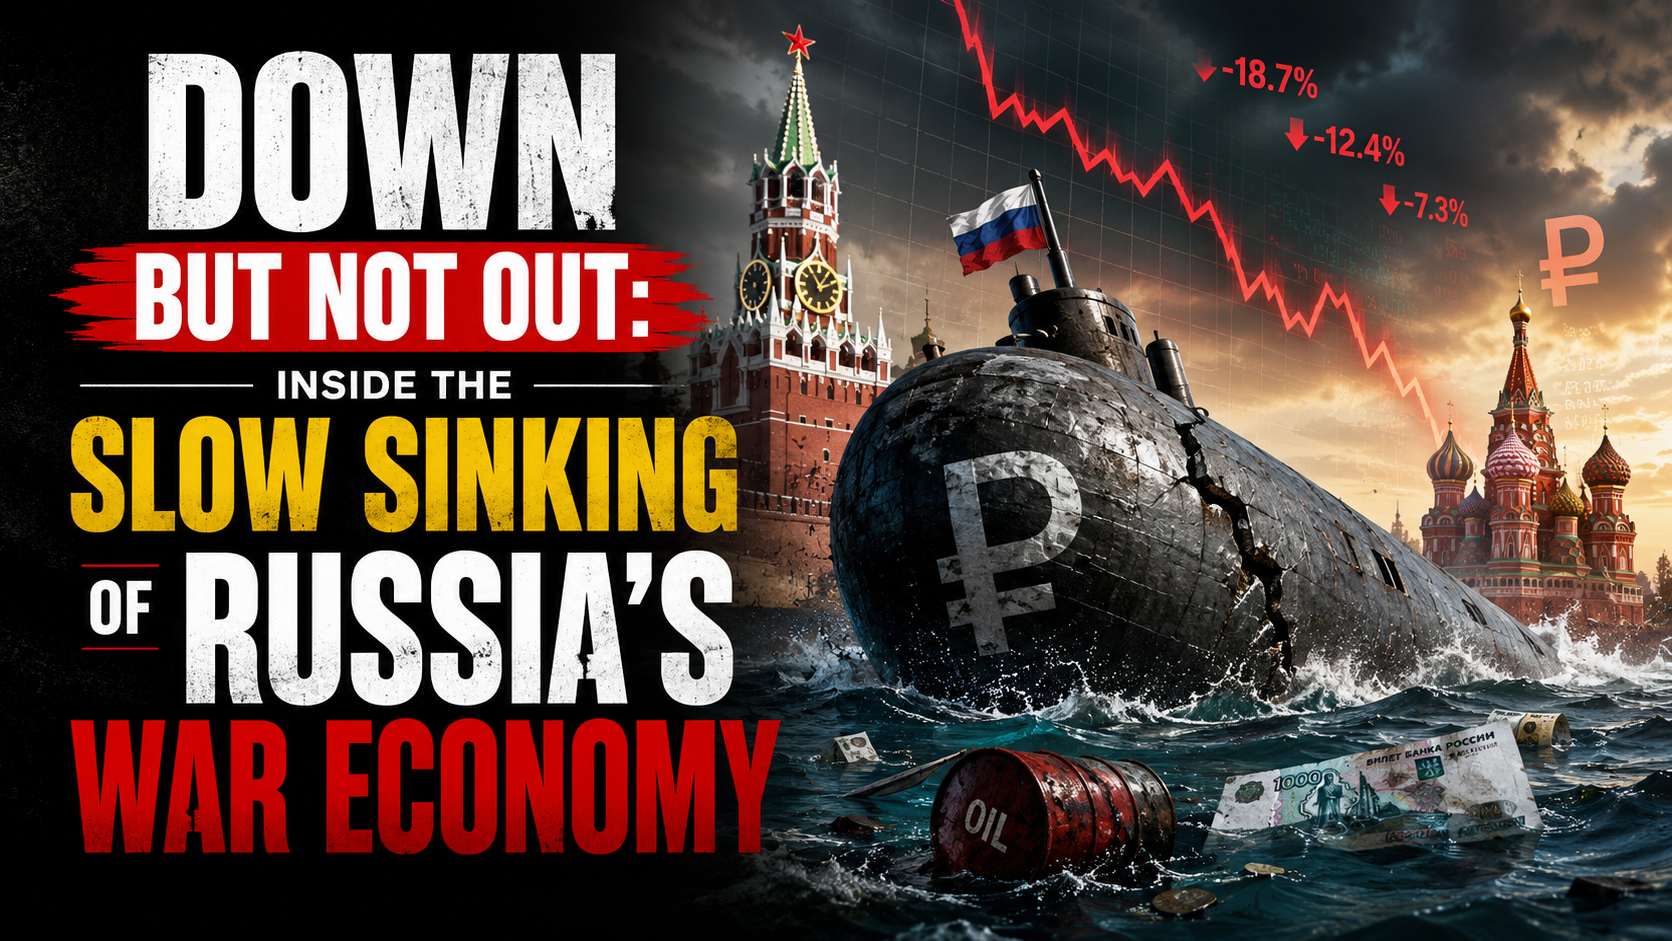
The European Council formally extended its economic sanctions against Russia for another full year on 25 June 2026, keeping restrictive measures in place until 31 July 2027 (Council of the EU). More than four years into the war, the headline story of Russia’s economy has shifted from whether sanctions would work to a more nuanced question: how much longer can the Kremlin keep financing the war before the accumulated strain becomes impossible to hide behind favorable official statistics.
The Sanctions Architecture, Renewed Again
The EU’s economic measures against Russia, first introduced in 2014 and dramatically expanded after the February 2022 full-scale invasion, now span trade, finance, energy and dual-use technology restrictions, alongside asset freezes and travel bans on a broad range of individuals and entities (Council of the EU). Since February 2022, the EU has adopted 20 separate sanctions packages, and the European Council has explicitly stated it remains determined to keep weakening Russia’s war economy by further reducing its energy revenues, curbing shadow-fleet oil shipping operations and constraining its banking system (Council of the EU). Separately, on 3 July 2026 the EU sanctioned six individuals connected to the poisoning and death of opposition figure Alexei Navalny, underscoring that the sanctions regime continues to expand on human-rights grounds as well as economic ones (Council of the EU Sanctions Timeline).
The Headline Numbers Beijing-Style Optimism Can No Longer Explain Away
Russia’s GDP is now put at roughly $2.51 trillion, the world’s eleventh-largest economy — comparable in size to South Korea despite Russia’s vastly larger landmass and resource base — with 2026 growth projected at just 1.0% and inflation running at 5.2% (Statistics of the World). More pessimistic estimates put full-year 2026 growth even lower, at around 0.4%, which would be worse than 2025’s already-weak 1% expansion and would mark a sharp deceleration from the 4.1% growth Russia posted in 2023 as it forged new trading relationships to route around initial sanctions (Forbes).
Oil and gas revenues — historically around half of Russia’s state income — have fallen to roughly a quarter, a deliberate outcome of Western sanctions strategy that targets how much Russia earns from exports rather than blocking those exports outright (Stockholm School of Economics/SITE). Russia’s oil and gas budget revenues reportedly halved in January 2026 alone, with crude prices falling below $73 a barrel before the Middle East conflict briefly reversed the trend, sending Brent surging more than 55% to near $120 a barrel at its peak (Forbes).
The Middle East War: A Temporary Lifeline With Long-Term Costs
The spike in oil prices tied to the Iran conflict, combined with a period of eased US sanctions enforcement on Russian oil under President Trump, offered Moscow unexpected fiscal breathing room in mid-2026 (Forbes). But that same conflict has undermined Russia’s longer-term energy diversification ambitions in the region: two Russian-backed power plant projects in Iran have been put on hold, along with oil and gas exploration work and plans to build new transit routes linking Russia to India via Iran (Forbes).
The Gap Between Official Statistics and Underlying Reality
Perhaps the most important analytical point from recent research is not about any single data point but about the reliability of Russian statistics themselves. Torbjörn Becker of the Stockholm Institute of Transition Economics has argued the real test of sanctions is not whether they end the war overnight, but how much they erode the Kremlin’s capacity to finance it — and by that measure, the evidence points to deeper strain than headline GDP figures suggest (Stockholm School of Economics/SITE). Becker notes that Russia’s economy grew only modestly in 2022 despite oil prices rising sharply that year — a gap between expected and actual performance that implies a considerably larger hidden economic hit than the official contraction figures showed (Stockholm School of Economics/SITE). Compounding the problem, Russian authorities have stopped publishing several key statistics since 2022, making independent assessment of inflation, consumption and real economic conditions increasingly difficult — leading Becker to conclude that “statistics have become part of the narrative” rather than a neutral measure of economic reality (Stockholm School of Economics/SITE).
The Military-Civilian Economic Split
A recurring theme across recent analysis is the growing bifurcation between Russia’s overheating military-industrial sector and a stagnating civilian economy. This imbalance has pushed interest rates higher and forced the liquidation of a striking 71% of Russia’s gold reserves to help fund continued war spending (Forbes). Russia’s total fossil fuel export revenue is estimated at roughly €734 million per day, underscoring just how central hydrocarbon income remains to the entire war financing model even as that revenue stream shrinks (Forbes).
The Counter-Narrative: Wages Still Rising
It would be inaccurate to describe Russia’s economy as in freefall. CSIS research notes that Russian salaries rose 17.8% in nominal terms and 8.7% in real terms in 2024 compared to 2023, with disposable incomes up 6.1% in 2023 and 7.3% in 2024 — growth rates not seen in Russia in almost two decades (CSIS). Government budget projections still expect real salaries to rise, albeit at a decelerating pace: 7% in 2025, 5.7% in 2026 and 4.1% in 2027 — a marked slowdown from the 2024 peak but still roughly double the pre-invasion decade average (CSIS). This wage growth, driven substantially by wartime labor shortages and military-adjacent spending, is precisely the kind of headline-stabilizing data point that has allowed Putin to argue publicly that sanctions have failed to cripple his economy (Fortune) — even as think tanks describe the broader trajectory as pushing Russia toward what one report calls an “economic, political, and military abyss” (Fortune).
What Comes Next
Renewed legislative pressure in Washington — including the Sanctioning Russia Act introduced with strong bipartisan support — signals appetite in the US for tightening the screws further, even as the loss of a key congressional champion for that effort has complicated the political path forward (TIME). Whether the EU’s renewed sanctions regime, continued oil price pressure, and constrained reserves ultimately force a shift in Kremlin calculus toward negotiation remains the central open question for 2027.
Key Takeaways
- The EU has extended Russia sanctions for a further year, through 31 July 2027, continuing a regime built from 20 separate packages since 2022.
- Russia’s 2026 GDP growth is forecast between 0.4% and 1.0%, a sharp deceleration from 2023’s 4.1% post-shock rebound.
- Oil and gas revenue’s share of Russian state income has fallen from roughly half to about a quarter as Western sanctions target export earnings specifically.
- Russia has liquidated a large share of its gold reserves to sustain war financing amid a widening split between an overheating military sector and a stagnating civilian economy.
- Official Russian statistics likely understate the true economic strain, according to independent economists who cite a widening gap between reported and expected performance.
Sources: Council of the EU, Council of the EU Sanctions Timeline, Stockholm School of Economics/SITE, Forbes, Statistics of the World, CSIS, Fortune, TIME
Discover more from The Economy
Subscribe to get the latest posts sent to your email.

Balance of Payments (BOP)

The Falkland Islands Dispute: Sovereign Wealth, Offshore Drilling, and Market Impacts

Gross Domestic Product (GDP): Nominal vs. Real

What is Inflation and the Consumer Price Index (CPI)?

US-China Trade Competition 2026: Supply Chain Relocation Guide

Oil Prices Break $100 in 2026: Middle East Conflict & Energy Markets

South-South Trade Expansion: Digital Integration and Emerging Market Growth

$166B Tariff Refund Tapering Fast: Is Your Business Missing Out?

Stock Market Today: Dow Climbs 500 Points as Markets Shake Off Inflation Jitters

14th WTO Conference 2026: Tariffs & Global Supply Chain Impact

Swish Secures $24M Funding to Disrupt India’s $100B Food Market

Physical AI and Driverless Tech: The Next Trillion-Dollar Industrial Revolution

Enterprise AI Platforms Disrupting B2B SaaS in 2026: Full Analysis

Crypto vs. Safe Haven Assets 2026: Where Institutions Are Hedging

State Farm’s $5B Dividend 2026: Who Qualifies & Payout Dates

US-China Relations in Q3 2026: Trade Tariffs and Supply Chain Risks

Gold’s Wild 2026: From a Record $5,600 Peak to a 24% Crash and Back Toward $4,500

Oil Surges as Strait of Hormuz Traffic Collapses Again

The Rocket That Won’t Quit: Inside SpaceX’s Falcon 9 Launch Machine

Bank of England Set to Hold Rates Through Year-End, Reuters Poll Shows

SpaceX Starship Flight 14: First Orbital Attempt & Starlink V3 Launch Explained

The 2026 Crypto Regulatory Shift: What It Means for Institutional Investors

AI Chip Stocks 2026: The Best Semiconductor Investments Beyond Marvell

Retail Earnings Week: What Home Depot, Target & Walmart Reveal

AI-Powered Training: The Next Multi-Billion Dollar Ecosystem in Fitness

Russia’s Black Sea Oil Exports Fall for a Fifth Straight Week

Global Chip Selloff Deepens: What’s Driving the Aug. 19 Semiconductor Rout

Tween Back-to-School Trends 2026: What’s Driving the $85B Season
-

 Markets & Finance8 months ago
Top 15 Stocks for Investment in 2026 in PSX: Your Complete Guide to Pakistan’s Best Investment Opportunities
-

 Analysis7 months ago
Johor’s Investment Boom: The Hidden Costs Behind Malaysia’s Most Ambitious Economic Surge
-

 Analysis7 months ago
Top 10 Stocks for Investment in PSX for Quick Returns in 2026
-

 Analysis7 months ago
Brazil’s Rare Earth Race: US, EU, and China Compete for Critical Minerals as Tensions Rise
-

 Banks8 months ago
Best Investments in Pakistan 2026: Top 10 Low-Price Shares and Long-Term Picks for the PSX
-

 Investment8 months ago
Top 10 Mutual Fund Managers in Pakistan for Investment in 2026: A Comprehensive Guide for Optimal Returns
-

 Global Economy9 months ago
15 Most Lucrative Sectors for Investment in Pakistan: A 2025 Data-Driven Analysis
-

 Global Economy9 months ago
Pakistan’s Export Goldmine: 10 Game-Changing Markets Where Pakistani Businesses Are Winning Big in 2025