
Exclusive
Why Economists Are Raising the US Economic Outlook for 2026 Above 2% Despite Trumponomics
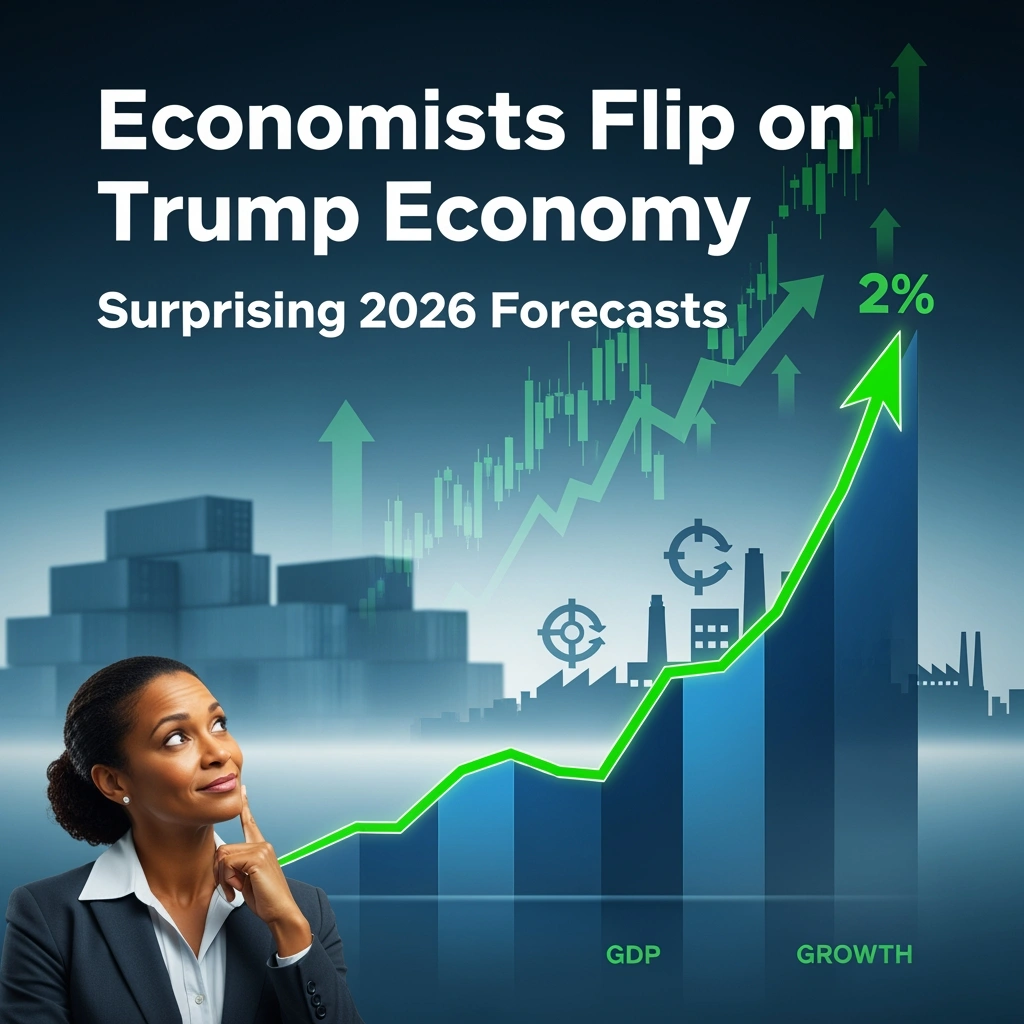
There’s a peculiar rhythm to economic forecasting in polarized times. Last year, as President Trump’s second term began with talk of sweeping tariffs and aggressive trade renegotiations, professional economists did what they’re trained to do: they downgraded their growth projections. The US economic outlook 2026 dimmed considerably, with consensus forecasts sliding from a comfortable 2.4% GDP growth to a more anemic 1.8% by mid-2025.
Now, barely six months later, those same economists are quietly walking back their pessimism. The latest Wall Street Journal survey of forecasters shows the 2026 GDP forecast rebounding to 2.2%—a meaningful revision that signals something important has shifted in how the professional class views Trumponomics impact on the American economy.
It’s a classic case of markets—and economists—hating uncertainty more than bad news. What we’re witnessing isn’t necessarily a vindication of Trump’s economic policies, nor is it a repudiation. Rather, it’s a sophisticated recalibration based on three critical insights: the policies are more predictable than feared, the underlying economy has proven remarkably resilient, and the full policy mix includes growth-positive elements that may offset the drag from protectionism.
This article examines why economic sentiment has reversed course, what the latest data reveals about US GDP growth 2026 forecast, and what this recalibration means for investors, policymakers, and everyday Americans navigating an economy caught between competing forces.
The Evolution of Forecasts: From Pre-Election Optimism to Tariff Fears and Back
To understand where we are, we need to trace where we’ve been. The forecast trajectory for 2026 reads like a volatility chart.
In late 2024, before the November election, economists were cautiously optimistic. The Federal Reserve had engineered what looked increasingly like a soft landing—inflation cooling from its 2022 peaks without triggering recession. The Blue Chip Economic Indicators survey showed consensus 2026 GDP forecast hovering around 2.3%, roughly in line with estimates of potential growth. The Conference Board projected similar numbers, while the IMF’s October 2024 World Economic Outlook pegged US growth at 2.2% for 2026.
Then came the election and its aftermath. President Trump’s victory brought promises of universal baseline tariffs, potential 60% levies on Chinese imports, and sweeping immigration restrictions. For economists schooled in the costs of protectionism, alarm bells rang. The Trump tariffs economic growth calculus looked decidedly negative.
By February 2025, the downgrades began in earnest. Goldman Sachs economists, who had been relatively optimistic, trimmed their 2026 forecast from 2.4% to 1.9%. The Wall Street Journal’s monthly survey saw its consensus plummet to 1.8% by March 2025—the lowest reading since the COVID recovery. The National Association for Business Economics (NABE) survey told a similar story, with members citing trade policy uncertainty as their top concern. Even typically sanguine forecasters like Vanguard’s economic team reduced their baseline scenario.
The concerns were well-founded in economic theory. Tariffs function as consumption taxes, raising prices for businesses and consumers. Immigration restrictions, in an economy near full employment, threatened to constrain labor supply and boost wage pressures. The Tax Foundation estimated that comprehensive tariff implementation could reduce GDP by 0.5-0.7 percentage points. Oxford Economics modeled potential scenarios showing growth dropping below 1.5% under aggressive trade action.
But here’s what economists didn’t fully anticipate: the gap between campaign rhetoric and implemented policy, the market’s growing comfort with Trump’s negotiating style, and the resilience of the underlying economic fundamentals.
What the Latest Surveys Reveal: A Quiet Consensus Emerges
Fast forward to January 2026, and the forecast landscape looks strikingly different. The latest Wall Street Journal survey, conducted in early January and released last week, shows the consensus US economic outlook 2026 rising to 2.2%—a 40-basis-point upgrade from the trough just months ago.
But the WSJ survey doesn’t stand alone. A convergence is happening across the forecasting community:
Major Forecast Revisions (2026 GDP Growth):
- Goldman Sachs: Now projecting 2.5%, up from 1.9% (June 2025 revision)
- Morgan Stanley: 2.3%, revised from 1.7%
- JP Morgan: 2.1%, up from 1.8%
- Deloitte Economic Outlook: 2.2% baseline scenario
- Blue Chip Economic Indicators: Consensus 2.2% (January 2026)
- IMF World Economic Outlook Update: 2.3% (January 2026 release)
- World Bank Global Economic Prospects: 2.1% (January 2026)
- Conference Board: 2.0% (December 2025 revision)
The pattern is unmistakable. Institutions that slashed forecasts in late 2024 and early 2025 are now rebuilding their growth expectations. Goldman Sachs economist Jan Hatzius, whose team produces some of Wall Street’s most closely watched forecasts, noted in a recent client note that “the policy uncertainty premium has declined meaningfully as the administration’s approach has become clearer and more selective than initially feared.”
The Federal Reserve’s own Summary of Economic Projections, released at the December 2025 FOMC meeting, shows Fed governors’ median 2026 GDP forecast at 2.0%—unchanged from September but notably not downgraded despite ongoing policy uncertainty. The Atlanta Fed’s GDPNow model, which provides real-time tracking, has been running consistently above 2% for Q1 2026.
Even international observers are upgrading. The OECD’s November 2025 Economic Outlook raised its US forecast to 2.2%, while private European forecasters like Capital Economics shifted from recession warnings to modest growth projections.
What explains this collective revision? The answer lies not in economists becoming Trump enthusiasts, but in three interconnected developments that have reduced tail risks and clarified the policy trajectory.
Why Concerns Have Receded: Pricing In Predictability
The first and perhaps most important factor: policy clarity has increased, and actual implementation has been more measured than feared.
While President Trump imposed selective tariffs—including 20% levies on certain steel and aluminum imports and targeted increases on Chinese electric vehicles and semiconductors—the promised universal baseline tariff never materialized. The threatened 60% across-the-board China tariffs were replaced by sector-specific measures and ongoing negotiations. The administration has clearly prioritized using tariff threats as negotiating leverage rather than as a comprehensive policy overhaul.
“We’ve essentially moved from pricing in worst-case scenarios to pricing in what’s actually happening,” explains Mark Zandi, chief economist at Moody’s Analytics, in a recent podcast. “The administration has proven more pragmatic than the campaign suggested.”
This matters enormously for economic modeling. A 10% universal tariff has very different effects than targeted 20-25% tariffs on specific sectors. The former would ripple through the entire price system; the latter creates manageable adjustments in affected industries while leaving broader consumption patterns largely intact.
The immigration policy follow-through has similarly been less disruptive than modeled. While border enforcement has tightened and deportations have increased, mass deportation scenarios haven’t materialized. The labor market, while showing some regional tightness in agriculture and construction, hasn’t experienced the supply shock that February 2025 forecasts assumed. Initial claims for unemployment insurance remain near historic lows, and workforce participation has actually edged up.
Second, the underlying economic fundamentals have proven remarkably robust, providing a buffer against policy headwinds.
Consumer spending, which accounts for roughly 70% of US GDP, has maintained momentum through the uncertainty. Retail sales grew 3.2% in Q4 2025 (year-over-year), supported by solid wage growth, accumulated pandemic savings still working through the system, and a strong labor market. The unemployment rate stood at 3.9% in December 2025—above the 3.5% lows of 2023 but still historically tight.
Corporate balance sheets remain healthy. S&P 500 companies entered 2026 with leverage ratios near two-decade lows and cash positions that can fund investment even if financing conditions tighten. Capital expenditure plans, particularly in technology and infrastructure, continue to show strength. The Deloitte CFO Signals survey indicates that 64% of chief financial officers plan to increase capital spending in 2026—a vote of confidence in medium-term growth prospects.
The financial system is stable. Banks are well-capitalized, credit spreads remain reasonable, and there are no obvious bubbles threatening systemic stability. The Fed’s financial stability report, released in November 2025, identified no major vulnerabilities requiring immediate policy action. This stands in sharp contrast to the fragile conditions that preceded the 2008 financial crisis or even the regional banking stress of early 2023.
Third, economists have recalibrated their models to account for growth-positive policy elements that were underweighted in initial assessments.
The extension and expansion of the 2017 Tax Cuts and Jobs Act provisions—which were set to expire in 2025—provides meaningful fiscal stimulus. The Tax Foundation estimates that making these cuts permanent and adding new provisions (including expanded bonus depreciation and R&D expensing) could add 0.3-0.5 percentage points to GDP growth over a two-year horizon.
Deregulation across energy, finance, and technology sectors has proceeded faster than anticipated. While the economic effects of regulatory relief are notoriously difficult to quantify, surveys of business sentiment show meaningful improvement in perceived operating freedom. The National Federation of Independent Business (NFIB) optimism index rose 8 points between mid-2025 and January 2026, with “government regulations” dropping from the top concern to fourth place.
Energy policy has tilted decisively toward production maximization. Permits for drilling on federal lands have accelerated, and the administration has fast-tracked LNG export facilities. While this carries environmental costs, the economic modeling clearly shows near-term GDP benefits from increased domestic energy production and exports. The Energy Information Administration projects US crude oil production reaching 13.5 million barrels per day in 2026—a record that supports both GDP growth and the trade balance.
Potential Upside Drivers: Tax Cuts, Productivity, and the AI Wildcard
Beyond the recession of specific fears, there are genuine positive scenarios that some economists now see as plausible upside risks to the 2.2% consensus.
The most significant involves productivity growth. After decades of disappointing productivity performance—the so-called “productivity slowdown” that puzzled economists since the early 2000s—there are tantalizing hints of acceleration. Labor productivity grew at a 2.3% annual rate in Q3 2025, following 2.5% in Q2. These numbers, if sustained, would represent a meaningful break from the 1.3% average of the 2010-2019 period.
The driver? Artificial intelligence and related technologies may finally be showing up in the productivity statistics. Goldman Sachs research suggests that generative AI could boost productivity growth by 0.3-0.5 percentage points annually over the next decade as adoption spreads beyond early-adopting tech firms into traditional sectors. While productivity is notoriously hard to forecast, the possibility of sustained acceleration represents the most consequential upside scenario for long-term growth.
“If we’re entering a genuine productivity boom driven by AI diffusion, then 2.5-3% growth becomes achievable without triggering inflation,” notes Northwestern University economist Diane Swonk. “That would be the best-case scenario—and it’s not impossible.”
Tax policy provides another potential accelerant. Beyond simply extending existing cuts, there’s discussion of further corporate tax reduction and expanded investment incentives. While the fiscal sustainability of such measures is questionable, the growth effects in the near term could be meaningful. The Penn Wharton Budget Model estimates that comprehensive tax reform along the lines being discussed could add 0.2-0.4 percentage points to 2026 growth, though at the cost of significantly larger deficits.
Infrastructure spending, ironically, could provide bipartisan stimulus. Despite political dysfunction, there’s surprising consensus on the need for infrastructure investment, particularly in broadband, the electrical grid (to support AI data centers and EV charging), and water systems. The Infrastructure Investment and Jobs Act passed in 2021 continues to ramp up spending, and there are indications of potential additional packages. These have multiplier effects that many mainstream models may be underestimating.
Consumer balance sheets also carry upside potential. Household debt service ratios remain well below pre-2008 levels, suggesting capacity for increased borrowing if consumers choose to leverage themselves. The median FICO score has risen to 717—the highest in decades—indicating broad creditworthiness. If confidence continues improving and consumers decide to spend rather than save, consumption growth could exceed the modest projections embedded in current forecasts.
Lingering Risks: Inflation Persistence, Trade Escalation, and Fiscal Limits
Yet for all the upgraded optimism, significant downside risks remain—and prudent analysts are quick to enumerate them.
Inflation hasn’t fully surrendered. Core PCE inflation stood at 2.8% in December 2025, still uncomfortably above the Fed’s 2% target. The disinflationary progress that characterized 2023-2024 has stalled. If tariffs broaden or immigration restrictions tighten further, price pressures could reaccelerate. The Cleveland Fed’s inflation nowcast suggests core inflation may tick up to 3.0% by mid-2026 under current policy trajectories.
The Fed faces an uncomfortable dilemma. With inflation above target but growth forecasts modest, the central bank has limited room for error. The market currently prices in one 25-basis-point rate cut in 2026—far fewer than the four cuts anticipated a year ago. If inflation proves stickier than expected, the Fed may need to maintain restrictive policy longer, or even hike again, which would pressure growth. Goldman Sachs assigns a 25% probability to a “no-landing” scenario where persistent inflation forces renewed tightening.
Trade policy remains a wildcard. While the administration has been more selective than feared, the tariff toolkit remains on the table. Negotiations with China remain contentious, and there are indications of potential new actions on autos and pharmaceuticals. Each escalation carries ripple effects through supply chains that are difficult to model. The Peterson Institute for International Economics maintains that comprehensive tariff implementation could still reduce GDP by 0.5-1.0 percentage points if deployed broadly.
Global retaliation poses additional risks. The EU has already implemented measured counter-tariffs on $6 billion in US goods. China has responded with restrictions on rare earth exports and agricultural purchases. If tit-for-tat escalation accelerates, US exporters—particularly in agriculture, aerospace, and professional services—could face significant headwinds. The National Association of Manufacturers warns that export-dependent sectors remain vulnerable to policy shifts.
Fiscal sustainability concerns are mounting. The Congressional Budget Office projects the federal deficit reaching $2.0 trillion in fiscal 2026—roughly 7% of GDP during a period of relative prosperity. If tax cuts expand without offsetting spending reductions, these deficits could swell further. While markets have thus far absorbed Treasury issuance without difficulty, there are limits to fiscal tolerance.
Higher deficits push up long-term interest rates, crowd out private investment, and create vulnerability to future crises. The 10-year Treasury yield has climbed from 3.8% in mid-2025 to 4.4% currently—not yet problematic, but moving in a concerning direction. If foreign buyers (particularly China and Japan) reduce Treasury holdings or if inflation fears intensify, financing costs could jump, creating a drag on growth that swamps policy stimulus.
Political dysfunction in Washington adds uncertainty. With narrow margins in Congress, legislative gridlock on fiscal and regulatory matters could prevent coherent policy implementation. The debt ceiling fight looms again in mid-2026, carrying the risk of another damaging standoff. These political economy factors don’t appear directly in GDP models but affect business confidence and planning horizons.
Global Ripple Effects and Comparative Outlooks
The US economic trajectory doesn’t unfold in isolation. How America performs relative to other major economies shapes capital flows, currency movements, and global growth dynamics.
The latest forecasts show US GDP growth 2026 forecast outpacing most developed economies. The Eurozone faces persistent structural challenges—aging demographics, energy dependence, and fiscal fragmentation—that constrain growth to around 1.3%. Germany, Europe’s largest economy, may barely reach 1.0% as manufacturing weakness persists. The UK, still managing post-Brexit adjustments and political uncertainty, is projected at 1.5%.
Japan presents an interesting case. After decades of stagnation, modest reforms and inflation returning to positive territory have created cautious optimism. The IMF projects 1.1% growth for Japan in 2026—underwhelming in absolute terms but representing relative improvement. The yen’s weakness has boosted export competitiveness, though at the cost of eroding real purchasing power for Japanese consumers.
China’s trajectory remains the great uncertainty in global forecasting. Official targets suggest 4.5-5.0% growth, but private analysts are increasingly skeptical. The property sector downturn continues to metastasize, local government debt pressures mount, and demographic headwinds intensify. Consensus among Western forecasters has settled around 4.2% for 2026—still high by developed economy standards but representing continued deceleration for the world’s second-largest economy.
This comparative context matters because US outperformance attracts capital. The dollar has strengthened against most major currencies, reflecting both higher relative growth and more attractive yields. This creates a virtuous cycle for US assets but potentially complicates the Fed’s inflation fight, as a strong dollar pressures commodity prices upward and tightens financial conditions globally.
Emerging markets face squeeze from multiple directions. Higher US yields pull capital away from riskier markets. A strong dollar increases debt servicing costs for the many countries that borrowed in dollars. Trade policy uncertainty disrupts supply chains that many emerging economies depend upon. The Institute of International Finance notes that emerging market growth forecasts have been revised down by 0.3 percentage points on average for 2026, partly reflecting spillovers from US policy uncertainty.
Yet there are winners in the new configuration. Mexico benefits from nearshoring trends and USMCA trade advantages, with forecasts around 2.7%. India continues to attract investment as a China alternative, with projections near 6.5%. Vietnam, Indonesia, and Poland have emerged as beneficiaries of supply chain diversification.
The global picture, then, shows the US growing faster than most developed economies but slower than major emerging markets—a middle ground that reflects both American strengths (dynamism, innovation, deep capital markets) and constraints (high debt levels, political polarization, demographic pressures).
What This Means for Investors, Policymakers, and Everyday Americans
So economists are upgrading forecasts. What does that actually mean beyond wonky spreadsheets and academic debates?
For investors, the message is nuanced. A 2.2% growth environment is neither boom nor bust—it’s a Goldilocks scenario where corporate earnings can expand modestly without triggering inflation that forces aggressive Fed tightening. Equity market valuations currently reflect considerable optimism, with the S&P 500 trading near 21x forward earnings. That’s sustainable if earnings grow 8-10%, which is plausible in a 2.2% GDP environment with healthy margins.
Fixed income becomes more interesting. If the Fed cuts once in 2026 as markets expect, the yield curve should steepen, benefiting longer-duration bonds. But inflation risks argue for caution on long-duration exposure. The classic 60/40 portfolio may finally find firmer footing after years of challenges, though with returns likely in the high single digits rather than the double-digit bonanza of recent years.
Real assets deserve attention. If inflation proves persistent in the 2.5-3.0% range, commodities, real estate, and infrastructure investments provide natural hedges. Gold has already rallied to near-record levels, reflecting both inflation hedging and geopolitical risk premiums. Energy equities could benefit from both production-friendly policy and constrained global supply.
For policymakers, the upgraded outlook creates breathing room but not comfort. The Fed can likely hold rates steady rather than hiking again, but cuts depend on inflation cooperating. Fiscal authorities face the awkward reality that deficits remain high despite solid growth—a structural problem that will require painful adjustments eventually.
Trade negotiators operate in a window where economic resilience allows aggressive bargaining without immediate crisis, but the patience of affected industries has limits. The agricultural sector, for example, has absorbed significant export losses from retaliatory tariffs; continued pain could force policy adjustments.
Regulatory agencies implementing deregulation must balance growth objectives with prudential oversight. The 2008 financial crisis demonstrated the costs of regulatory capture and inadequate supervision. Finding the right equilibrium—enough oversight to prevent systemic risk, enough freedom to enable innovation—remains deeply challenging.
For everyday Americans, a 2.2% growth economy means the labor market should remain relatively healthy. Unemployment may drift up toward 4.2-4.5% but not spike toward recessionary levels. Wage growth should continue modestly above inflation, supporting real income gains. That said, the gains will be uneven—knowledge workers in tech hubs fare better than manufacturing workers in legacy industries.
Housing affordability remains challenged. With mortgage rates likely staying in the 6-7% range and home prices elevated, homeownership hurdles persist for younger households. Renters face similar pressures as construction hasn’t kept pace with household formation.
The wealth gap continues widening. Asset price appreciation disproportionately benefits the already-wealthy, while those dependent on wages face stagnant or modestly improving living standards. This dynamic, while not new, carries political implications that feed back into economic policy debates.
Perhaps most importantly, everyday Americans should recognize that consensus forecasts have error bars. A 2.2% forecast could easily become 1.5% if trade escalation accelerates or 3.0% if productivity surges. The range of outcomes remains wide, and individual circumstances vary enormously based on industry, geography, and skill level.
Looking Ahead: Confidence Tempered by Uncertainty
The story of economists Trump policies 2026 assessment is ultimately one of professionals adjusting their models to reality. The downgrade cycle of late 2024 and early 2025 reflected genuine concerns about policy direction; the upgrade cycle now underway reflects recognition that implementation has been more measured and the economy more resilient than feared.
But let’s be clear: raising forecasts from 1.8% to 2.2% doesn’t mean all is well. It means the probability of near-term recession has diminished while the likelihood of moderate, unspectacular growth has increased. It’s the economic equivalent of revising a student’s grade from a C-minus to a C-plus—better, but hardly honor roll material.
The US economic outlook 2026 remains clouded by uncertainty that no model fully captures. Geopolitical tensions from Ukraine to the Middle East to Taiwan carry tail risks. Technological disruption could accelerate or disappoint. Political polarization could intensify or ease. Climate events grow more frequent and severe, creating economic costs not fully reflected in GDP forecasts.
What economists have learned—or relearned—through this cycle is humility. The confident downgrades of early 2025 now look premature, just as the comfortable 2.4% forecasts of late 2024 proved naïve. Economic forecasting remains more art than science, particularly in an era where policy whiplash and structural change make historical relationships less reliable.
The honest assessment is this: The US economy appears positioned for moderate growth in 2026, supported by resilient fundamentals and more predictable policy than initially feared. Inflation pressures remain elevated but not runaway. The labor market continues near full employment. Financial stability looks sound. Productivity may be inflecting upward.
Yet meaningful risks persist across multiple dimensions—inflation, trade, fiscal sustainability, political dysfunction, and global spillovers. The margin for error remains thin. Policy mistakes could tip the economy toward stagnation; external shocks could disrupt even the most carefully constructed forecasts.
For those watching from outside the economics profession, the takeaway should be measured optimism tempered by realism. The worst-case scenarios of early 2025 have receded. The best-case scenarios remain plausible but not assured. What’s most likely is muddle-through growth—enough to keep recession at bay, not enough to solve structural challenges.
And perhaps that’s fitting. In an era of extraordinary change and genuine uncertainty, muddling through with modest growth and manageable risks might be the best outcome we can reasonably expect. Economists have upgraded their forecasts because that’s what the data suggests. Whether those forecasts prove accurate will depend on countless decisions—by policymakers, business leaders, consumers, and global actors—that haven’t yet been made.
The one certainty? Six months from now, economists will be revising their forecasts again. And the cycle will continue.
Discover more from The Economy
Subscribe to get the latest posts sent to your email.


Every decade or so, a headline announces that the petrodollar is dying. Every decade, the dollar proves those headlines wrong. The reason is simple, and it is buried inside a category error that has misled analysts, alarmed investors, and distorted foreign policy debates for fifty years: the petrodollar, as most people understand it, does not exist.
Here is what the data actually show. According to the Federal Reserve’s 2025 International Dollar Report, the US dollar still accounts for 58 percent of disclosed global foreign exchange reserves, roughly 88 percent of all foreign exchange transactions, and approximately 50 percent of international SWIFT payments — a share that has increased slightly in recent years. The dollar’s throne looks nothing like what the doomsday narrative describes. Understanding why requires dismantling a myth that has been half a century in the making.
What People Actually Mean by “Petrodollar”
A 1974 Diplomatic Arrangement — Not a Treaty
The petrodollar story begins, as most origin myths do, with a grain of truth. In the wake of the 1973 oil embargo, US Treasury Secretary William Simon and his deputy Gerry Parsky flew to Riyadh. The deal they assembled was elegant in its symmetry: Saudi Arabia would price oil in dollars and reinvest surplus earnings — “petrodollars” — into US Treasury securities. In exchange, Washington provided security guarantees and weapons. The arrangement was, as one State Department cable noted, a geopolitical masterstroke. But it was never a formal treaty, never legally binding across OPEC, and never the singular mechanism underwriting global dollar supremacy.
The Recycling Mechanism That Became a Myth
“Petrodollar recycling” — the idea that oil revenues flow from Riyadh back to Wall Street, endlessly funding US deficits — became doctrine in investment banks and think tanks alike. The problem is that the underlying arithmetic has quietly collapsed. Brad Setser at the Council on Foreign Relations documented the erosion with characteristic precision in early 2026: Saudi Arabia ran fiscal deficits in both 2024 and 2025. The Kingdom was a net drain on global dollar liquidity, not a supplier of it. Aramco and the Public Investment Fund were issuing international bonds. Riyadh was borrowing to fund its Vision 2030 ambitions, not recycling surplus petrodollars into Treasuries. “The glory days of the petrodollar,” Setser wrote, “are over.” What was never quite a system has, in its most literal form, ceased to function.
Why the Phrase Is Economically Misleading
Invoicing ≠ Reserve Architecture
The core error in petrodollar thinking is conflating trade invoicing with reserve currency architecture. These are not the same thing, and treating them as synonymous produces dangerous conclusions.
A country that buys oil priced in dollars does not need to hold dollars indefinitely. It needs dollars transiently — long enough to settle the transaction. If that country holds euros, it enters the FX market for milliseconds, converts, pays, and moves on. No accumulation required. The dollar’s commanding role as a reserve currency — held by central banks as a long-term store of sovereign wealth — is driven by entirely different forces: the depth and liquidity of US Treasury markets, the breadth of dollar-denominated derivative and lending markets, the dollar’s role as a global collateral asset, and the crisis-absorption capacity of the Federal Reserve through its network of swap lines.
An IMF working paper published in September 2025, drawing on data from 132 countries spanning 1990 to 2023, found precisely this: global dollar invoicing shares have remained broadly stable even as geopolitical fragmentation has accelerated, and there is “no robust evidence consistent with effective policy initiatives to reduce dollar reliance in oil exports.” Even countries geopolitically hostile to Washington continue to invoice in dollars because the network effects — embedded in contracts, hedging infrastructure, derivatives chains, and supply agreements — are not dismantled by political will alone.
The Network Effects That Actually Sustain Dollar Dominance
Harvard economist Gita Gopinath’s Dominant Currency Paradigm offers the cleaner explanation. Roughly 54 percent of global exports are invoiced in dollars, even though the United States accounts for a far smaller share of world trade. This is not the result of gunboat diplomacy or secret agreements. It is the result of network effects so deeply embedded that switching costs are prohibitive. Importers and exporters alike manage risk against a dollar baseline. Commodity markets from copper to cotton are priced in dollars. The derivative markets hedging those exposures are dollar-denominated. Changing the invoicing currency of oil does not collapse this architecture; it barely scratches it.
Dollar Shares Across Key Global Functions (2024–2025)
| Function | Dollar Share | Source |
|---|---|---|
| Global FX reserves | 56–58% | IMF COFER, Q2 2025 |
| FX transaction volume | 88% | BIS Triennial Survey 2022 |
| International SWIFT payments | ~50% (excl. intra-euro) | Federal Reserve, 2025 |
| Global export invoicing | ~54% | IMF/Gopinath, 2025 |
| Chinese firm trade invoicing (RMB) | ~25% (from 2024 data) | IMF Working Paper 2025 |
Sources: Federal Reserve; IMF COFER
Recent Developments That Expose the Myth
Saudi Deficits, Not Surpluses
The collapse of the petrodollar recycling mechanism is not speculative — it is fiscal arithmetic. With Brent crude averaging just under $70 per barrel through 2025, and Saudi Arabia’s balance-of-payments breakeven requiring roughly $90 per barrel on seven million barrels per day of exports, the Kingdom cannot generate the surpluses that the petrodollar story requires. The Gulf Cooperation Council surplus — once the engine of dollar recycling — had shrunk to roughly $200 billion in 2025 across Kuwait, UAE, Qatar, and Norway combined, with Saudi Arabia contributing a deficit of approximately $33 billion. The geopolitical story has not changed; the economic plumbing has. This is the real death of the petrodollar — not Saudi Arabia accepting yuan for oil, but Saudi Arabia having no surplus dollars to recycle at all.
The Yuan’s Modest Rise and Structural Limits
China has made genuine inroads. Yuan-settled oil trades with Russia have expanded. France’s TotalEnergies completed a modest LNG transaction with China priced in yuan in early 2024. China’s Cross-Border Interbank Payment System (CIPS) now handles approximately 30 percent of China’s cross-border trade settlements. And yet: the renminbi accounts for just 2 percent of global foreign exchange reserves and under 1 percent of global trade invoicing outside China’s direct trading partners. Capital controls, limited financial market depth, and the absence of a deep, liquid sovereign bond market comparable to US Treasuries create structural ceilings the yuan cannot penetrate through political ambition alone.
BRICS Digital Settlement: Signal or Noise?
The BRICS 2025 Johannesburg summit confirmed active prototyping of a commodity-backed digital settlement instrument. Technical working groups are simulating blockchain-based multi-currency settlements. This is real, and it signals genuine geopolitical momentum. But it also illustrates exactly why “reserve currency transitions take decades” — as the IMF has repeatedly stated. Creating a settlement instrument is the first step in a sequence that ends, much later, with reserve accumulation, financial depth, and crisis absorption. The dollar completed that sequence over 80 years, backed by two World Wars, Bretton Woods, and an incomparably liquid Treasury market. No announcement from Johannesburg accelerates that timeline meaningfully.
Policy and Market Implications
What Investors Are Getting Wrong
The perpetual “death of the petrodollar” trade — short dollars, long gold, long yuan assets — has failed repeatedly for the same structural reason: it mistakes political signaling for financial architecture replacement. The dollar’s share of global reserves has declined from 71 percent in 1999 to approximately 56 percent today, a real and meaningful shift. But that shift has not flowed to the yuan (at 2 percent, it barely registers). It has flowed to non-traditional reserve currencies: Canadian and Australian dollars, the Swiss franc, and — critically — gold. Central banks purchased a combined 2,082 tonnes of gold in 2023 and 2024, the fastest accumulation pace since World War I. This is diversification within a dollar-dominated system, not flight from it.
What Policymakers Should Actually Watch
The genuine vulnerability is not oil invoicing — it is US fiscal credibility and the weaponization of dollar infrastructure. The use of sanctions against Russia in 2022 demonstrated that dollar-denominated financial networks can be deployed as geopolitical weapons. That demonstration has accelerated the search for alternatives among countries that fear finding themselves on the wrong side of US foreign policy. This is the real mechanism of dollar erosion: not oil trades in yuan, but the slow construction of parallel payment rails — Russia’s SPFS, CIPS, and bilateral swap agreements — that reduce exposure to SWIFT cutoffs.
What Comes Next — Scenarios and Recommendations
The dollar will not collapse. Reserve currency transitions historically require financial architecture migration across decades, not policy press releases. But three distinct scenarios deserve attention from policymakers and strategists alike.
Scenario A — Status Quo Drift: Dollar dominance persists at 55–60 percent of reserves through 2035, with slow, non-disruptive diversification into non-traditional currencies and gold. Most likely outcome.
Scenario B — Accelerated Fragmentation: A major US fiscal shock (debt ceiling crisis, sovereign downgrade) or expanded sanctions regime triggers faster reallocation. Reserve share falls below 50 percent by 2032. Tail risk, but not negligible.
Scenario C — Bipolar Settlement Architecture: BRICS digital settlement becomes operational and widely adopted among the Global South, creating a parallel but interoperable system alongside SWIFT. Dollar share stable in Western bloc; declining in BRICS+ corridor. Emerging over 10–15 years.
For policymakers in Washington, the lesson is counterintuitive: the greatest threat to dollar dominance is not Saudi Arabia pricing oil in yuan. It is overusing the dollar’s weaponized infrastructure to the point that adversaries and neutrals alike invest in exits. For investors, the lesson is simpler: stop betting against the dollar’s architecture because its mythology is fraying. The myth was never what held it up.
Conclusion
The petrodollar was always more story than system — a convenient narrative that explained dollar hegemony through a single, dramatic bilateral agreement rather than through the far more prosaic reality of network effects, market depth, and institutional inertia. That narrative had consequences: it produced decades of misguided alarmism every time an oil deal was struck in yuan, and it distracted policymakers from the real vulnerabilities in dollar dominance. The dollar’s reign is long, its architecture is deep, and its nearest competitors remain structurally unready. The question is not whether the petrodollar is dying. It was never quite alive. The question is whether the United States will protect the actual foundations of monetary power — fiscal credibility, open capital markets, and restraint in financial weaponization — before those foundations quietly erode.
Discover more from The Economy
Subscribe to get the latest posts sent to your email.
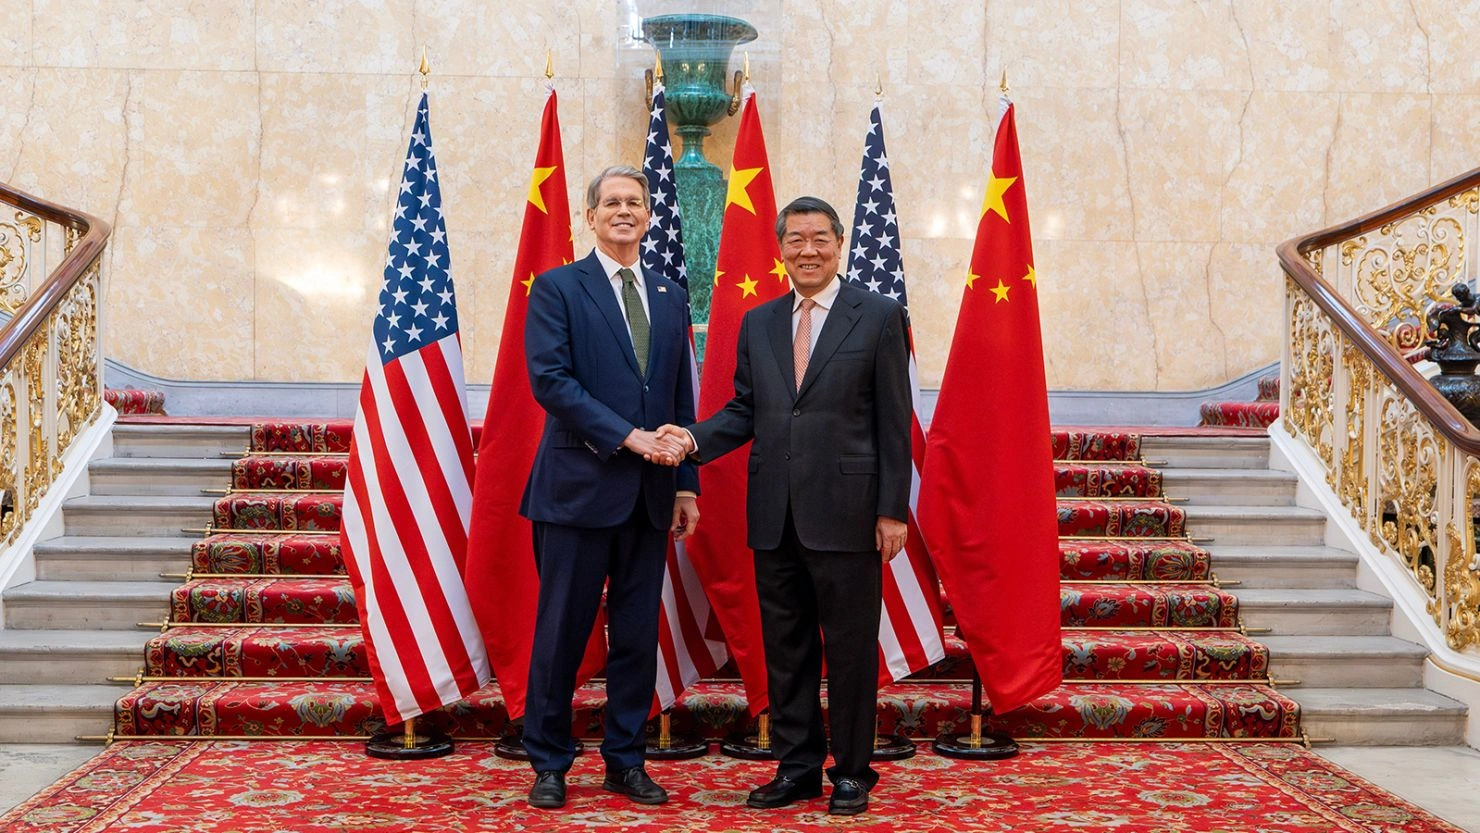
Bessent and He Lifeng meet at OECD Paris to review the Busan trade truce before Trump’s Beijing summit. Rare earths, Hormuz oil shock, and Section 301 cloud the path ahead.
The 16th arrondissement of Paris is not a place that announces itself. Discreet, residential, its wide avenues lined with haussmann facades, it is the kind of neighbourhood where power moves quietly. On Sunday morning, as French voters elsewhere in the city queued outside polling stations for the first round of local elections, a motorcade slipped through those unassuming streets toward the headquarters of the Organisation for Economic Co-operation and Development. Inside, the world’s two largest economies were attempting something rare in 2026: a structured, professional conversation.
Talks began at 10:05 a.m. local time, with Vice-Premier He Lifeng accompanied by Li Chenggang, China’s foremost international trade negotiator, while Treasury Secretary Scott Bessent arrived flanked by US Trade Representative Jamieson Greer. South China Morning Post Unlike previous encounters in European capitals, the delegations were received not by a host-country official but by OECD Secretary-General Mathias Cormann South China Morning Post — a small detail that spoke volumes. France was absorbed in its own democratic ritual. The world’s most consequential bilateral relationship was, once again, largely on its own.
The Stakes in Paris: More Than a Warm-Up Act
It would be tempting to dismiss the Paris talks as logistical scaffolding for a grander event — namely, President Donald Trump’s planned visit to Beijing at the end of March for a face-to-face with President Xi Jinping. That reading would be a mistake. The discussions are expected to cover US tariff adjustments, Chinese exports of rare earth minerals and magnets, American high-tech export controls, and Chinese purchases of US agricultural commodities CNBC — a cluster of issues that, taken together, constitute the structural skeleton of the bilateral relationship.
Analysts cautioned that with limited preparation time and Washington’s strategic focus consumed by the US-Israeli military campaign against Iran, the prospects for any significant breakthrough — either in Paris or at the Beijing summit — remain constrained. Investing.com As Scott Kennedy, a China economics specialist at the Center for Strategic and International Studies, put it with characteristic precision: “Both sides, I think, have a minimum goal of having a meeting which sort of keeps things together and avoids a rupture and re-escalation of tensions.” Yahoo!
That minimum — preserving the architecture of the relationship, not remodelling it — may, in the current environment, be ambitious enough.
Busan’s Ledger: What Has Been Delivered, and What Has Not
The two delegations were expected to review progress against the commitments enshrined in the October 2025 trade truce brokered by Trump and Xi on the sidelines of the APEC summit in Busan, South Korea. Yahoo! On certain metrics, the scorecard is encouraging. Washington officials, including Bessent himself, have confirmed that China has broadly honoured its agricultural obligations under the deal Business Standard — a meaningful signal at a moment when diplomatic goodwill is scarce.
The soybean numbers are notable. China committed to purchasing 12 million metric tonnes of US soybeans in the 2025 marketing year, with an escalation to 25 million tonnes in 2026 — a procurement schedule that begins with the autumn harvest. Yahoo! For Midwestern farmers and the commodity desks that serve them, these are not abstractions; they are the difference between a profitable season and a foreclosure notice.
But the picture darkens considerably when attention shifts to critical materials. US aerospace manufacturers and semiconductor companies are experiencing acute shortages of rare earth elements, including yttrium — a mineral indispensable in the heat-resistant coatings that protect jet engine components — and China, which controls an estimated 60 percent of global rare earth production, has not yet extended full export access to these sectors. CNBC According to William Chou, a senior fellow at the Hudson Institute, “US priorities will likely be about agricultural purchases by China and greater access to Chinese rare earths in the short term” Business Standard at the Paris talks — a formulation that implies urgency without optimism.
The supply chain implications are already registering. Defence contractors reliant on rare-earth permanent magnets for guidance systems, electric motors in next-generation aircraft, and precision sensors are operating on diminished buffers. The Paris talks, if they yield anything concrete, may need to yield this above all.
A New Irritant: Section 301 Returns
Against this backdrop of incremental compliance and unresolved bottlenecks, the US side has introduced a fresh complication. Treasury Secretary Bessent and USTR Greer are bringing to Paris a new Section 301 trade investigation targeting China and 15 other major trading partners CNBC — a revival of the legal mechanism previously used to justify sweeping tariffs during the first Trump administration. The signal it sends is deliberately mixed: Washington is simultaneously seeking to consolidate the Busan framework and reserving the right to escalate it.
For Chinese negotiators, the juxtaposition is not lost. Beijing has staked considerable domestic political credibility on the proposition that engagement with Washington produces tangible results. A Section 301 investigation, even if procedurally nascent, raises the spectre of a new tariff architecture layered atop the existing one — and complicates the case for continued compliance within China’s own policy bureaucracy.
The Hormuz Variable: When Geopolitics Enters the Room
No diplomatic meeting in March 2026 can be quarantined from the wider strategic environment, and the Paris talks are no exception. The ongoing US-Israeli military campaign against Iran has introduced a variable of potentially severe economic consequence: the partial closure of the Strait of Hormuz, the narrow waterway through which approximately a fifth of the world’s oil passes.
China sources roughly 45 percent of its imported oil through the Strait, making any disruption there a direct threat to its industrial output and energy security. Business Standard After US forces struck Iran’s Kharg Island oil loading facility and Tehran signalled retaliatory intent, President Trump called on other nations to assist in protecting maritime passage through the Strait. CNBC Bessent, for his part, issued a 30-day sanctions waiver to permit the sale of Russian oil currently stranded on tankers at sea CNBC — a pragmatic, if politically contorted, attempt to soften the energy-price spike.
For the Paris talks, the Hormuz dimension introduces a paradox. China has an acute economic interest in stabilising global oil flows and might, in principle, be receptive to coordinating with the United States on maritime security. Yet Beijing’s deep reluctance to be seen as endorsing or facilitating US-led military operations in the Middle East constrains how far it can go. The corridor between shared interest and political optics is narrow.
What Trump Wants in Beijing — and What Xi Can Deliver
With Trump’s Beijing visit now functioning as the near-term endpoint of this diplomatic process, the outlines of a summit package are beginning to take shape. The US president is expected to seek major new Chinese commitments on Boeing aircraft orders and expanded purchases of American liquefied natural gas Yahoo! — both commercially significant and symbolically resonant for domestic audiences. Boeing’s recovery from years of regulatory and reputational turbulence has made its order book a quasi-barometer of US industrial confidence; LNG exports represent a strategic diversification of American energy diplomacy.
For Xi, the calculus involves threading a needle between delivering enough to make the summit worthwhile and conceding so much that it invites criticism at home from nationalist constituencies already sceptical of engagement. China’s state media has consistently characterised the Paris talks as a potential “stabilising anchor” for an increasingly uncertain global economy Republic World — language carefully chosen to frame engagement as prudent statecraft rather than capitulation.
The OECD itself, whose headquarters serves as neutral ground for today’s meeting, cut its global growth forecast earlier this year amid trade fragmentation fears — underscoring that the bilateral relationship between Washington and Beijing carries systemic weight far beyond its two principals. A credible summit, even one short of transformative, would send a signal to investment desks and central banks from Frankfurt to Singapore that the world’s two largest economies retain the institutional capacity to manage their rivalry.
The Road to Beijing, and Beyond
What happens in the 16th arrondissement today will not resolve the structural tensions that define the US-China relationship in this decade. The rare-earth bottleneck is systemic, not administrative. The Section 301 investigation reflects a bipartisan American political consensus that China’s industrial subsidies represent an existential competitive threat. And the Iran war has introduced a geopolitical variable that neither side fully controls.
But the Paris talks serve a purpose that transcends their immediate agenda. They demonstrate, to a watching world, that diplomacy between great powers remains possible even as military operations unfold and supply chains fracture. They keep open the channels through which, eventually, more durable arrangements might be negotiated — whether at a Beijing summit, at the G20 in Johannesburg later this year, or in another European capital where motorcades slip, unannounced, through quiet streets.
The minimum goal, as CSIS’s Kennedy observed, is avoiding rupture. In the spring of 2026, with the Strait of Hormuz partially closed and yttrium shipments stalled, that minimum has acquired the weight of ambition.
Discover more from The Economy
Subscribe to get the latest posts sent to your email.

On a Friday afternoon in early March, Boeing’s stock did something it hadn’t done in months: it surged. Shares of the aerospace giant jumped as much as 4 percent — the best performance on the Dow Jones Industrial Average that day — after Bloomberg reported that the company is closing in on one of the largest aircraft sales in its 109-year history. The prize: a 500-aircraft order for 737 Max jets from China, to be unveiled when President Donald Trump makes his first state visit to Beijing since 2017 — scheduled for March 31 to April 2.
If confirmed, the deal would represent nothing less than Boeing’s formal re-entry into the world’s second-largest aviation market after years of diplomatic cold-shouldering, safety-related groundings, and trade-war turbulence. It would also cement a pattern that has quietly defined Trump’s second term: the systematic use of America’s largest exporter as a diplomatic sweetener in geopolitical negotiations.
The Numbers Behind the Boeing 737 Max China Deal
Let’s be precise about what is reportedly on the table. According to people familiar with the negotiations cited by Bloomberg, the headline figure is 500 Boeing 737 Max jets — narrowbody, single-aisle workhorses that form the backbone of Chinese domestic aviation. Separately, the two sides are in advanced discussions over a widebody package of approximately 100 Boeing 787 Dreamliners and 777X jets, though that portion of the deal is expected to be announced at a later date and would not feature in the Trump-Xi summit communiqué.
At current list prices — the 737 Max 8 carries a sticker price of roughly $101 million per aircraft — the narrowbody package alone would approach $50 billion in nominal terms before the standard deep discounts that large airline orders attract. Factor in the widebody tranche, and the full package could eventually represent the single largest bilateral aviation deal ever struck between the United States and China.
Boeing itself declined to comment. China’s Ministry of Commerce did not respond to requests outside regular hours. The White House offered no immediate statement. But the market spoke clearly enough.
A Decade of Order Drought — and Why China Needs Boeing Now
To appreciate the magnitude of this potential agreement, consider the context. China once made up roughly 25 percent of Boeing’s order book. Today, Boeing holds only 133 confirmed orders from Chinese airlines — approximately 2 percent of its total book. Investing.com That collapse in Chinese demand was not accidental. It was the deliberate consequence of a cascade of crises: the global grounding of the 737 Max following two fatal crashes in 2018 and 2019, the trade tensions of Trump’s first term, and the pandemic-era freeze on civil aviation procurement.
Yet Chinese airlines have been quietly suffocating under constrained fleet capacity. Aviation analysts and industry sources say China needs at least 1,000 imported planes to maintain growth and replace older aircraft. WKZO The country’s carriers — Air China, China Eastern, China Southern — are operating aging fleets while passenger demand has rebounded sharply. The arithmetic of Chinese aviation is unforgiving: a country of 1.4 billion people, a rapidly expanding middle class, and a domestic network that still relies heavily on Western-certified jet technology cannot simply wait indefinitely for political stars to align.
Beijing has also been hedging. China is simultaneously in talks for another 500-jet order with Airbus that would be in addition to any Boeing deal — negotiations that have been in on-off discussions since at least 2024. WKZO But Airbus has its own capacity constraints and delivery backlogs. The reality is that both European and American planemakers are needed to feed China’s aviation appetite, which gives Boeing considerable strategic leverage — if it can navigate the politics.
Trump’s Boeing Diplomacy: A Playbook Refined
There is a recognizable pattern here, and it is worth naming explicitly. Trump has used Boeing as a tool to sweeten accords with other governments Yahoo Finance, and the China deal fits squarely within that framework. Earlier in his second term, large Boeing orders from Gulf carriers and Southeast Asian airlines followed Trump diplomatic visits — deals that generated political headlines and tangible employment commitments in American manufacturing states.
The Beijing summit, however, would be the most significant deployment of this strategy yet. US-China trade tensions have been acute in early 2026. Trump threatened to impose export controls on Boeing plane parts in Washington’s response to Chinese export limits on rare earth minerals. Yahoo Finance During earlier trade clashes, Beijing ordered Chinese airlines to temporarily stop taking deliveries of new Boeing jets — before resuming later that spring. WKZO
That on-off pattern illustrates the extraordinary vulnerability of commercial aviation to geopolitical temperature. Unlike soybeans or semiconductors, a Boeing 737 Max is not a fungible commodity. It requires years of certified maintenance infrastructure, pilot training, and regulatory framework built around American aviation standards. Both sides know this, which is precisely why aircraft orders have become such potent bargaining chips.
The planned summit structure — Trump in Beijing from March 31 to April 2, followed by Xi visiting Washington later in the year — also suggests a two-stage negotiation architecture. The 737 Max order would serve as a confidence-building gesture at the first meeting; the widebody 787 and 777X tranche would follow as trust is consolidated.
Boeing’s Recovery Trajectory: Why Timing Matters
For Boeing CEO Kelly Ortberg, the timing of a China breakthrough could scarcely be more critical. Boeing’s total company backlog grew to a record $682 billion in 2025, primarily reflecting 1,173 commercial aircraft net orders for the year, with all three segments at record levels. Boeing Yet the Chinese market has remained conspicuously absent from that recovery story.
Boeing has achieved FAA approval to increase 737 Max production to 42 jets per month, a significant step toward restoring manufacturing capacity, and the company plans to raise 787 Dreamliner output to 10 aircraft per month during 2026. Investing.com In short, for the first time in several years, Boeing actually has the industrial capacity to absorb a massive new order. Management has targeted approximately 500 737 deliveries in 2026 and 787 deliveries of roughly 90–100 aircraft, while targeting positive free cash flow of $1–3 billion for the year. TipRanks
A confirmed China order of this scale would not merely boost the backlog — it would validate the entire recovery narrative. It would signal to Wall Street that the 737 Max safety rebound is complete, that Chinese regulators have definitively recertified the aircraft, and that geopolitical risk has sufficiently receded to justify multi-year procurement commitments. As Reuters reported, Boeing’s share price rose 3.7 percent on the news — but analysts caution that several sticking points remain unresolved, and a deal is not yet assured.
Aviation Ripple Effects: What a China Mega-Deal Means for Global Travelers
The significance of a Boeing 737 Max China order in 2026 extends well beyond corporate balance sheets. Chinese carriers operating newer, more fuel-efficient 737 Max jets would dramatically expand route networks — both domestically and internationally. The 737 Max 10, capable of flying roughly 3,300 nautical miles at maximum range, opens trans-regional routes that older Chinese narrowbody fleets cannot economically serve.
For the global travel industry — and for the Expedia-era traveler booking multi-stop itineraries across Asia — this translates into more competitive airfares, denser flight schedules out of Chinese hub airports, and expanded connectivity between Chinese secondary cities and international destinations. Tourism economists estimate that each percentage point increase in seat capacity on a major international corridor correlates with a 0.6 to 0.8 percent increase in inbound tourist arrivals. A Chinese aviation expansion of this magnitude, fuelled by 500 new-generation jets, would register meaningfully in global travel demand forecasts through the late 2020s.
The geopolitical calculus cuts the other way too. Should talks collapse — perhaps due to escalation over Taiwan, renewed rare-earth export controls, or a postponement of the Trump visit, which Bloomberg noted could occur if the ongoing US-Iran situation deteriorates — Boeing’s China exposure remains an open wound rather than a healed scar.
Historical Context: The Ghosts of Boeing-China Deals Past
This would not be the first time a US presidential visit to China generated a headline Boeing order. In 2015, during Barack Obama’s final engagement with Xi Jinping, Chinese carriers placed orders for over 300 Boeing jets — a deal that at the time was celebrated as a pillar of the bilateral commercial relationship. It took less than four years for that relationship to unravel under the dual pressures of the MAX crisis and Trump’s first-term tariffs.
The lesson is not that such deals are illusory. It is that they are fragile by design — deeply dependent on the political weather. A Boeing 500-plane order tied to Trump’s Beijing summit is, in that sense, simultaneously a genuine commercial transaction and a diplomatic performance. Its durability will depend less on what is signed in Beijing in April than on what is negotiated, month by month, in the trade relationship that follows.
Forward Outlook: Promise, Risk, and the Long Game
Boeing’s aircraft stand to feature prominently in whatever trade framework emerges from the Trump-Xi summit. But seasoned observers of US-China commercial aviation will note that a similar mega-deal euphoria surrounded Airbus last year — and ultimately failed to materialize. Given the fraught geopolitical backdrop, Boeing’s order bonanza is not assured, and two people familiar with the talks have specifically cautioned that deal completion remains uncertain. Yahoo Finance
What is certain is this: the structural demand is real, the production capacity is finally in place, and the political incentive on both sides has rarely been stronger. For Boeing, recapturing even a fraction of what was once a market that constituted a quarter of its order book would represent a transformation of its strategic position. For China’s airlines, new Boeing jets mean competitive fleets, lower operating costs, and the capacity to serve a travelling public that has never stopped wanting to fly.
The planes, as ever, are ready. The question is whether the politics will let them take off.
Discover more from The Economy
Subscribe to get the latest posts sent to your email.

Pakistan Gulf Investment Outflows 2026: Peace Deal Stakes Explained

Canada Trade Diversification 2026: China, Indonesia, UAE Deals Explained

US Forced-Labour Tariffs on 60 Countries: The Hidden Trade Shock of 2026

Global Central Banks 2026: Fed, BoE and BoJ Decisions Could Reshape Markets

Gulf Capital Retreat From Pakistan 2026: UAE Loan Freeze & What It Means

Pakistan’s Most Reliable Export Is Its People: Remittances Hit $41.6 Billion, Overtaking Total Exports

Indonesia’s Confidence Problem: Record Investment, a Sinking Rupiah, and a Widening Credibility Gap

Down But Not Out: Inside the Slow Sinking of Russia’s War Economy

China’s Growth Slips to a Four-Year Low: Why Beijing Still Won’t Pull the Stimulus Trigger

The Johor-Singapore Corridor: How Malaysia Became Southeast Asia’s AI Infrastructure Powerhouse

Canada’s Economy ‘On Pause’: Inside the CUSMA Deadline That Passed Without a Deal

Dubai’s Millionaire Magnet: How the UAE Turned Middle East Turmoil Into a Capital Safe-Haven Boom

Britain’s Sixth Prime Minister in a Decade: What Starmer’s Exit Means for Gilts, Sterling and Your Portfolio

Anthropic Offers Up to $600,000 Salary for Critical IPO Role as AI Giant Prepares for Wall Street Debut

Carry Trade Unwind 2026: How the Yen’s Snapback Triggered a Global Margin Call

AI Bubble Warning 2026: Why BIS, IMF and Bank of England Fear a Market Crash

BRICS De‑Dollarization Strategy Takes Shape with $15 Billion Local‑Currency Push

The AI Super Bubble Is Ready to Burst

Russia Bans Diesel Exports 2026: Global Fuel Market Impact Explained

Strait of Hormuz Blockade 2026: Oil Prices Surge 9% as US-Iran Conflict Reignites

Private Credit Warning: Most BDCs Turn Unprofitable in 2026, Reuters Finds

IMF Cuts Pakistan Growth Forecast, Raises Inflation to 8.4%

Bitcoin $150k Milestone Achieved as US Sovereign Crypto Pivot Looms
Gulf Capital Retreat From Pakistan 2026: UAE Loan Freeze & What It Means

India Economic Rise 2026: How the Subcontinent Toppled Japan

Strait of Hormuz 2026: Why Markets Still Don’t Trust It’s Open

China Housing Market Turnaround: White‑List Model Stabilises Prices

Chipmakers Just Lost 6.7% in Two Days: Inside the Great AI Trade Rotation
-

 Markets & Finance7 months ago
Top 15 Stocks for Investment in 2026 in PSX: Your Complete Guide to Pakistan’s Best Investment Opportunities
-

 Analysis5 months ago
Johor’s Investment Boom: The Hidden Costs Behind Malaysia’s Most Ambitious Economic Surge
-

 Analysis5 months ago
Top 10 Stocks for Investment in PSX for Quick Returns in 2026
-

 Analysis6 months ago
Brazil’s Rare Earth Race: US, EU, and China Compete for Critical Minerals as Tensions Rise
-

 Banks6 months ago
Best Investments in Pakistan 2026: Top 10 Low-Price Shares and Long-Term Picks for the PSX
-

 Investment7 months ago
Top 10 Mutual Fund Managers in Pakistan for Investment in 2026: A Comprehensive Guide for Optimal Returns
-

 Global Economy7 months ago
15 Most Lucrative Sectors for Investment in Pakistan: A 2025 Data-Driven Analysis
-

 Global Economy7 months ago
Pakistan’s Export Goldmine: 10 Game-Changing Markets Where Pakistani Businesses Are Winning Big in 2025