
Asia
China’s Economy in 2025: Resilience Amid Headwinds as GDP Hits 5% Target Despite Q4 Slowdown
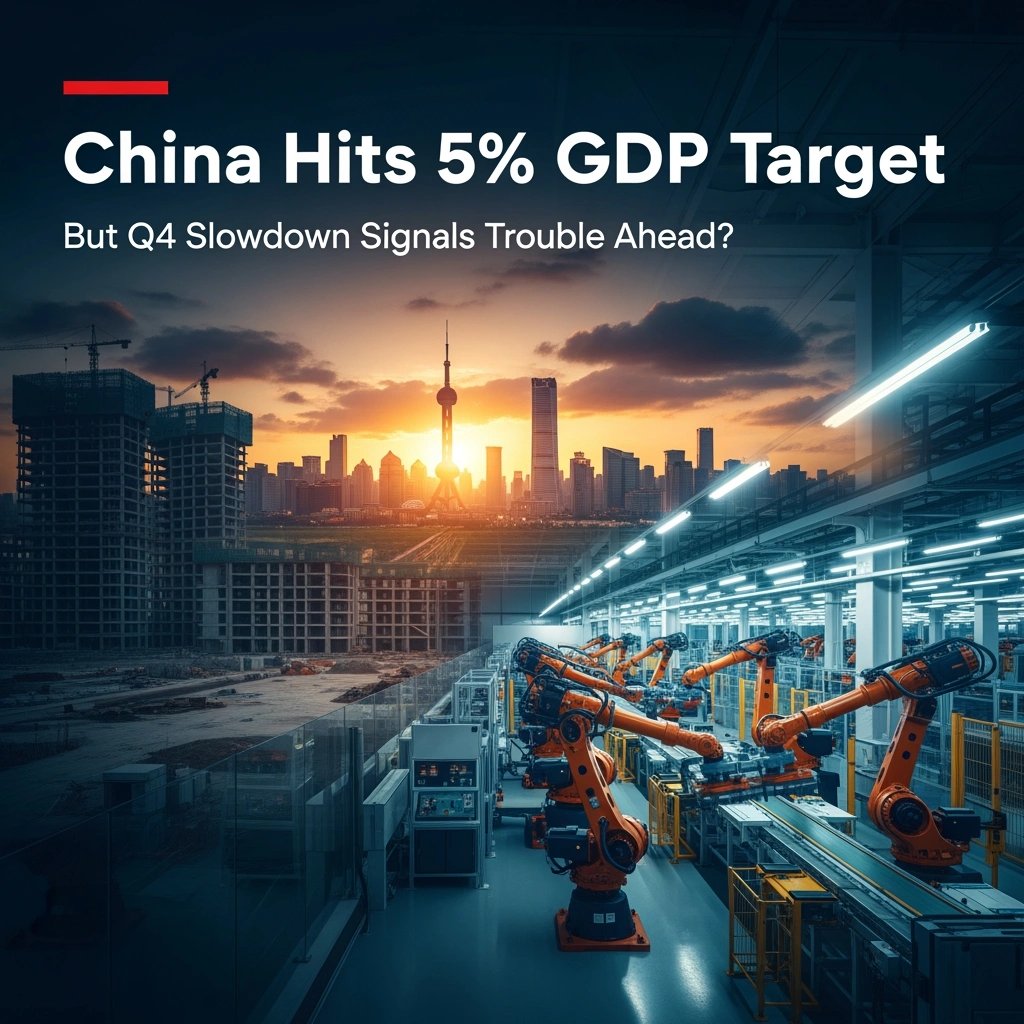
On a gray January morning in Shenzhen, the production lines at BYD’s sprawling electric vehicle plant hum with algorithmic precision—robotic arms fitting battery cells, workers in crisp uniforms monitoring quality control dashboards. Sixty kilometers north, in the dormant construction zones of Evergrande’s unfinished Guangzhou towers, cranes stand motionless against the skyline, monuments to China’s protracted property crisis. These contrasting scenes capture the dual narrative of China’s economy in 2025: a nation that met its official growth target through manufacturing resilience and export diversification, yet confronts deepening structural headwinds that cloud the path ahead.
On January 17, 2026, the National Bureau of Statistics delivered a mixed verdict on China’s economic performance. Full-year GDP growth reached 5.0% for 2025—exactly meeting Beijing’s “around 5%” target and defying earlier skepticism from global forecasters. Yet beneath this headline achievement lies a more complicated reality: fourth-quarter growth decelerated sharply to 4.5% year-on-year, down from 4.8% in Q3 and marking the slowest quarterly expansion in three years. The bifurcation between official success and underlying fragility raises fundamental questions about sustainability, policy effectiveness, and what 2026 holds for the world’s second-largest economy.
The Numbers Behind the 5% Target: Precision or Fortune?
China’s achievement of its 5% GDP growth target represents both a policy victory and a testament to the government’s willingness to deploy fiscal and monetary stimulus when needed. The 5.0% full-year figure slightly exceeded the consensus analyst forecast of 4.9% compiled by Reuters in December 2025, though the margin was razor-thin. For context, this marks a deceleration from 2024’s 5.2% growth and continues the gradual cooling trend from the 8.4% post-COVID rebound in 2021.
According to data released by the NBS, China’s nominal GDP reached approximately 135 trillion yuan ($18.5 trillion) in 2025, cementing its position as the dominant economic force in Asia despite persistent speculation about when—or whether—it will surpass the United States in absolute terms. The quarterly breakdown reveals a pattern of diminishing momentum:
- Q1 2025: 5.3% y/y
- Q2 2025: 5.1% y/y
- Q3 2025: 4.8% y/y
- Q4 2025: 4.5% y/y
This sequential deceleration underscores that China’s growth trajectory remains under pressure from structural forces that stimulus measures can only partially offset. As Bloomberg economics noted in its post-release analysis, hitting the target “required considerable policy support in the final months of the year, including accelerated infrastructure spending and interest rate cuts by the People’s Bank of China.”
The precision of landing at exactly 5.0% has inevitably sparked questions about data reliability—a perennial concern among China watchers. While most mainstream economists accept the broad directional accuracy of NBS figures, some analysts point to discrepancies between GDP growth and proxy indicators like electricity consumption and freight volumes, which showed weaker trajectories in late 2025. Nevertheless, independent estimates from institutions like the Organisation for Economic Co-operation and Development have broadly validated China’s reported growth rates when adjusted for statistical methodology differences.
Manufacturing’s Unexpected Lift: High-Tech Sectors Drive Industrial Resilience
Against expectations of broad-based weakness, China’s manufacturing sector emerged as the surprising pillar of 2025’s growth story. Industrial production expanded 5.8% for the full year, outpacing both services (5.1%) and construction (3.2%), according to NBS sectoral breakdowns. This manufacturing strength defied Western narratives of exodus and “de-risking,” instead reflecting a rapid evolution toward higher-value production.
The star performers were concentrated in advanced manufacturing and green technology:
- Electric vehicles and batteries: Production surged 32% year-on-year, with companies like BYD, CATL, and Nio capturing expanding global market share despite European and American tariff threats
- Solar panel manufacturing: Output jumped 51%, driven by both domestic installation booms and exports to emerging markets in Southeast Asia, Latin America, and the Middle East
- Semiconductor equipment: Despite US export controls, China’s domestic chip-making equipment production grew 28%, narrowing technological gaps in legacy node production
- Industrial robotics: Manufacturing of automation equipment rose 19%, supplying both domestic factories upgrading production lines and international buyers
As Caixin Global reported in December 2025, foreign direct investment in China’s high-tech manufacturing sectors actually increased 7.3% despite overall FDI declining 11.2%—suggesting that while some low-margin producers are relocating to Vietnam and Mexico, sophisticated operations requiring deep supply chains and skilled workforces continue to favor Chinese locations.
The Purchasing Managers’ Index (PMI) for manufacturing hovered around the 50.0 threshold throughout most of 2025, oscillating between contraction and modest expansion. However, the new export orders sub-index strengthened markedly in Q4, rising from 48.2 in September to 51.3 in December—the highest reading since early 2023. This improvement reflected both the ongoing diversification of export markets away from the US and Europe, and the competitive advantage Chinese manufacturers maintained through automation investments that reduced unit labor costs.
“China’s manufacturing resilience in 2025 wasn’t about volume—it was about value,” noted George Magnus, research associate at Oxford University’s China Centre, in a Financial Times interview. “The transition from ‘world’s factory’ to ‘world’s advanced factory’ is happening faster than most Western policymakers recognize, particularly in sectors like EVs, batteries, and renewable energy equipment.”
The Persistent Property Drag: A Crisis Enters Its Fourth Year
If manufacturing provided the accelerator for China’s 2025 growth, the property sector remained the brake pedal pressed firmly to the floor. Real estate investment contracted 9.8% for the full year, marking the fourth consecutive year of decline since the sector’s peak in 2021. New construction starts plummeted 21.4%, while property sales by floor area fell 15.3%, according to NBS data.
The numbers tell a story of a sector in structural decline rather than cyclical downturn. Despite unprecedented government intervention—including interest rate cuts, reduced down payment requirements, relaxed purchase restrictions in most tier-2 and tier-3 cities, and direct state purchases of unsold inventory—the property market failed to stabilize in 2025. Home prices in 70 major cities tracked by the NBS declined 4.7% on average, with steeper drops of 8–12% in smaller cities burdened by massive oversupply.
The human dimension of this crisis grew more acute. As The Economist detailed in its October 2025 cover story, millions of Chinese families remain trapped in “pre-sale purgatory”—having paid deposits for apartments whose construction stalled when developers like Evergrande, Country Garden, and Sunac defaulted. While Beijing’s “whitelist” financing program channeled approximately 4 trillion yuan to complete roughly 3.2 million stalled units, an estimated 2–3 million additional units remain frozen in legal and financial limbo.
The ripple effects extended far beyond construction sites:
- Local government finances: Property-related revenues (land sales and related taxes) comprise roughly 30% of local government income and fell another 18% in 2025, forcing municipalities to slash services and delay infrastructure projects
- Household wealth: Real estate represents approximately 60% of Chinese household assets; the sustained price decline eroded consumer confidence and discretionary spending capacity
- Financial sector stress: Non-performing loan ratios at smaller regional banks ticked upward to 2.8% as property developers, construction firms, and related businesses defaulted
- Demographic feedback loop: Collapsing property sector employment (down an estimated 6 million jobs since 2021) exacerbated youth unemployment concerns and accelerated marriage/birth rate declines
The central government’s approach evolved from crisis management to managed decline. Policymakers increasingly signal acceptance that property will not return to its former role as a growth engine. The 14th Five-Year Plan (2021-2025) targeted reducing real estate’s GDP share from roughly 25% to below 20%, and 2025 data suggests this structural shift is well underway—though the transition costs in terms of slower growth and fiscal pressure remain substantial.
“The property crisis is no longer an emergency—it’s the new normal,” commented Charlene Chu, senior analyst at Autonomous Research, to The Wall Street Journal. “The question isn’t when recovery comes, but how China rebalances its growth model away from this massive sector while avoiding a hard landing.”
Deflation Risks and Weakening Domestic Demand: The Consumption Conundrum
Perhaps the most concerning development in China’s 2025 economic performance was the persistence of deflationary pressure and anemic household consumption. The consumer price index (CPI) rose just 0.4% for the full year—barely above zero and well below the 3% target. More troublingly, the producer price index (PPI) contracted 2.2%, extending the deflation in factory-gate prices that began in late 2022.
This deflationary environment reflected overcapacity in manufacturing, weak pricing power, and—most significantly—tepid consumer demand. Retail sales grew 4.2% in nominal terms for 2025, but adjusted for inflation, real growth was only around 3.8%, the weakest since the pandemic year of 2020 (excluding lockdown months). Adjusted for China’s GDP size and growth trajectory, household consumption contributed just 3.1 percentage points to the 5% overall growth—far below the 4–5 percentage point contribution typical of developed economies.
Several factors suppressed consumer spending:
Property wealth effect: As home values declined and millions faced uncertainty about incomplete pre-purchased apartments, households curtailed spending and increased precautionary saving
Labor market anxiety: While official urban unemployment remained around 5.0%, youth unemployment (ages 16-24, excluding students) was suspended from publication in mid-2023 after hitting record highs. When resumed with revised methodology in early 2025, it showed rates around 17–18%—signaling ongoing stress for young workers
Income inequality: The GINI coefficient remained elevated above 0.46, and wage growth for median workers lagged behind GDP growth, concentrating income gains among higher earners with lower marginal propensity to consume
Cultural shift toward thrift: As CNBC reported, the “lying flat” (tangping) and “let it rot” (bailan) movements reflected deeper malaise among younger Chinese increasingly skeptical about consumption-driven status competition
The government deployed various consumption stimulus measures throughout 2025—cash subsidies for appliance and auto purchases, expanded consumer credit programs, local consumption vouchers—yet these failed to ignite sustained spending momentum. The household savings rate actually increased to approximately 35% of disposable income, suggesting families prioritized balance sheet repair over consumption.
This consumption weakness creates a vicious cycle: weak household spending constrains business revenues and employment, which further depresses income growth and confidence, feeding back into consumption restraint. Breaking this cycle requires either dramatic income redistribution (politically complex), a new source of household wealth creation to replace property (unclear where this emerges), or simply time for consumers to rebuild confidence—a process that could take years.
Trade Dynamics: Export Diversification and the Tariff Shadow
China’s external sector provided crucial support in 2025, though the picture was more nuanced than aggregate trade figures suggested. Total exports grew 5.9% in dollar terms, while imports expanded just 2.1%, resulting in a record trade surplus exceeding $1 trillion for the first time.
However, this topline performance masked significant geographical and compositional shifts. Exports to the United States—still China’s largest single-country destination—contracted 3.7% as buyers front-ran potential tariff increases and diversified supply chains. Exports to the European Union fell 1.2% amid both economic weakness in Germany and Italy and rising anti-subsidy sentiment regarding Chinese EVs and solar panels.
The export growth came almost entirely from alternative markets:
- ASEAN countries: Exports surged 14.2%, making Southeast Asia collectively China’s largest regional trading partner, driven by both intermediate goods for local manufacturing and final consumption goods
- Latin America: Exports jumped 16.8%, particularly vehicles, machinery, and electronics to Brazil, Mexico, and Chile
- Middle East and North Africa: Exports increased 11.3%, led by infrastructure equipment, telecommunications hardware, and consumer electronics
- Belt and Road Initiative countries: Trade with BRI partners grew 12.7%, reflecting infrastructure investments, preferential trade agreements, and deliberate diversification strategy
Equally significant was the product composition shift. While traditional low-margin goods like textiles and footwear saw export declines, high-value manufactured goods surged:
- Electric vehicles: Export volume exceeded 4.2 million units (up 38%), making China the world’s largest auto exporter
- Lithium batteries: Exports rose 27%, capturing nearly 60% of global market share
- Solar panels and components: Exports jumped 43% despite trade barriers in Western markets
- Consumer electronics: Exports of smartphones, laptops, and smart home devices grew 8.4%, with Chinese brands like Xiaomi, Oppo, and Transsion gaining market share in developing countries
The looming shadow over this export performance was geopolitical fragmentation and potential US tariff escalation. President Donald Trump’s return to office in January 2025 brought renewed threats of comprehensive tariffs on Chinese imports—though the feared “universal 60% tariff” failed to materialize in his first year, with more targeted measures imposed instead. Analysis from Goldman Sachs suggested that even a 25% across-the-board US tariff would shave only 0.3–0.5 percentage points from China’s GDP growth, given reduced exposure and supply chain adaptation since the 2018-2019 trade war.
“China’s export machine has proven remarkably adaptable,” said Iris Pang, chief China economist at ING, in a December 2025 note. “The diversification strategy is working—dependence on US and European markets has fallen from about 35% of total exports in 2018 to below 25% in 2025. That creates resilience, though it doesn’t eliminate vulnerability to coordinated Western restrictions on technology sectors.”
Policy Response: Stimulus Calibration and the Limits of Intervention
Beijing’s policy response to slowing growth in 2025 evolved from initial restraint to gradual escalation, though authorities remained notably more cautious than during previous slowdowns. The comprehensive stimulus deployed after the 2008 financial crisis or even the COVID reopening support proved absent—reflecting both debt sustainability concerns and philosophical shift toward “high-quality development” over raw GDP growth.
Monetary policy remained accommodative but relatively modest:
- The People’s Bank of China cut the one-year loan prime rate (LPR) by a cumulative 35 basis points across three reductions
- Reserve requirement ratios were lowered by 50 basis points to increase lending capacity
- Medium-term lending facility operations injected approximately 3.2 trillion yuan in liquidity
- Yet real interest rates remained positive and credit growth stayed around 9%—hardly the flood of cheap money seen in previous cycles
Fiscal policy became more assertive, particularly in the second half:
- The official fiscal deficit target was raised from 3% to 3.8% of GDP mid-year
- Special local government bond issuance exceeded 4 trillion yuan to fund infrastructure
- Direct subsidies for consumption (trade-ins, electric vehicle purchases) totaled roughly 300 billion yuan
- However, the “augmented” deficit (including off-budget borrowing) actually declined to around 12% of GDP from 14% in 2024, suggesting fiscal consolidation at local government level offset central stimulus
Structural reforms advanced incrementally:
- Hukou (household registration) restrictions were further relaxed in 100+ cities to promote labor mobility
- Services sector opening accelerated in healthcare, education, and finance
- Technology self-sufficiency investments continued, with semiconductor subsidies exceeding $50 billion
- State-owned enterprise reforms emphasized profitability over employment/output targets
The overall policy approach reflected what officials termed “precise and forceful” intervention—targeted support for manufacturing and infrastructure while allowing property and inefficient sectors to contract. This calibration achieved the 5% growth target but left structural imbalances substantially unaddressed.
The constraint on more aggressive stimulus was clear: debt. China’s total debt-to-GDP ratio reached approximately 295% by end-2025 (including household, corporate, and government debt), up from 285% in 2024 despite deleveraging rhetoric. Local government financing vehicle (LGFV) debt alone exceeded 60 trillion yuan, with mounting hidden obligations from “white-listed” property completion programs and infrastructure commitments. The International Monetary Fund warned in its October 2025 Article IV consultation that China’s debt trajectory was unsustainable without either much slower growth or serious fiscal reforms including property tax implementation and social security expansion.
“Beijing faces a trilemma,” noted Michael Pettis, finance professor at Peking University, writing in Foreign Policy. “They want high growth, low debt, and no painful structural adjustment. They can pick two at most—and 2025 showed them prioritizing growth and delaying adjustment, which means debt continues climbing.”
Comparative Context: China Versus Other Major Economies
Placing China’s 5% GDP growth in global perspective reveals both relative strength and absolute deceleration. Among major economies in 2025:
- United States: Grew approximately 2.1%, supported by resilient consumer spending and immigration-driven labor force growth
- Eurozone: Expanded just 0.8%, with Germany entering technical recession and France constrained by fiscal pressures
- Japan: Managed 1.2% growth, the strongest performance in five years, aided by tourism recovery and yen depreciation
- India: Surged 6.7%, maintaining its position as the world’s fastest-growing major economy, though questions persist about data quality and sustainability
China’s 5% thus outperformed all developed economies and most emerging markets outside South Asia. However, this comparison obscures the more relevant question: performance relative to potential. China’s working-age population is shrinking (down 0.4% in 2025), productivity growth has slowed from 6–7% annually in the 2000s to perhaps 2–3% currently, and the capital stock is nearing saturation in many regions. Economists estimate China’s “potential growth rate”—the maximum sustainable pace without generating inflation or imbalances—has fallen to around 4.5–5.0%.
By this standard, China’s 2025 performance represented growth at or even slightly above potential—which is why authorities could achieve the target while deflationary pressures persisted. The economy isn’t running “hot”; it’s likely running near capacity given structural constraints.
The more troubling comparison is historical Chinese performance. Annual growth rates have fallen steadily:
- 2010-2015 average: 8.1%
- 2016-2019 average: 6.7%
- 2020-2025 average: 5.0% (including COVID volatility)
This deceleration reflects demographic headwinds, diminishing returns to capital accumulation, technology frontier catching-up completion, and rebalancing away from investment toward consumption (which generates less GDP growth per unit of spending). While the slowdown is in some sense “natural” for a maturing economy, the speed of deceleration and the inability to achieve consumption-driven growth create political and social challenges for a system whose legitimacy rests partly on delivering rising living standards.
Demographic Destiny: The Long Shadow of Population Decline
No analysis of China’s 2025 economic performance would be complete without acknowledging the demographic shift that will increasingly constrain future growth. In early 2025, China’s National Bureau of Statistics confirmed that the population fell for the third consecutive year, declining by approximately 1.3 million to roughly 1.409 billion. More critically, the working-age population (15-59 years) contracted by 6.8 million, while the cohort aged 60+ grew by 5.5 million.
The birth rate fell to a historic low of 6.2 births per 1,000 people, down from 6.7 in 2024 and 10.5 as recently as 2020. Despite policy reversals—the one-child policy abandoned in 2016, two-child policy expanded in 2021, three-child policy introduced with incentives—Chinese couples are choosing to have fewer children due to crushing costs of education and housing, reduced economic optimism, and evolving social values among younger generations.
Demographic projections suggest China’s working-age population could shrink by 170-200 million by 2050—a labor force decline roughly equivalent to losing the entire workforce of Brazil or Indonesia. This creates multiple economic headwinds:
- Labor supply constraints: Fewer workers means slower potential GDP growth unless offset by dramatic productivity gains
- Consumption pressure: Elderly populations consume less than working-age adults, particularly in societies with weak pension systems
- Fiscal burden: Supporting a growing elderly population with a shrinking working-age tax base requires either higher taxes, lower benefits, or both
- Innovation concerns: Younger populations drive entrepreneurship and technology adoption; aging may reduce economic dynamism
Some economists argue that automation, artificial intelligence, and productivity improvements can offset demographic decline. China’s robotics deployment provides evidence for this optimism—the country installed more industrial robots in 2025 than the rest of the world combined. However, productivity growth ultimately depends on innovation, and China’s innovation ecosystem faces challenges from US technology restrictions, reduced foreign technology inflows, and educational system deficiencies in fostering creativity.
“Demography isn’t destiny, but it is gravity,” noted Nicholas Lardy, senior fellow at the Peterson Institute for International Economics. “China can grow faster than demographic fundamentals suggest if productivity accelerates dramatically. But that requires reforms—education, innovation, competition—that create political discomfort. The path of least resistance is slower growth, and that seems to be what we’re getting.”
The 2026 Outlook: Targets, Risks, and Scenarios
As China’s policymakers convene for the annual “Two Sessions” meetings in March 2026, they face the delicate task of setting realistic growth targets while maintaining confidence. Market consensus expects Beijing to announce an “around 5%” target for 2026, possibly with language allowing for 4.5–5.5% flexibility. This would represent continuity with 2025 while acknowledging ongoing headwinds.
The base case scenario for 2026 envisions:
- GDP growth: 4.7–5.2%, supported by modest stimulus, manufacturing resilience, and low baseline effects from 2025’s weak Q4
- Continued property sector contraction, but at a decelerating pace (perhaps -5% investment versus 2025’s -9.8%)
- Export growth moderating to 3–4% as global demand softens and trade barriers accumulate
- Consumption growth remaining weak around 4%, absent major policy shifts
- Inflation staying subdued with CPI around 0.8–1.2%, below target but avoiding outright deflation
Key upside risks include:
- More aggressive fiscal stimulus if growth threatens to fall below 4.5%
- Stronger-than-expected global economic performance boosting export demand
- Property market stabilization if confidence rebuilds and younger buyers re-enter
- Technology breakthrough in semiconductors or other sectors reducing import dependence
- Geopolitical détente with the US enabling trade normalization
Offsetting downside risks:
- US tariff escalation to 30–60% levels severely impacting exports
- Property crisis deepening into financial system contagion
- Local government debt crisis forcing fiscal contraction
- Demographic decline accelerating faster than productivity improvements
- Taiwan crisis precipitating comprehensive Western sanctions
Analysts at UBS outline three scenarios: an optimistic “soft landing” with 5.5% growth driven by consumption recovery; a baseline “muddling through” with 4.8% growth similar to 2025; and a pessimistic “hard adjustment” with 3.5% growth if property and debt crises intensify. They assign probabilities of 20%, 60%, and 20% respectively—suggesting high confidence in continued low-to-mid-single-digit growth, but uncertainty about exact trajectory.
Conclusion: Managed Slowdown or Gradual Stagnation?
China’s 2025 economic performance defies simple characterization. On one hand, meeting the 5% growth target amid fierce headwinds—prolonged property collapse, geopolitical tensions, demographic decline, weak domestic demand—represents genuine achievement. The manufacturing sector’s evolution toward high-value production, export market diversification, and technological advancement in key industries suggest enduring competitive strengths. The government demonstrated both willingness and capacity to deploy stimulus when needed, avoiding the hard landing that pessimists have predicted for years.
Yet the celebration must be tempered by uncomfortable realities. The Q4 slowdown to 4.5% growth—the weakest quarterly performance in three years—reflects fading momentum as stimulus effects wane. Deflationary pressures, weak consumption, property sector distress, and mounting debt burdens remain unresolved. Most concerningly, the policy response in 2025 relied on familiar playbooks—infrastructure spending, export promotion, manufacturing support—rather than the painful structural reforms needed to transition toward consumption-driven, sustainable growth.
The fundamental question facing China is whether the current trajectory represents a “managed slowdown” to a sustainable new normal around 4–5% growth, or the beginning of a gradual stagnation that could see growth drift toward 3% or lower by decade’s end absent major reforms. The answer depends on factors both within and beyond Beijing’s control: the willingness to tolerate painful adjustment in property and local government finances, the success of rebalancing toward consumption, demographic trends, technological self-sufficiency progress, and the evolution of US-China relations under changing American leadership.
For global investors, businesses, and policymakers, China’s 2025 performance reinforces a nuanced view: neither the miracle growth story of past decades nor the collapse narrative popular among certain analysts, but rather a complex, slowly-evolving economy with enduring strengths and mounting structural challenges. The dragon is neither soaring nor crashing—but its flight path is unmistakably descending.
As 2026 unfolds, watching how Beijing balances growth targets, debt sustainability, structural reform, and social stability will provide crucial insights into whether China can navigate this historic transition successfully—or whether the contradictions will eventually force a more disruptive reckoning. The stakes extend far beyond China’s borders: the trajectory of the world’s second-largest economy, largest manufacturer, and largest trading nation will shape global growth, inflation dynamics, commodity markets, and geopolitical stability for years to come.
The verdict on China’s 2025 economic performance is thus mixed—an achievement of official targets secured through familiar policy tools, but underlying fragilities that threaten sustainability. The real test lies not in meeting one year’s growth target, but in building a foundation for stable, consumption-driven prosperity in the decade ahead. On that more fundamental measure, the jury remains out, and the evidence from 2025 offers reasons for both cautious optimism and persistent concern.
Discover more from The Economy
Subscribe to get the latest posts sent to your email.


On a muggy Tuesday in March, Taro Yamamoto — operations director of a mid-sized Osaka precision-parts maker — stepped off a flight into Ho Chi Minh City for the third time in six months. He wasn’t scouting for components. He was scouting for customers. His domestic order book had contracted for the fourth consecutive year. His shop floor was greying, and two machine operators had retired with no replacements in sight. Back in Tokyo, the Tokyo Stock Exchange’s new capital-efficiency requirements had made inaction financially untenable. Across Japan, thousands of mid-sized executives are making exactly this calculation. The destination is almost always the same. The logic, once you see the numbers, is difficult to argue with.
The Arithmetic of Decline: Japan’s Domestic Squeeze
Japan has been living with a slow-motion structural crisis for the better part of three decades. The country’s population has fallen from its 2008 peak of 128 million and, by government projections, is set to slide toward 88 million by 2065. More than 29% of Japanese citizens are already aged 65 or older, making Japan the most demographically aged major economy on earth, as the IMF’s Finance & Development journal has documented. The working-age share of the population — those between 15 and 64 — has already fallen below 60%, the lowest among G7 nations. An aging society, as the IMF bluntly put it, “consumes less than a young one.”
For large multinationals — Toyota, Sony, SoftBank — the pivot overseas happened long ago. Their international revenue insulated them. It’s the mid-tier, the thousands of companies with 50 to 500 employees that form the backbone of Japanese manufacturing, services, and distribution, where the pressure is now acute. These firms were built to serve domestic demand. And domestic demand is structurally, irreversibly shrinking.
Set against this backdrop, Southeast Asia’s growth rates read like an alternate universe. The Asian Development Bank, in its December 2025 Outlook, revised the region’s GDP forecasts upward: growth of 4.5% for 2025, with Vietnam projected to expand by 6.6%, the Philippines at around 6%, and Indonesia at 5%. The IMF, speaking at the ASEAN Summit in October 2025, put it plainly: ASEAN is the world’s fourth-largest economy, with a collective GDP exceeding $4 trillion, growing 25% faster than the global average. For a Japanese mid-sized firm watching its addressable market contract at home, those numbers are not an abstraction. They are a survival map.
Why are Japanese companies expanding into Southeast Asia?
Japanese mid-sized companies are expanding into Southeast Asia because of converging structural pressures: a shrinking domestic consumer base driven by demographic decline, Tokyo Stock Exchange governance reforms compelling capital efficiency, the China-plus-one supply-chain imperative, and Southeast Asia’s sustained GDP growth of 4.5–6.6% across key markets — offering volume that Japan’s home market can no longer supply.
1 — The Core Development: A New Wave of Japanese Mid-Sized Companies Heading to Southeast Asia
The outbound push among Japanese mid-sized companies into Southeast Asia is not a new phenomenon. What’s changed is its scale, its urgency, and critically, the profile of the businesses involved.
For decades, it was Japan’s manufacturing giants — Hitachi, Panasonic, Bridgestone — that staked early positions across Vietnam, Thailand, and Indonesia. Their supply chains came first; their back-office operations followed. The mid-tier watched from the sidelines, constrained by capital, language barriers, and a domestic comfort zone propped up by decades of steady, if modest, home-market demand. That comfort zone has now dissolved.
JETRO’s FY2025 global survey of Japanese companies operating overseas — covering 7,485 valid responses across 82 countries — found that 66.5% of Japanese-affiliated overseas companies expect to be profitable in 2025, rising for the second consecutive year. The direction of expansion intentions tells a clearer story: survey respondents signalled growing appetite for Southwest Asia and ASEAN, while China — once the region’s default destination — continues to lose ground. In China, the proportion of companies anticipating business expansion hit an all-time low. The appetite is shifting, and it’s shifting south.
The structural driver is the “China plus one” strategy, which, by 2026, has stopped being a strategy and started being an operating assumption. Sino-American trade tensions, periodic supply-chain shocks, and rising Chinese labour costs have pushed Japanese manufacturers to seek parallel production bases. Vietnam has emerged as the primary beneficiary, attracting Japanese automakers, electronics suppliers, and — increasingly — second-tier parts makers who once fed larger Japanese manufacturers. Thailand, with its mature automotive industrial base and 60-year-old Japanese manufacturing presence, continues to draw mid-sized component makers. Indonesia, with its population of 280 million and a PMI that hit a multi-month high of 53.6 in early 2025 according to S&P Global data, is drawing fresh interest from consumer-goods manufacturers seeking volume markets.
UNCTAD’s 2025 FDI Explorer data shows ASEAN inflows hit a record $225 billion in 2024, up 10%, even as Europe’s FDI collapsed and China’s fell 29%. The region absorbed capital when almost nowhere else did.
What’s different now is who is moving. It’s no longer primarily the large enterprise with a dedicated global-expansion team and a Singapore holding company. It’s the Osaka die-caster, the Nagoya food-equipment manufacturer, the Fukuoka logistics-software firm — businesses that, until recently, had neither the appetite nor the architecture for foreign operations.
2 — The Structural Logic: Why Southeast Asia, Why Now?
The question most analysts ask is why the timing. The answer is a convergence of four pressures that have, in 2025 and 2026, reached simultaneous critical mass.
What is driving Japanese mid-sized companies to expand into Southeast Asia?
Japanese mid-sized companies are expanding into Southeast Asia because of converging structural pressures: a shrinking domestic consumer base driven by demographic decline, Tokyo Stock Exchange governance reforms compelling capital efficiency, the China-plus-one supply-chain imperative, and Southeast Asia’s sustained GDP growth of 4.5–6.6% across key markets — offering volume that Japan’s home market can no longer supply.
First, the demographic arithmetic, already described, is irreversible on any business-relevant time horizon. Companies can adapt temporarily — through automation, productivity gains, pricing — but they cannot manufacture new Japanese consumers. The medium-term demand trajectory at home is fixed. Growth, if it comes, must come from somewhere else.
Second, the TSE’s corporate governance overhaul — which since 2023 has placed intense scrutiny on companies trading below book value — has created a new accountability mechanism. Japanese mid-sized firms, traditionally patient with low returns, are now under pressure from institutional investors to demonstrate capital efficiency. Overseas expansion, with its attendant revenue diversification, has become a credible answer to that pressure. As documented by analysts writing for Insignia Business Review, the TSE’s push on price-to-book ratios is “forcing Japanese companies to think differently about partnerships, including those with international firms.”
Third, U.S. tariff policy has injected a new and urgent variable. Japanese manufacturers heavily embedded in Chinese supply chains face cost exposure that’s now structural, not cyclical. The premium on supply-chain geographic diversification has risen sharply since the Trump administration’s tariff expansions, and ASEAN — with its favourable trade agreements, including RCEP and CPTPP — offers a route around the worst of the exposure.
Fourth, and perhaps least discussed, is the sheer scale of Southeast Asia’s consumer base. The region’s middle class is expanding at a rate that has no parallel in Japan’s recent history. J.P. Morgan research has projected the internet economy across six key ASEAN markets approaching $360 billion in gross merchandising value. For a mid-sized Japanese food manufacturer, a health-care-products company, or a retail-concept operator, that is not a distant opportunity. It’s a currently accessible, rapidly deepening market — and Japanese brands, given the cultural cachet they carry across the region, start with a significant standing advantage.
3 — Implications and Second-Order Effects
The shift carries consequences that extend well beyond the balance sheets of individual companies.
For Japan itself, the most immediate concern is what economists sometimes call the “hollowing out” risk. When large Japanese manufacturers moved production offshore in the 1990s, domestic suppliers suffered. If the current wave of mid-sized firms follows not just with production but with their management, R&D, and commercial operations, the domestic economic base could erode further. Japan’s Ministry of Economy, Trade and Industry has acknowledged this tension in its 2025 White Paper on International Economy and Trade, which frames overseas expansion as necessary for value creation while simultaneously signalling concern about domestic industrial capacity.
For Southeast Asian host economies, the implications are broadly positive but uneven. Vietnam and Thailand, which have the most established Japanese industrial infrastructure, are best positioned to absorb further waves of investment quickly. Indonesia faces more complex challenges: its logistics infrastructure, while improving, still lags Vietnam’s in efficiency for export-oriented manufacturing. Malaysia, meanwhile, is seeing a particular surge — S&P Global’s 2025 Reshoring Special Report found that 28% of Malaysian manufacturers reported increased demand tied to reshoring, up sharply from 20% in 2024, with medium-sized firms particularly optimistic.
For the broader regional trade architecture, the Japanese mid-sized firm’s arrival accelerates something that was already underway: the transformation of ASEAN from a primarily large-enterprise investment zone to a genuine habitat for mid-market global capital. That shift has compounding effects. Japanese SMEs bring with them supplier relationships, technology transfer, and operational know-how that seed local industrial ecosystems. In Vietnam’s industrial provinces, the downstream effect of Japanese mid-tier manufacturers has been the emergence of local sub-suppliers and component fabricators that did not exist a decade ago.
There’s a currency dimension, too, that shouldn’t be underplayed. The yen’s extended period of weakness — a consequence of the Bank of Japan’s historically accommodative stance and the slow pace of normalisation — has paradoxically made overseas investment cheaper in yen terms, even as it erodes repatriated profits. Companies with significant local-currency revenue in baht, dong, or rupiah are, in effect, hedging against further yen weakness. The financial calculus has shifted in ways that favour commitment over caution.
4 — The Counterarguments: Not Every Mid-Sized Firm Should Go
The enthusiasm carries real risks, and anyone advising Japanese mid-sized firms on Southeast Asian expansion would be negligent to paper over them.
The first is operational. Large corporations move to ASEAN with teams of experts, legal counsel, and institutional knowledge accumulated over decades. Mid-sized firms typically don’t. The complexities of establishing a subsidiary in, say, Indonesia — navigating local-ownership rules, labour regulations, tax treaties, and sometimes opaque licensing processes — can overwhelm companies that lack dedicated international capacity. Research published in the journal Asia Pacific Business Review documented that some Japanese firms that expanded into Thailand and Indonesia in the mid-2010s subsequently withdrew, citing rising labour costs, talent shortages, and intensifying competition from Western companies. Those conditions have not uniformly improved.
The second risk is the competitive environment itself. Japanese mid-sized firms arriving in Vietnam or Indonesia in 2026 are not entering empty markets. Chinese manufacturers — displaced by tariffs or simply pursuing their own internationalisation — are competing aggressively for the same factory sites, the same skilled workers, and the same distribution channels. The JETRO survey noted that concerns about “intensifying competition with Chinese companies” ranked among the top worries for Japanese manufacturers in Asia.
Third, the World Bank’s April 2026 East Asia and Pacific update flagged that Southeast Asian growth itself faces a slower trajectory — projecting a regional moderation to 4.2% in 2026, down from 5%, partly because of the conflict in the Middle East and its effect on energy prices. Thailand, in particular, is struggling, with forecast growth of just 1.3% in 2026, dragged by high household debt and political uncertainty. A company that entered Thailand’s market betting on strong consumer growth may find the reality more complicated than the prospectus suggested.
The picture is more complicated still for firms without a clear competitive differentiation. Japanese brand cachet travels far in Southeast Asia, but it is not infinite. It doesn’t automatically compensate for a product that’s 30% more expensive than a local equivalent, or a distribution model that was built for Japanese retail formats and doesn’t translate.
Closing: The Point of No Return
There is something close to inevitability in what is happening. Japan’s mid-sized companies are not choosing to internationalise so much as accepting that the alternative — remaining anchored to a structurally contracting domestic base — is its own form of decline. The question isn’t whether to move, but whether to move with enough preparation and self-awareness to avoid the mistakes of those who moved before.
Southeast Asia will absorb this capital. The region has the demographic momentum, the infrastructure investment trajectory, and the trade architecture to sustain Japanese mid-tier ambitions for at least the next decade. What the region cannot guarantee is that every company that arrives will thrive. The mid-sized firms that succeed will be those that treat the region as a set of distinct, demanding markets — not as a single, grateful alternative to the one they left behind.
Japan’s corporate middle is heading south. The question that will define the next chapter is not whether, but how well.
Discover more from The Economy
Subscribe to get the latest posts sent to your email.
On 28 February 2026, the first US-Israeli strikes on Iran effectively closed the Strait of Hormuz to normal shipping. Within six weeks, Brent crude had recorded its largest single-month price rise in recorded history, surging roughly 65 percent to above $106 a barrel. For most of the world, that was a severe financial shock. For South-east Asia — a region of 700 million people that depends on the Middle East for 56 percent of its total crude oil imports — it was something closer to a structural emergency. Governments reached for the familiar toolkit: subsidies, price caps, rationing. It isn’t working.
The timing is particularly brutal. South-east Asia had entered 2026 on what looked like solid ground. The region had weathered US tariffs better than feared; export front-loading and resilient private consumption kept growth humming at roughly 4.7 percent across developing ASEAN in 2025. Inflation was subdued. Central banks had room to manoeuvre.
That cushion is now gone.
The World Bank’s April 2026 East Asia and Pacific Economic Update projects regional growth slowing to 4.2 percent this year, down from 5.0 percent in 2025, with the energy shock explicitly cited alongside trade barriers as a primary drag. The IMF, for its part, forecasts that inflation across emerging Asia will climb from 1.1 percent in 2025 to 2.6 percent in 2026 — a projection that assumes the most acute phase of supply disruption ends by May. Few analysts believe it will.
The Southeast Asian Energy Shock: What Hit, and Why It Hurts So Much
The mechanism is straightforward, even if the scale is not. The Strait of Hormuz — a 33-kilometre passage between Iran and Oman — serves as the transit point for roughly 20 percent of the world’s daily seaborne oil and up to 30 percent of global LNG shipments. When that artery seizes, South-east Asia feels it fastest. The region imports nearly all of its crude; it holds strategic reserves measured in weeks, not months. Most ASEAN economies sit on fewer than 30 days of emergency oil stocks. The Philippines and Thailand are exceptions, with roughly 45 and 106 days respectively — still a narrow buffer against a conflict that US officials privately suggest could persist through year-end.
The impact of the Southeast Asian energy shock has been immediate and sharp. According to an analysis by JP Morgan cited widely across regional media, the Philippines declared a national energy emergency after gasoline prices more than doubled. Indonesia and Vietnam introduced fuel rationing. Thailand’s fisheries sector — an industry that generates billions in export revenue and employs hundreds of thousands — began shutting down as marine diesel costs became unviable.
The fiscal arithmetic compounds the pain. Fossil fuel subsidies across five major ASEAN economies — Indonesia, Malaysia, Thailand, Vietnam, and the Philippines — reached $55.9 billion, or 1.3 percent of combined GDP, in 2024, before the current crisis. Indonesia alone spent the equivalent of 2.3 percent of GDP on explicit fuel price support. Now, with Brent crude above $100 and the World Bank’s commodity team forecasting an average of $86 a barrel across 2026 even in a best-case recovery scenario, those subsidy bills are rising faster than governments budgeted for.
The ASEAN Economic Community Council convened an emergency session on 30 April 2026, held by videoconference, in which ministers cited “growing instability along key maritime routes” as driving volatility in energy prices and sharply increasing freight, insurance, and logistics costs. The communiqué warned of spillover effects on food security and business confidence, particularly for small and medium enterprises — the backbone of most ASEAN economies.
Why Policy Options Are Narrowing — and Who Is Most Exposed
The question South-east Asian governments face isn’t whether the energy shock hurts. It’s whether they have enough fiscal and monetary space to absorb it.
The answer varies sharply by country, and understanding those differences matters for anyone assessing the ASEAN investment landscape.
Which Southeast Asian countries are most vulnerable to oil price spikes? Thailand and the Philippines face the gravest pressure. Both import nearly all their fuel, lack meaningful commodity export revenue to offset higher import bills, and carry domestic vulnerabilities — elevated household debt in Thailand, structural current-account exposure in the Philippines — that amplify the macro damage. Indonesia and Malaysia are better insulated: coal exports and palm-oil revenues provide a partial natural hedge, and their domestic energy production reduces import dependency. Vietnam sits somewhere in between, with growing industrial exposure but a more activist state ready to deploy price stabilisation funds.
Thailand’s predicament illustrates the bind. The country’s National Economic and Social Development Council reported GDP growth of 1.9 percent year-on-year in the first quarter of 2026, well below the government’s own 2.6 percent projection, even as tourist arrivals held firm. The Oil Fuel Fund empowers Bangkok to subsidise pump prices during international oil spikes — but that mechanism has a fiscal cost, and with the budget already stretched, sustaining it without cutting other expenditure is a genuine political and economic dilemma. The World Bank forecast that Thailand’s full-year growth will slow to just 1.3 percent in 2026, down from 2.4 percent last year — the weakest major economy in the region by a significant margin.
Central banks are caught in a similar bind. The IMF’s Andrea Pescatori put it plainly in April: the energy shock is “raising inflation, weakening external balances, and narrowing policy options.” Cutting rates to support growth risks stoking inflation and pressuring currencies already weakened by the dollar’s safe-haven surge. Raising rates to defend currencies risks tipping fragile economies into contraction. The Philippine peso and Thai baht have both depreciated this year, which means the energy shock arrives at an exchange rate that makes every dollar-denominated barrel of oil cost even more in local terms.
That is not a problem easily subsidised away.
Implications: Fiscal Strain, Food Prices, and the Coal Comeback
The second-order effects of the ASEAN oil crisis are where the real long-term damage accumulates.
The most immediate downstream risk is food inflation. Higher marine fuel costs don’t just shut down Thailand’s fisheries; they push up the price of fish for 70 million Thais and complicate the region’s food-export economics. Fertiliser prices — heavily tied to natural gas — are rising in parallel. Vietnam, a major rice and agricultural exporter, is watching input costs erode margins across its farm sector. Thailand, according to reports cited in regional media, is even exploring fertiliser purchases from Russia to manage costs — a geopolitical trade-off that puts ASEAN countries in an awkward position as the EU and US press them to limit economic lifelines to Moscow.
Then there’s the energy mix reversal. Vietnam and Indonesia are re-optimising towards coal to reduce LNG import dependence — a rational short-term response that directly undermines both countries’ climate commitments and their eligibility for concessional green finance. The IEA’s 2026 Energy Crisis Policy Response Tracker documents this shift across multiple Asian economies, noting a wave of emergency fuel-switching from gas to coal-powered electricity generation.
For businesses, the pressure is both direct and indirect. Singapore Airlines reported a 24 percent increase in fuel costs year-on-year in recent filings, a squeeze that hits one of the region’s most profitable and strategically important carriers. Logistics firms across the region are repricing contracts, with knock-on effects for the export-oriented manufacturers in Vietnam, Malaysia, and Thailand who depend on predictable freight rates to compete in global supply chains.
The Asian Development Bank’s April 2026 Outlook projects inflation across developing Asia rising to 3.6 percent this year, as higher energy prices feed through to consumer prices. For the urban poor across Manila, Bangkok, and Jakarta, who spend a disproportionate share of income on transport and food, that number translates into a genuine fall in real living standards.
The Case for Optimism — and Why It’s Incomplete
It would be unfair to write off ASEAN’s resilience entirely. The region has navigated severe external shocks before — the Asian financial crisis of 1997, the global financial crisis of 2008, the Covid-19 supply chain fractures of 2020–21 — and each time it emerged with stronger institutional frameworks and deeper reserve buffers.
The OMFIF notes that ASEAN+3 entered 2026 from a position of relative strength, with growth of 4.3 percent in 2025 and inflation at just 0.9 percent — conditions that gave central banks some room to absorb a supply shock without immediately tightening. Several governments are using the crisis to accelerate structural shifts that were already overdue: Indonesia is pushing its B50 biodiesel programme, blending palm-oil biodiesel with conventional diesel to reduce petroleum imports. Vietnam is expanding petroleum reserves and evaluating renewable energy deployment. Malaysia is prioritising industrial upgrading.
Some economists argue, too, that the region’s AI-related export boom — identified by the World Bank as a “bright spot” in 2025, particularly in Malaysia, Thailand, and Vietnam — provides a partial growth offset that didn’t exist in previous energy shock episodes. Semiconductor and electronics exports are less fuel-intensive than traditional manufacturing, offering a degree of natural hedge.
Yet this optimism has limits. Most of the structural diversification being contemplated operates on timescales of years, not months. Biodiesel programmes and renewable energy buildouts don’t lower this quarter’s fuel bill. And the fiscal space being consumed by subsidy programmes today is space that won’t be available for infrastructure investment, healthcare, or education tomorrow. Analysts at Fulcrum SGP, reviewing the region’s policy responses, concluded that “the reactive nature of most policy responses risks locking the region into structural fragility” — a diagnosis that captures the fundamental tension between managing the immediate crisis and building long-term resilience.
The Reckoning That Keeps Getting Deferred
South-east Asia’s energy vulnerability didn’t begin on 28 February 2026. For decades, the region’s economies grew rapidly on a diet of cheap imported oil, building infrastructure and industrial capacity calibrated to abundant fossil fuels and open sea lanes. The Hormuz closure has made visible what was always structurally true: that a region of 700 million people, with combined GDP approaching $4 trillion, had built its prosperity on a supply chain that runs through a 33-kilometre passage controlled by a third party.
Governments are responding, as governments do, with the instruments closest to hand — subsidies, rationing, emergency reserves. Those measures will blunt some of the pain. They won’t resolve the underlying architecture.
The World Bank’s Aaditya Mattoo put the challenge with unusual directness in launching the April update: “Measured support for people and firms could preserve jobs today, and reviving stalled structural reforms could unleash growth tomorrow.” The operative word is “stalled.” The reforms — energy diversification, grid integration, renewable deployment — were the right answer before the crisis. They remain the right answer during it. The distance between knowing that and doing it, at pace and at scale, is where South-east Asia’s next decade will be decided.
The Strait of Hormuz may reopen. The structural exposure won’t close itself.
Discover more from The Economy
Subscribe to get the latest posts sent to your email.

On 27 January 2026, a filing to the Hong Kong Stock Exchange confirmed what many in the global sportswear industry had long suspected. Anta Sports Products — a company founded in a Fujian shoe factory by a man who once sold trainers off a bicycle — would become the single largest shareholder in Puma, the 75-year-old German sportswear institution. The price: €1.5 billion in cash, a premium of more than 60% over Puma’s then-depressed share price. It was the clearest signal yet that Chinese companies buying western brands isn’t a passing trend. It’s a structural shift with consequences that run well beyond fashion and sport.
The Macro Backdrop: A Decade of Declinism Meets a Wave of Opportunity
The timing of Anta’s move is not accidental. Western consumer brands are, in many cases, cheaper than they’ve been in a generation. Puma’s shares had fallen more than 70% over the five years preceding the deal, leaving it with a market capitalisation of roughly $3.5 billion — against Anta’s own $27 billion. Puma had an “abysmal 2025,” as Morningstar retail analyst David Swartz put it, with sales declining more than 15% in the third quarter alone. Across European luxury and lifestyle, property market collapses in China, rising domestic brands, and post-pandemic demand hangovers have left storied Western names trading at multiples that would have seemed fanciful a decade ago. Front Office Sports
That context matters for understanding the deal flow. Chinese enterprises announced a total of $43.6 billion in overseas mergers and acquisitions in 2025, an increase of nearly 40% year-on-year, with the number of large deals valued above $1 billion rising from seven to 13 compared to the prior year. Europe, in particular, emerged as the hottest destination in the second half of the year. Deal value in Europe reached $13.8 billion in 2025, surpassing Asia as the leading destination in the third and fourth quarters. EYEY
The world has not seen Chinese outbound investment at quite this angle before. Earlier waves — Geely buying Volvo for $1.8 billion in 2010, Fosun acquiring Club Med after a two-year bidding war — were characterised by ambition that sometimes outran execution. This one has a different texture: more selective, more financially disciplined, and quietly more consequential.
1: The New Acquisitions — What’s Being Bought and Why
The Puma deal is the flagship, but it’s far from the only transaction defining this moment. In 2025, Youngor, a Chinese apparel group, announced its acquisition of Bonpoint, a high-end French children’s apparel brand, marking a significant step in Youngor’s internationalisation strategy. HongShan Capital — the investment firm formerly known as Sequoia Capital China — acquired a majority stake in Golden Goose, the Italian sneaker brand beloved by a generation of street-style devotees. Fosun’s fashion arm continues to hold positions across Lanvin, St. John Knits, Caruso, and Wolford. In 2021, Hillhouse Capital, a Chinese investment firm, purchased the household appliances arm of Philips for €3.7 billion. ARC GroupOrigineu
What these deals share is more revealing than what distinguishes them. In almost every case, the target is a brand with genuine heritage — decades or centuries of craft, cultural cachet, and name recognition — but whose valuation has been crushed by a combination of mismanagement, overextension, or weak demand in its core Western markets. “Anta is essentially buying a brand with deep heritage and historically strong products at a distressed valuation,” said Melinda Hu, China consumer analyst at Bernstein, adding that the deal’s pricing appeared “reasonable” compared to peer multiples in sportswear given Puma’s current loss-making status. CNBC
That calculation — buy the heritage, fix the operations — runs through the entire wave. Bain & Company partner Priscilla Dell’Orto describes the main driver as “a continued emphasis on accessing heritage and craftsmanship.” Chinese companies aren’t merely acquiring customer bases in the West. They’re buying centuries of brand equity that would take decades to build organically — and they’re doing so, at least in the current market, at prices that carry a meaningful margin of safety. cbinsights
Anta’s track record gives credence to the strategy. As of 2025, Anta commanded 23% of China’s sportswear market, surpassing both Nike and Adidas — and its market valuation stood at approximately $28 billion, ranking third globally. Its chairman, Ding Shizhong, has made no secret of his ambitions. “Mr Ding wants Anta to be the biggest sportswear conglomerate in the world,” Morningstar analyst Ivan Su told Reuters. A person familiar with the company’s strategy added: “If opportunities arise, they won’t hesitate.” Investing.com
2: The Structural Logic — Why Chinese Brands Need Western Names
Why are Chinese companies buying Western brands?
Chinese outbound acquisitions of Western consumer names are driven by three overlapping forces: the need to build credibility in global markets without decades of organic brand-building; the desire to access distribution networks, retail infrastructure, and consumer data in Western markets; and the strategic value of heritage labels for selling to China’s own increasingly discerning consumers, who have grown sceptical of mass-market domestic alternatives but still prize authenticity.
That last point is underappreciated. China’s domestic consumer market has changed profoundly. Chinese domestic brands now hold 76% of the FMCG market, outperforming foreign competitors across categories including beverages, personal care, and food — a phenomenon driven in part by guochao, or “national trend,” a deep and structural consumer pride in domestic innovation. Yet premium international brands — those with genuine provenance rather than manufactured prestige — still carry outsized clout, particularly among older affluent buyers and in categories like sportswear, childrenswear, and lifestyle goods. Hub of China
The picture is more complicated still when you consider what Chinese acquirers bring to the table. Geely’s management of Volvo is widely studied as a template: the Swedish brand was given operational autonomy while benefiting from Geely’s capital and China market expertise, and it grew meaningfully under Chinese ownership. Geely’s acquisition of Volvo marked the first time a Chinese carmaker acquired 100% of a foreign rival, and the company expanded Volvo’s global market share without compromising characteristics such as its focus on safety. Interesjournals
The lesson Chinese companies took from earlier, messier deals — the debt-laden Fosun shopping spree of the 2010s, the collapse of Ruyi Group’s European fashion bets — was one of discipline. Chinese investors have traditionally seen Western brands as trophy assets, at times overestimating their brand equity and expecting to leverage them across markets without much difficulty. This time around, investors are treading more carefully. Anta has explicitly committed to supporting Puma’s management autonomy and its existing turnaround strategy under CEO Arthur Hoeld. That deference to incumbents — unusual for any acquirer — signals a maturity that earlier Chinese deal waves conspicuously lacked. cbinsights
3: Implications — For Markets, Regulators, and Western Boardrooms
The consequences of this trend reach well beyond the deal pages of the financial press.
For Western brands in structural distress, Chinese capital now represents one of the few credible sources of patient, long-horizon investment. Private equity exits via IPO remain difficult in volatile markets. Strategic acquirers from the United States or Europe are themselves under earnings pressure. A Chinese conglomerate with a fortress balance sheet and a long investment horizon has become, for certain categories of asset, the buyer of last resort. That dynamic shifts negotiating power in ways that Western boards are only beginning to grapple with.
For regulators, the pressure is different. The Trump administration’s “America First Investment Policy” memorandum, issued on 21 February 2025, directed CFIUS and other agencies to use all available legal instruments to curb Chinese investments in strategic sectors — including technology, critical infrastructure, healthcare, agriculture, and energy. Consumer brands, sportswear, and luxury fashion sit awkwardly outside those explicit categories, which means deals like Anta-Puma are unlikely to face the same regulatory challenge as, say, a semiconductor acquisition. Yet policymakers in Brussels and Berlin are growing uneasy. Many European governments have continued to strengthen their FDI screening frameworks, with a greater emphasis on remedies planning and what lawyers describe as “regulatory flex” in deal negotiations. LexologyHerbert Smith Freehills Kramer
The Puma transaction is pending regulatory approval expected by the end of 2026. That timeline alone reflects how much the approval environment has changed. Five years ago, a sportswear stake of this kind would have cleared without drama.
For incumbent Western brands not yet in play, the more immediate challenge is competitive. Anta’s global portfolio — Arc’teryx, Salomon, Wilson, Fila, Descente, and now Puma — gives it a range of consumer touchpoints from premium outdoor to mass-market sport that neither Nike nor Adidas can match with owned brands alone. As of early 2025, Arc’teryx alone operated 176 stores worldwide, including 75 stores and 20 outlets in Greater China. That dual-market model — using Chinese manufacturing scale and retail reach to revive Western brands while simultaneously using Western brand equity to sell in China — is potentially the most powerful playbook in global consumer goods right now. Investing.com
4: The Case Against — Why This Wave May Break
Not everyone reads this moment as the dawn of Chinese consumer dominance.
The sceptics start with the numbers. While Chinese overseas M&A jumped in 2025, the long-run trend is less bullish. In 2024, Chinese outbound M&A declined by 31% year-on-year to $30.7 billion — and China’s overall M&A market hit its lowest transaction value in nearly a decade, dropping 16% to $277 billion. The 2025 recovery was real but partial, and it arrived against a backdrop of tariff escalation and geopolitical tension that hasn’t resolved. InterFinancial
There is also the cultural integration problem, which Chinese acquirers have historically struggled with. Western luxury consumers are exquisitely attuned to any dilution of brand authenticity. The perception that a heritage house has become a vehicle for Chinese market penetration — however unfair in commercial terms — can be lethal to the intangible brand equity that justified the acquisition price in the first place. Fosun’s management of Lanvin has been a mixed exercise: operationally improved, but perpetually shadowed by questions about the house’s creative identity. Several smaller Chinese-owned European fashion labels have quietly lost relevance in their home markets while failing to gain meaningful traction in China.
Then there is macroeconomic uncertainty within China itself. The collapse of China’s real estate market — where middle-class property values have lost roughly 20% — alongside youth unemployment running at 16.5% and rising savings rates, has created a more cautious consumer environment at home. Chinese firms betting on domestic premium demand to justify Western acquisitions may find that their home-market thesis requires more patience than their models assumed. IMD
The regulatory threat, moreover, has not peaked. If consumer brands begin to be perceived as vectors for Chinese economic influence — even without any plausible national security dimension — political pressure to screen them may mount faster than the legal frameworks can accommodate.
Closing: The Long Game, Played Quietly
What makes this moment genuinely significant is not any single deal. It’s the accumulation: a generation of Chinese companies, flush with domestic cash flows and impatient with the pace of organic brand-building, systematically buying the brand equity that Western economies have spent decades creating. They are doing so at a moment when Western capital is retreating from risk, Western consumers are cautious, and Western brands are cheaper than they’ve been in years.
Whether that proves wisdom or hubris will depend on execution, on the patience of Chinese corporate governance, and on whether regulators in Brussels, London, and Washington find the political appetite to treat sportswear the way they already treat semiconductors.
Ding Shizhong wants Anta to be the biggest sportswear conglomerate on earth. He now owns a stake in Puma. He already owns Arc’teryx, Salomon, and Fila’s Chinese rights. The ambition is legible. The obstacles are real.
What’s no longer in doubt is that China Inc has opened a new kind of store — and it’s stocking the shelves with some of the West’s oldest names.
Discover more from The Economy
Subscribe to get the latest posts sent to your email.

Goldman Sachs: “The Circulatory System Is Not Working”

Why the U.S. Budget Airline Model Is Running Out of Runway

China’s Oil Shock Absorber: How Beijing Kept Crude Prices Half of What Analysts Predicted

CRH Nears Biggest-Ever Deal to Acquire Arcosa

U.S. Inflation at a Three-Year High: How the Iran War Turned an Economic Recovery Into a Stagflation Risk

IPO Summer 2026: Anthropic, OpenAI, and the Race to Price Artificial Intelligence on Public Markets

Strait of Hormuz Crisis 2026: How a Waterway War Broke Global Oil Markets

Kevin Warsh’s Fed Debut: Rate Hikes Now on the Table as U.S. Monetary Policy Enters a New Era

SpaceX IPO 2026: Inside the $85.7 Billion Listing That Made Elon Musk the World’s First Trillionaire

PSX KSE-100 Up 500+ Points: The Geopolitical Impact on Stocks

Did Anthropic Talk Its Way Into an AI Export Ban?

Big Bonuses for South Korea’s Chip Workers Put Central Bank on Inflation Alert

Easing Iran Tensions Push Mortgage Rates Lower — But a Potential Fed Hike Clouds the Outlook

Paramount’s $111 Billion Warner Bros. Discovery Merger Clears DOJ, But Faces New Hurdles

China Overhauls the World’s Biggest Surveillance Network with Advanced AI

How AI Is Forcing McKinsey and Its Peers to Rethink Pricing

SpaceX IPO: Inside the $2 Trillion Market Debut

KPMG Australia CEO Resigns After Whistleblower Claims Exposed Investigation Failures

PwC China Partner Payouts Cut Amid Evergrande Audit Fraud

Broadcom Market Value Loss: Revenue Forecast Disappoints

The Guardrails Are Down: How Meta and Google’s AI Models Fold Under Pressure

Pakistan Budget FY 2026-27: Relief, Prospects, and the Tightrope Walk

Benefitbay Raises $18M to Build the Plumbing for America’s ICHRA Shift

Nasdaq Tumbles 4% as Chip and Memory Stocks Sink: A $1.2 Trillion Wipeout

Here’s How Much It’ll Cost You to Be Part of SpaceX’s Record-Breaking $75 Billion IPO

Japanese Mid-Sized Firms Flock to Southeast Asia for Growth

Southeast Asia Energy Shock: Economies Struggle to Cope

Singapore Puts a Clock on Wealth: MAS Orders Banks to Halve Account-Opening Times
-

 Markets & Finance6 months ago
Top 15 Stocks for Investment in 2026 in PSX: Your Complete Guide to Pakistan’s Best Investment Opportunities
-

 Analysis4 months ago
Top 10 Stocks for Investment in PSX for Quick Returns in 2026
-

 Analysis5 months ago
Brazil’s Rare Earth Race: US, EU, and China Compete for Critical Minerals as Tensions Rise
-

 Analysis4 months ago
Johor’s Investment Boom: The Hidden Costs Behind Malaysia’s Most Ambitious Economic Surge
-

 Banks5 months ago
Best Investments in Pakistan 2026: Top 10 Low-Price Shares and Long-Term Picks for the PSX
-

 Investment5 months ago
Top 10 Mutual Fund Managers in Pakistan for Investment in 2026: A Comprehensive Guide for Optimal Returns
-

 Global Economy6 months ago
15 Most Lucrative Sectors for Investment in Pakistan: A 2025 Data-Driven Analysis
-

 Global Economy6 months ago
Pakistan’s Export Goldmine: 10 Game-Changing Markets Where Pakistani Businesses Are Winning Big in 2025