
AI
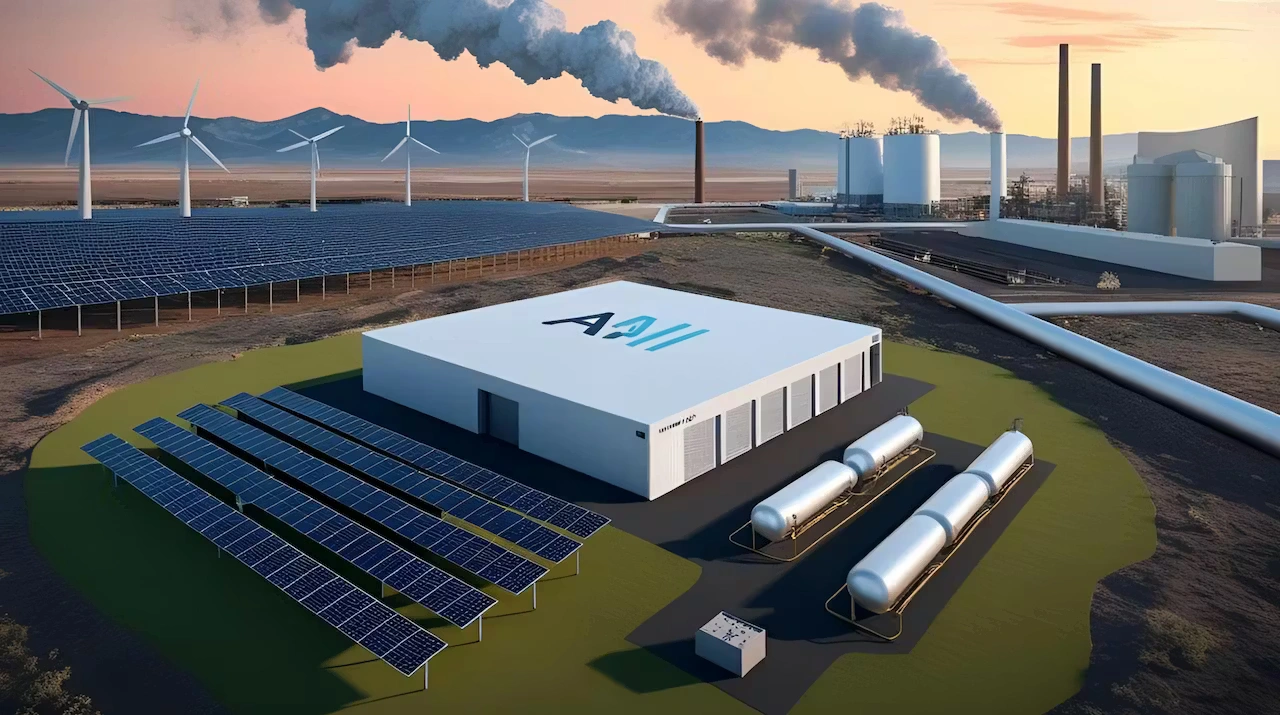
China AI Green Energy Mapping: Data-Centre Demand Surges
On a Wednesday morning in May 2026, a paper landed in the journal Nature that said more about China’s technological ambitions than almost any policy document released this year. Researchers from Peking University and Alibaba Group’s Damo Academy had fed 7.56 terabytes of satellite imagery through a deep-learning model and produced something that had never existed before: a complete national inventory of China’s renewable energy infrastructure, down to the individual turbine and rooftop panel. The algorithm identified 319,972 solar photovoltaic facilities and 91,609 wind turbines spread across a country the size of a continent. “This allows us to see the country’s new-energy landscape from a ‘God’s-eye view’,” said Liu Yu, a professor at Peking University’s School of Earth and Space Sciences. It was not a metaphor. It was a statement of operational intent.
Why the Timing Is No Accident
The Nature publication arrived against a backdrop that gives it unusual urgency. China’s electricity consumption from data centres — the physical infrastructure underpinning every AI model the country trains and deploys — rose 44 percent year-on-year in the first quarter of 2026, according to the China Academy of Information and Communications Technology. That is not a rounding error. It is a structural jolt to a national grid that the government is simultaneously trying to decarbonise.
The broader numbers are equally stark. Data centres in China posted a 38% compound annual growth rate over the past five years and are forecast to maintain a 19% CAGR through 2030, according to Rystad Energy, lifting their share of national electricity consumption from 1.2% today to roughly 2.3% by the end of the decade. The IEA projects that China’s data centre electricity consumption will rise by approximately 175 TWh — a 170% increase on 2024 levels — making it one of the two largest sources of data-centre demand growth globally, alongside the United States. Beijing has enshrined the sector as a strategic priority in the 2026–2030 Fifteenth Five-Year Plan.
The question the Peking University-Alibaba study implicitly answers is: how do you manage a grid of that complexity without first knowing, with precision, what is on it?
China AI Green Energy Mapping: What the Research Actually Did
The conventional way to track renewable energy deployment is through utility filings, government registries, and industry surveys. Each method suffers from the same flaw: it relies on operators to self-report, which introduces lags, underreporting, and geographic ambiguity. China’s solar build-out has been so rapid — the country commissioned more solar photovoltaic capacity in 2023 alone than the entire world did in 2022 — that administrative databases have struggled to keep pace.
The Damo-Peking University framework took a different approach. Using sub-metre satellite imagery and a deep-learning architecture trained to distinguish solar arrays and wind turbines from roads, rooftops, and farmland, the team produced a unified national inventory covering installations as of 2022. The 7.56 terabytes of processed imagery represent, by any measure, one of the most computationally intensive remote-sensing exercises applied to energy infrastructure in the peer-reviewed literature.
What makes the dataset genuinely useful — rather than merely impressive — is its application to what the paper calls solar-wind complementarity. The core finding, published in Nature, is that pairing solar and wind assets reduces generation variability, and that the effectiveness of this pairing increases as the geographic scope of pairing expands. In plain terms: the more widely a grid operator can see and coordinate dispersed renewable assets, the more stable the system becomes. The inventory is the prerequisite for that coordination at national scale.
Professor Liu’s phrase — “God’s-eye view” — captures something real. China has long had ambitions on paper: carbon peak by 2030, carbon neutrality by 2060, renewable capacity targets that consistently overshoot forecasts. What it has often lacked is the granular data infrastructure to translate targets into real-time operational decisions. This study represents a material step toward closing that gap. For grid operators trying to anticipate renewable output, route curtailed electricity, or site new computing hubs, knowing the precise location and configuration of 411,000 generating assets is not an academic exercise. It is operational intelligence.
The Structural Tension: AI as Both the Problem and the Answer
Here is where the story gets complicated. The same AI capabilities that produced the national energy inventory are also the reason China’s grid faces growing stress. Every large language model trained, every image generated, every real-time query processed draws on data centres whose electricity demand is rising faster than almost any other sector. The dual role of AI — as both the cause of surging energy consumption and the tool being deployed to manage it — creates a feedback loop that policy documents rarely acknowledge directly.
How does China plan to use AI to manage renewable energy grid instability? China is deploying AI models to forecast solar and wind output, optimise real-time electricity dispatch, and coordinate demand response — shifting data-centre loads from peak to off-peak periods. In Shanghai, Jiangsu, and Guangdong, data-centre storage is being integrated into virtual power plants. AI-managed demand response is projected to shave 3.5 gigawatts off peak demand in 2026, according to energy consultancy Qianjia, reducing curtailment and improving grid security without new physical infrastructure.
Beijing’s policy architecture reflects this dual logic. A 29-measure action plan issued in May 2026 by China’s National Energy Administration commits to coordinating data-centre expansion with renewable capacity in resource-rich northern and western provinces — Qinghai, Xinjiang, and Heilongjiang are named explicitly. New data centres within China’s eight national computing hubs must source at least 80% of their energy from renewables. The target year for “mutual empowerment and deep integration between AI and energy” is 2030.
The efficiency mandates are already biting. China requires new large and hyperscale data centres to achieve a power usage effectiveness (PUE) — a measure of how much electricity actually reaches computing hardware versus how much is lost to cooling and distribution — of 1.25 or lower, with projects in national computing hubs held to 1.2. For context, top global facilities have achieved PUE levels as low as 1.04 under favourable climatic conditions. That gap is the efficiency frontier China’s operators are being pushed toward.
Still, the picture is more complicated than the policy documents suggest. The IEA notes that most of China’s existing data centres sit in eastern coastal provinces where roughly 70% of electricity supply still derives from coal. Western provinces offer abundant and cheap renewables, but moving computing infrastructure to Xinjiang or Qinghai introduces latency costs and supply-chain complications that operators find commercially uncomfortable.
What This Means for Markets, Grids, and Geopolitics
The downstream implications of China’s AI-enabled energy mapping project extend well beyond grid management software. Three interconnected consequences deserve attention.
First, the inventory positions China’s state and quasi-state entities to make procurement and planning decisions with a precision unavailable to their counterparts in Europe or the United States. When a grid operator in Shanghai knows not just that 319,972 solar facilities exist, but where each one is, how large it is, and how it correlates spatially with wind assets, the economic value of that information for derivatives pricing, capacity auctions, and transmission investment is substantial. China is on course to nearly double its data-centre capacity to 60 gigawatts by 2030, adding 28 GW of new projects to the 32 GW already installed, according to Rystad Energy. Siting those facilities optimally — close to abundant renewables, far from grid bottlenecks — is a billion-dollar decision problem that granular energy mapping helps solve.
Second, the data-centre buildout is reshaping China’s regional economic geography in ways that won’t fully materialise for years. The push toward Qinghai, Inner Mongolia, and Xinjiang is not simply an energy efficiency play. It ties AI infrastructure investment to provinces that Beijing has long struggled to integrate into the coastal technology economy. Green power industrial parks, with dedicated renewable generation and battery storage co-located with compute clusters, create a vertically integrated energy-compute ecosystem that has no obvious parallel outside China’s planning framework.
Third, the geopolitical dimension is impossible to separate from the technical one. China added more wind and solar capacity over the past five years than the rest of the world combined, according to Wood Mackenzie — and it now has a research-grade inventory of that capacity, processed by AI, published in the most prestigious scientific journal in the world. That combination of physical deployment and analytical visibility represents a form of strategic advantage whose implications extend beyond electricity markets. A country that can see its own energy infrastructure with this clarity can plan, hedge, and respond to shocks faster than one that cannot.
The Limits of the View from Above
Not everyone is persuaded that AI-powered optimism about China’s energy transition is fully warranted. Several structural objections deserve a hearing.
The coal baseline is the most persistent. By 2030, China’s data centres are projected to consume between 400 and 600 terawatt-hours of electricity annually, according to Carbon Brief, with associated emissions of roughly 200 million tonnes of CO₂ equivalent. Research firm SemiAnalysis has noted that data centres in China operate at “a significant disadvantage from the emissions perspective” relative to counterparts powered by cleaner grids. Even if the mapping project enables better solar-wind complementarity, the fuel mix feeding the eastern data centres — where most computing actually runs — remains coal-heavy for the foreseeable future.
There is also a question about the gap between inventory and implementation. Knowing where 411,000 renewable assets are located is not the same as having the grid software, trading mechanisms, and regulatory frameworks to optimise them in real time. China’s green power trading market is still maturing. The “green certificate” mechanisms through which data-centre operators procure renewable electricity vary by province and have been criticised for allowing credits to be decoupled from actual physical power flows. Procurement flexibility, in other words, has not yet become procurement integrity.
Critics of the broader AI-in-energy narrative also point to an epistemological limit. The Peking University-Damo dataset maps facilities as of 2022 — a vintage that already feels historical given the pace of installation. China’s solar build-out is adding capacity at a rate that would outpace any static inventory within months. Keeping the map current requires continuous satellite processing at scale, which is exactly the kind of AI compute task that generates the electricity demand the map is meant to help manage. It’s an elegant circle, though not necessarily a virtuous one.
A New Kind of Infrastructure
The Peking University-Alibaba paper will be cited for years in the energy literature. Its immediate value is scientific: it establishes a reproducible, scalable framework for building national-scale renewable energy inventories using satellite imagery and deep learning. Its longer-term significance is strategic.
China is constructing, piece by piece, a data infrastructure for its energy transition that is qualitatively different from the reporting-based systems that most governments rely on. Real-time AI forecasting of renewable output, demand-response programmes that shift data-centre loads to absorb excess generation, and now a high-resolution national asset inventory — these are not standalone initiatives. They are components of a system designed to manage the inherent tension between an AI economy that demands ever more electricity and a climate commitment that demands ever less carbon.
Whether the system will work — whether the efficiency mandates will stick, whether the grid will stay stable as data-centre power demand maintains its 19% annual growth rate, whether the western renewable hubs will genuinely displace coal-fired eastern compute — remains to be seen. What is no longer in doubt is that China has decided to treat energy and AI as a single engineering problem. The God’s-eye view is just the beginning of that project. What happens when the view becomes a command is the question that will define the decade.
Discover more from The Economy
Subscribe to get the latest posts sent to your email.


Global financial regulators have moved from quiet skepticism to open warning, marking one of the most significant shifts in central-bank rhetoric since the aftermath of the 2008 crisis. The Bank for International Settlements (BIS), the International Monetary Fund (IMF), and the Bank of England have each flagged the risk that a correction in artificial-intelligence valuations could cascade through the global financial system, according to the BIS Annual Economic Report 2026 and reporting compiled by Wikipedia’s tracking of the unfolding episode.
From Confidence to Contagion Fear
The warnings did not emerge in a vacuum. In late June 2026, South Korea’s KOSPI index was forced into a trading halt after Samsung and SK Hynix shares each lost roughly 12% in a single morning, a shock that rippled into the Nasdaq, which fell 2.2% the same day. By the following week, Oracle had recorded its worst trading week since the dot-com crash, sliding 19%, after Apple raised product prices in response to soaring chip costs. The sell-off, detailed in Wikipedia’s account of the June 2026 rout, spread across global chip manufacturers before the BIS issued its formal caution on June 29.
Pablo Hernández de Cos, general manager of the BIS, framed the moment as one of “progress” colliding with “peril,” pointing to inflationary pressure, elevated public debt, and what the institution calls AI exuberance as compounding financial vulnerabilities.
Why This Cycle Looks Different — and Why It Doesn’t
Comparisons to the 1999–2000 dot-com bubble are now routine among Wall Street strategists. Deutsche Bank’s global economics team has described 2026 as resembling “1999 meets 1990,” according to Fortune’s coverage of the growing exuberance debate. JPMorgan’s chief executive Jamie Dimon has repeatedly used the phrase “irrational exuberance,” borrowed from former Fed chair Alan Greenspan, to describe dealmaking activity that he says is running “gung-ho.”
Yet analysts at Fidelity note a structural difference from 2000: hyperscalers are largely funding AI capital expenditure from earnings rather than debt, keeping the capex-to-free-cash-flow ratio below 1, compared with nearly 4 at the dot-com peak, based on Fidelity’s bubble-indicator research. That distinction matters for systemic risk, since debt-fueled busts tend to transmit further into the banking system than equity-only corrections.
The Systemic Transmission Risk
Oliver Wyman’s analysis of a potential AI-led market collapse estimates that an equity crash on the scale of the early 2000s could erase approximately $33 trillion in value — more than annual US GDP — a scenario that would compound if financing tied to data-center and digital-infrastructure debt turns out to be more opaque than banks currently report, according to Oliver Wyman’s assessment of financial-sector exposure. US equity market capitalization currently sits at close to twice GDP, a higher multiple than at the dot-com peak.
Prediction markets have already begun pricing the risk. Polymarket data cited by Tekedia shows the probability traders assign to an AI investment-frenzy collapse by the end of 2026 climbing to 26%, up sharply in recent months as valuations in chip and hyperscaler stocks stretched further.
What Regulators Are Asking Institutions to Do
The BIS is not calling for a halt to AI development. Instead, it is urging financial institutions to build greater transparency into AI-related financing, particularly the private-credit channels that now fund a large share of data-center buildouts, and to stress-test balance sheets against valuation drops of 30%, 40%, or even 50% in AI-exposed equities. The Bank of England has separately warned that investors have not been adequately cautioned about downside scenarios tied to companies such as OpenAI, whose valuation more than tripled between October 2024 and the following year.
For markets in the UK, US, Singapore, and East Asia’s chip-manufacturing hubs, the message from regulators is consistent: the innovation is real, but the financing structure underneath it has not been fully stress-tested against a reversal in sentiment.
Discover more from The Economy
Subscribe to get the latest posts sent to your email.

The Bank for International Settlements has told the world’s central banks something few wanted to hear in the middle of an AI-fueled bull run: the financing behind the boom now resembles the early architecture of a credit crisis. In its flagship Annual Economic Report, the Basel-based institution known as the central bank of central banks said that if AI returns disappoint and investors reassess risk, falling asset values combined with sudden funding withdrawals could transmit stress across the broader financial system, as first detailed by The Economy.
From Hyperscaler Capex to Systemic Fragility
The scale driving this concern is difficult to overstate. Microsoft, Amazon, Alphabet, Meta, and Oracle are collectively on pace to spend more than $1 trillion on AI infrastructure across 2025 and 2026 combined, a sum the BIS says already outpaces the group’s combined earnings and free cash flow. That gap is why hyperscalers have turned to debt markets at a pace unseen since the buildout of broadband infrastructure, with investment-grade bond issuance by major AI players exceeding $100 billion in six months, according to Oliver Wyman’s analysis of Dealogic and SIFMA data.
Fortune’s review of the BIS report frames the comparison in historical terms the institution itself invoked: the canal mania of the 1830s, Britain’s railway bubble of the 1840s, and the dot-com crash of 2000, each beginning with a genuine technological breakthrough that attracted more capital than commercial returns could ultimately justify, per Fortune. The BIS stops short of calling the AI boom a bubble outright, but its language leaves little room for comfort.
Private Credit’s Opacity Problem
The more acute concern sits outside public markets entirely. Private credit lending to AI companies surged from roughly $3 billion in 2010 to $40 billion last year, the BIS found. Because these loans flow through a web of investment funds, insurers, pension funds, and asset managers with little public disclosure, regulators cannot easily determine where losses would land if AI returns fall short. Unlike banks, these lenders have no deposit base and no central bank liquidity backstop, leaving forced asset sales as one of the few levers available if investors demand their money back.
That vulnerability is no longer theoretical. Blue Owl paused quarterly redemptions on a retail-facing direct lending fund earlier this year, an early sign of the liquidity strain described by Forbes. BlackRock’s TCP Capital Corp wrote down a private loan to an Amazon-seller aggregator to zero from full value, while bankruptcies at First Brands Group and Tricolor Holdings last September, each carrying billions in debt, have sharpened scrutiny of underwriting standards built during the ultra-low-rate years of 2020 and 2021.
Direct lending funds, an ecosystem now exceeding $1 trillion, have quadrupled their exposure to the AI and IT sectors over five years, and that exposure now represents about 15% of their portfolios, the BIS report notes. The Financial Stability Board, which monitors risk across 24 central banks, has separately warned that “significant data challenges” make the sector’s true exposure nearly impossible to map, with bank exposure estimates ranging anywhere from $220 billion to $500 billion depending on methodology, a spread detailed by IndMoney’s market analysis.
Why the Timing Is Especially Dangerous
The AI credit question is colliding with a second global shock that has nothing to do with technology. The closure of the Strait of Hormuz following the outbreak of the Iran conflict in February cut more than 10 million barrels of crude oil a day from global supply, a disruption larger than either the 1973 oil embargo or the 1979 Iranian revolution, according to the BIS report cited by Fortune. That energy shock has kept inflation risk elevated even as central banks weigh whether to ease policy, creating a scenario the BIS describes bluntly: the same monetary tightening needed to contain energy-driven inflation could be exactly what pops the AI-financed debt bubble.
Credit markets are already pricing in some of this tension. Spreads on bonds issued by AI-related companies rated BBB or higher have widened noticeably since the first quarter, briefly approaching a 20-basis-point increase in March, even as equity markets continue to price substantial further upside, a divergence flagged in the Economy’s coverage. Debt coming due from weaker private credit borrowers is projected to jump from $56.6 billion in 2026 to $215 billion by 2028, according to S&P Global data cited by IndMoney, concentrating refinancing risk at precisely the moment AI infrastructure utilization rates are becoming the market’s most important, and least verifiable, number.
What Happens if the Bet Doesn’t Pay Off
Not every analyst agrees the danger is systemic. The CFA Institute’s Enterprising Investor blog has pushed back on comparisons to the 2008 crisis, arguing that private credit’s structural mismatch is fundamentally different from the overnight funding of illiquid mortgage assets that caused the Global Financial Crisis, and noting that a well-diversified multi-strategy portfolio would likely be only marginally affected even by a serious AI correction, per CFA Institute.
But the BIS itself is not predicting collapse so much as demanding preparation. Its central recommendation is for what it calls “robustness” rather than the more fragile “resilience” the global financial system has shown so far, a distinction the institution says matters because a shock, whether a renewed inflation surge or a sharp AI-led repricing, could trigger a broader credit crunch. If half of the projected $6 trillion in AI capital spending through 2030 ends up debt-financed, the resulting credit buildup would exceed all broadband infrastructure investment since the birth of the commercial internet, Oliver Wyman’s modeling shows, and an equity crash on the scale of the early-2000s dot-com bust would, at today’s valuations, wipe out roughly $33 trillion in value, more than the entirety of US GDP.
Discover more from The Economy
Subscribe to get the latest posts sent to your email.

The global billionaire population grew by 13.1% over the past year to reach 3,302 individuals, with their collective wealth climbing 25% — nearly two and a half times faster than the 10.8% growth in average personal wealth recorded across the broader global population, according to the UBS Global Wealth Report 2026. The gap between those two figures, both drawn from the same 56-market dataset, has become the report’s most closely scrutinized finding, offering the clearest documented evidence yet that the artificial intelligence boom is concentrating wealth gains at a scale and speed rarely seen outside wartime economies.
The report’s seventeenth edition draws on data covering markets that together account for more than 92% of global wealth, according to UBS’s own report summary, giving it a scope few private-sector wealth surveys can match. What it found beneath the aggregate numbers is a story of two very different economies moving in opposite directions simultaneously.
The AI Wealth Machine, By the Numbers
The United States remains home to more than 1,000 billionaires — nearly double China‘s count of 562 — while India holds third place globally with 211 billionaires among a population exceeding 1.4 billion, according to reporting from Spear’s. But the most striking single data point in the report may be South Korea‘s trajectory: the country’s billionaire count nearly doubled, rising from 31 in 2025 to 52 in 2026, driven in large part by the country’s booming semiconductor and AI microchip industries. South Korea’s overall billionaire net worth doubled across the same period — evidence that existing fortunes, not just newly minted ones, expanded sharply on AI-linked equity gains.
Paul Donovan, chief economist at UBS Global Wealth Management, noted that while AI has been one factor behind rising ultra-high-net-worth fortunes, wealth creation reflects a mix of productivity, investment risk-taking, and — at moments of structural upheaval — simple positioning advantage. That framing implicitly acknowledges what critics of the AI wealth boom have argued more bluntly: that early ownership of AI-exposed equities, rather than broad-based productivity gains, explains much of the divergence documented in this year’s report.
Median Wealth Tells a Starkly Different Story
The headline growth figures obscure a more troubling pattern once the data is disaggregated by measure. UBS reported that median wealth — a statistic that better reflects the experience of a typical household than mean averages skewed by billionaire fortunes — actually declined across the majority of countries tracked in the survey, even as average wealth climbed, according to Quartz’s analysis of the report. UBS described the divergence as clear evidence of widening global wealth inequality.
The report’s wealth pyramid data reinforces this picture. The share of adults globally holding less than $10,000 in net assets has continued to shrink, now standing at just over 41% — technically progress, but one driven substantially by asset price inflation among those already holding some wealth, rather than genuine income growth among the poorest segment of the population. Meanwhile, roughly 1.5% of adults in the UBS sample now hold more than $1 million in net assets, with nearly one million new dollar-millionaires added globally over the course of 2025, at a pace of roughly 2,680 people per day.
The United States accounted for close to half of that increase on its own, adding more than 440,000 new millionaires — a rate exceeding 1,200 per day. The United Kingdom added more than 43,000, while France, Spain, Japan, and India each added more than 30,000 new millionaires over the same period.
Where the New Fortunes Are Concentrated
The sectoral breakdown of billionaire wealth growth clarifies exactly how directly the AI boom is driving these gains. Billionaires invested in technology saw their wealth increase by 23.8% in the preceding period covered by UBS’s related Billionaire Ambitions data, while consumer and retail sector wealth growth slowed to just 5.3% as European luxury brands lost ground to Chinese competitors. Industrial wealth, boosted substantially by AI-adjacent infrastructure investment, posted the fastest growth of any sector at 27.1%, reaching $1.7 trillion in aggregate value, with more than a quarter of that growth attributable to newly minted billionaires rather than appreciation of existing fortunes.
Six US technology billionaires alone saw their combined wealth grow by $171 billion, tied directly to AI-driven growth at their respective companies, according to prior UBS reporting reviewed alongside this year’s data. In China, tech billionaires connected to the country’s AI industry likewise saw outsized wealth surges even as the broader Chinese economy continued grappling with a property-sector slowdown and softer consumer spending — illustrating how narrowly concentrated AI-linked wealth creation has become, even within individual national economies.
The Generational Wealth Transfer Compounds the Divide
UBS’s data also captures an accelerating intergenerational wealth transfer that is reinforcing, rather than offsetting, the inequality trend. As the Baby Boomer generation passes on accumulated fortunes, estimates cited alongside the report suggest roughly $90 trillion will change hands globally over the next two decades. Within the current billionaire cohort specifically, newly counted heirs inherited a combined $150.8 billion in the latest reporting period — for the first time exceeding the $140.7 billion in combined fortunes created by self-made new billionaires over the same window, according to data compiled in UBS’s related Billionaire Ambitions research.
That inversion — inherited wealth outpacing newly created wealth among incoming billionaires — marks a meaningful shift in how global fortunes are being replenished, suggesting that even as AI creates genuinely new pools of capital at the top of the distribution, the mechanism reinforcing overall wealth concentration is increasingly inheritance rather than entrepreneurship.
What the Divergence Means Going Forward
The UBS findings arrive at a moment when policymakers across major economies are already grappling with how to tax, regulate, or otherwise respond to AI-driven wealth concentration without stifling the investment that is genuinely driving productivity gains in select sectors. The report does not offer policy prescriptions, but the data itself — 25% billionaire wealth growth against declining median wealth in most tracked countries — provides the clearest empirical anchor yet for a debate that has, until now, relied heavily on anecdote and individual company valuations rather than systematic, cross-country measurement.
For markets and policymakers alike, the report’s central finding functions as a warning that the AI boom’s benefits, however transformative for productivity in aggregate, are not yet reaching the median household in most of the world’s major economies — a gap that is likely to shape political and regulatory responses to artificial intelligence for years beyond the current market cycle.
Discover more from The Economy
Subscribe to get the latest posts sent to your email.

The Money Is Drying Up: How US Pressure Is Choking Off Russia-China Payment Channels

Indonesia GDP Growth 2026: 5.61% Expansion Marks Fastest Pace in Three Years

Singapore Makes Its Move to Become Asia’s Precious-Metals Capital

Malaysia Bets Its 2026 on “Execution” — And the Semiconductor Upcycle Is Doing the Heavy Lifting

Canada’s Central Bank Holds the Line at 2.25% as Tariffs and a Middle East Oil Shock Collide

China Economy 2026: Property Crash Meets Record AI-Driven Export Boom

Pakistan IMF Deal 2026: Third Review Cleared, Budget 2026-27 and Inflation Outlook

Bank of England Interest Rates 2026: Why Inflation Is Rising Again Despite a Hold

Fed Ends Forward Guidance: What Kevin Warsh’s Policy Shift Means for Markets

AI Bubble Warning 2026: Why BIS, IMF and Bank of England Fear a Market Crash

Russia Raised VAT to 22% to Pay for the War. It Still Isn’t Enough

Six Straight Quarters of Falling Prices: Inside China’s Deflation Trap

Canada Missed Its CUSMA Deadline. Now Its Economy Is “On Pause”

UK Stagflation 2026: Why the Bank of England May Hike Rates, Not Cut Them

Investors Pile Into Bullish Dollar Bets as ‘US Exceptionalism’ Trade Returns

Nasdaq Tumbles 4% as Chip and Memory Stocks Sink: A $1.2 Trillion Wipeout

How to Fix Pakistan’s Debt Economy: A Structural Blueprint

Japan’s Nikkei Scales Record Peak as AI Shares Track US Chip Rally

Grinding the Already Ground: Pakistan’s Inflation Crisis

JPMorgan Cuts Anthropic AI Access in Hong Kong

Smash Capital Leads $200M Funding for Allen Control Systems

New Investment Super-Cycle: AI, Green Energy & Re-Shoring

Middle East Conflict Oil Prices: The $4 Surge Explained

Xponential Fitness Franchise Lawsuit: The $3.97M Judgment

Germany Rail Network Upgrade: Inside the €100bn Rescue Plan

The End of the Chatbot: Why OpenAI is Tearing Up Its Most Successful Product

The Global Sovereign Debt Crisis: Fiscal Strain in a High-Rate Era

Fiscal Policy under Pressure: High Debt, Rising Risks
-

 Markets & Finance6 months ago
Top 15 Stocks for Investment in 2026 in PSX: Your Complete Guide to Pakistan’s Best Investment Opportunities
-

 Analysis5 months ago
Top 10 Stocks for Investment in PSX for Quick Returns in 2026
-

 Analysis5 months ago
Brazil’s Rare Earth Race: US, EU, and China Compete for Critical Minerals as Tensions Rise
-

 Analysis4 months ago
Johor’s Investment Boom: The Hidden Costs Behind Malaysia’s Most Ambitious Economic Surge
-

 Banks6 months ago
Best Investments in Pakistan 2026: Top 10 Low-Price Shares and Long-Term Picks for the PSX
-

 Investment6 months ago
Top 10 Mutual Fund Managers in Pakistan for Investment in 2026: A Comprehensive Guide for Optimal Returns
-

 Global Economy6 months ago
15 Most Lucrative Sectors for Investment in Pakistan: A 2025 Data-Driven Analysis
-

 Global Economy6 months ago
Pakistan’s Export Goldmine: 10 Game-Changing Markets Where Pakistani Businesses Are Winning Big in 2025