
Analysis
How China Reinvented the BRI: Western Tariffs Accelerated Its Transformation Into a Sophisticated Extension of China’s Industrial Policy

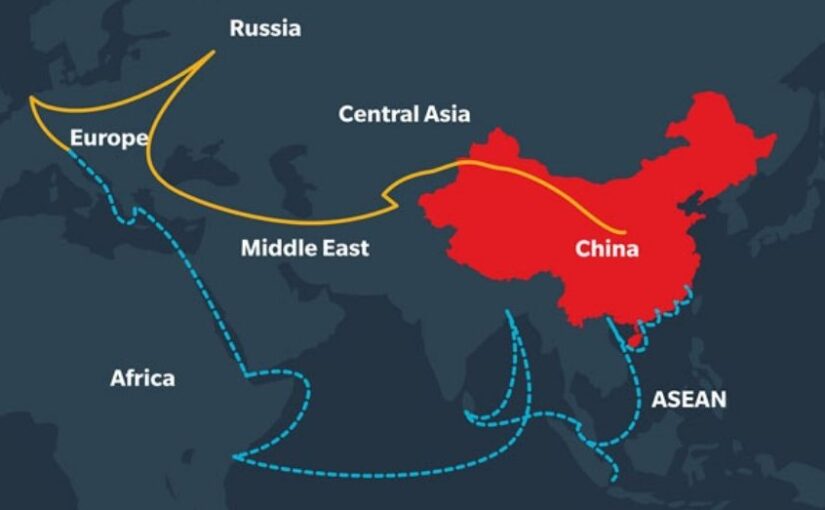
There is a particular kind of policy failure that announces itself quietly—not with a crisis, but with a statistic that arrives too late to matter. For Western capitals still congratulating themselves on having exposed the “debt-trap diplomacy” of China’s Belt and Road Initiative, that statistic arrived in early 2025: $213.5 billion. That is the total value of BRI engagement last year, the highest figure ever recorded, driven by $128.4 billion in construction contracts and $85.2 billion in investments, according to the definitive annual tracking report by the Green Finance & Development Center at Fudan University and the Griffith Asia Institute.
The West had been writing the BRI’s obituary for years. It turns out the patient wasn’t dying—it was in surgery, emerging leaner, smarter, and considerably more dangerous to ignore.
This is the story of how China reinvented the BRI, and why the transformation is Beijing’s most consequential geopolitical pivot since Deng Xiaoping told his country to hide its strength and bide its time. Except now, China isn’t hiding anything.
From Debt-Trap Fears to Industrial Powerhouse: The Narrative That Aged Poorly
Cast your mind back to 2018. Western think-tanks were publishing breathless reports about “debt-trap diplomacy.” The IMF was warning about unsustainable Chinese loans. Hambantota port in Sri Lanka had become shorthand for everything allegedly predatory about the BRI. American officials quietly believed the initiative would collapse under its own contradictions—bad loans, political backlash, COVID disruptions, and the rising chorus of recipient-country grievances would do what sanctions could not.
Some of that critique was legitimate. Early BRI lending was frequently opaque, environmentally careless, and calibrated more toward Chinese state-owned construction firms than the development needs of host countries. AidData’s landmark 2021 research documented “hidden debt” problems in dozens of countries and found that a significant share of projects generated local frustration.
But here is where the Western analysis went badly wrong: it assumed Beijing would respond to criticism the way a Western institution might—with retrenchment, reform panels, and lengthy consultations. Instead, China did something far more strategically coherent. It quietly dismantled the version of the BRI that was failing and replaced it with one calibrated for a new era of great-power competition.
The result? While the West debated whether the BRI was dead, China’s total foreign trade hit approximately $6.4 trillion in 2024, with a historic trade surplus of roughly $1.19–1.2 trillion—figures reported by Reuters that would have seemed fantastical just a decade ago. The BRI isn’t a side project anymore. It is the arterial system through which that surplus finds its geopolitical purpose.
Tariffs as Catalyst: The 2025 Rebound Numbers Tell a Specific Story
The conventional wisdom holds that Western tariffs—Biden’s chips restrictions, the EU’s EV duties, Trump’s sweeping trade barriers—put China on the defensive. The 2025 BRI data suggests exactly the opposite dynamic: tariffs functioned as an accelerant, forcing Beijing to accelerate the very industrial-policy upgrades the BRI now embodies.
Consider the logic. When Washington raised tariffs on Chinese goods and Brussels slapped duties on Chinese EVs, it created an immediate problem for China’s manufacturing export machine: where do the goods go? The answer, executed with characteristic patience, was to restructure the BRI not just as a market for Chinese exports, but as a platform for relocating Chinese production—or at least assembly—to tariff-exempt or tariff-advantaged third countries.
This is BRI supply chain rerouting tariffs in practice, not theory. Chinese firms, particularly in solar, EVs, and batteries, have been quietly establishing manufacturing footholds in BRI partner countries—Morocco, Indonesia, Hungary, Uzbekistan, Ethiopia—that enjoy preferential trade access to Western markets. The BRI’s infrastructure investments, once mocked as vanity ports and empty highways, now serve as the backbone for this industrial relocation strategy.
Key 2025 data points from the GFDC/Griffith report:
- $128.4 billion in construction contracts—the single largest component, reflecting continued hard-infrastructure buildout, now increasingly in energy and digital sectors
- $85.2 billion in direct investments—up sharply, and skewed toward manufacturing and green-tech rather than traditional ports and roads
- Africa and Central Asia led in project volume; Latin America showed the most dramatic investment value growth
- The private sector—companies like LONGi Green Energy, CATL, and East Hope Group—now drives a meaningful share of BRI deals, replacing the lumbering state-owned enterprises of the initiative’s first decade
That last point deserves emphasis. The shift from SOE-dominated lending to private-sector industrial investment is arguably the single most important structural change in the BRI’s reinvention. It is also the change that Western policymakers have been slowest to register.
The New BRI Playbook: Minerals, Green Tech, and Friends-with-Benefits Deals
If the old BRI was about concrete—ports, roads, pipelines, stadiums—the new BRI is about control of the materials and technologies that will define the next economic epoch. Three interlocking strategies define what might be called Beijing’s BRI 2.0 playbook.
First: Critical minerals security. China already refines the lion’s share of the world’s lithium, cobalt, nickel, and rare earths. The new BRI deepens this advantage by securing upstream supply through investment and long-term offtake agreements with mining countries across Africa (DRC, Zimbabwe, Zambia), Central Asia (Kazakhstan, Kyrgyzstan), and Latin America (Chile, Bolivia, Argentina’s lithium triangle). This isn’t charity—it’s vertical integration on a geopolitical scale. When Western nations talk about “friend-shoring” critical mineral supply chains, they are largely scrambling to catch up with arrangements China has been cementing through BRI frameworks for years.
Second: Green-tech export platforms. The EU’s Carbon Border Adjustment Mechanism and American clean-energy subsidies under the IRA were designed, partly, to create a market for Western green technology. Beijing read the same signals and moved faster. Chinese solar manufacturers, EV producers, and battery firms are using BRI partner countries as manufacturing hubs and as captive markets simultaneously. LONGi is building solar panel factories in the Middle East and Southeast Asia; CATL is establishing battery plants in Hungary and Morocco; East Hope is processing aluminium in Southeast Asia using cheaper regional energy. The BRI corridor isn’t just a trade route—it’s a China Belt and Road industrial policy shift writ in gigawatts and gigafactories.
Third: De-dollarization infrastructure. This is the most contested element, but it is real and accelerating. An increasing share of BRI transactions are settled in renminbi or via bilateral currency arrangements. The digital yuan—e-CNY—is being piloted in several BRI corridors. This is not imminent dollar displacement, but it is the patient construction of an alternative plumbing system for global finance, one that could matter enormously in a future sanctions scenario. The Council on Foreign Relations’ BRI backgrounder notes the financial architecture of the BRI as one of its most underappreciated dimensions.
What This Means for the Global South—and the West
The Global South’s relationship with the new BRI is more complicated than either its cheerleaders or its critics admit.
On one hand, recipient countries are more sophisticated than they were in 2013. Governments in Africa, Southeast Asia, and Latin America have watched the Hambantota cautionary tale; many now negotiate harder, demand local employment provisions, and push back on terms that seem tilted too heavily toward Chinese interests. The South China Morning Post has documented a genuine evolution in BRI deal structures—shorter loan tenors, more equity-participation arrangements, greater (if still imperfect) attention to environmental standards.
On the other hand, the fundamental power asymmetry remains. China offers something no other actor currently provides at scale: the combination of capital, construction capacity, and market access in a single package. The EU’s Global Gateway initiative—announced with considerable fanfare as the Western answer to the BRI—has pledged €300 billion through 2027, but disbursement has been slow, governance conditions can be onerous for developing-nation governments, and it cannot match China’s speed of project execution. Foreign Policy’s recent analysis captures the frustration among Global South policymakers who find Western alternatives rhetorically appealing but operationally disappointing.
This creates a dynamic that the West has not adequately grappled with: the BRI rebound 2025 is not primarily a story about Chinese aggression—it is a story about a vacuum the West has failed to fill. Countries that might prefer Western investment are accepting Chinese terms not because they love Beijing, but because the alternative is waiting indefinitely for funds that never quite materialize.
The geopolitical implications compound. Every BRI manufacturing hub established in a third country is a potential hedge against Western market access for that country. Every critical-mineral offtake agreement is a node in a supply chain that circumvents Western leverage. Every e-CNY transaction is a small withdrawal from the dollar’s gravitational pull. Individually, these are manageable. Aggregated over a decade, they constitute a structural shift in global economic architecture.
Why the BRI Is Now “Tariff-Proof”—And a Model for 21st-Century Industrial Statecraft
Here is the contrarian argument that Western analysts need to sit with: Western tariffs didn’t weaken China—they handed Beijing the perfect excuse to upgrade the BRI from concrete to competitive advantage.
The tariff pressure of 2018–2025 forced Chinese industrial policy to become more sophisticated. Firms that might have been content to export finished goods from home factories were pushed—by tariffs, by the risk of further escalation—to internationalize their production. The BRI provided the geographic framework, the infrastructure, and increasingly the regulatory and financial architecture to make that internationalization possible.
The result is a version of the BRI that is, paradoxically, more resilient to Western pressure than its predecessor. When the BRI was primarily about loans and construction contracts, Western pressure could target Chinese banks and state firms. Now that private Chinese industrial companies are the driving force, using locally incorporated entities, partnering with third-country firms, and settling deals in non-dollar currencies, the leverage points are harder to identify and harder to squeeze.
This is what makes the China BRI 2025 moment genuinely novel: it represents the emergence of a model for 21st-century industrial statecraft that Western nations don’t have a clear answer to. It blends state strategy with private-sector execution, hard infrastructure with technology transfer, financial architecture with trade facilitation—all in service of a coherent industrial-policy vision that links domestic manufacturing capacity to overseas market and resource access.
The Economist has noted that China’s approach to industrial policy has grown more sophisticated precisely under the pressure of Western countermeasures—a dynamic that mirrors historical cases where external pressure accelerated rather than retarded technological development.
What the West Should Do Differently: A Pragmatic Agenda
Diagnosis without prescription is just complaint. Here is what a more effective Western response might look like.
Stop celebrating the BRI’s supposed failures. Every time a Western think-tank declares the BRI dead and China proves otherwise, Western credibility takes a quiet hit in exactly the capitals that matter most. Accurate threat assessment is the prerequisite for effective strategy.
Accelerate Global Gateway and PGI disbursement—radically. The Partnership for Global Infrastructure and Investment (G7’s answer to BRI) and the EU’s Global Gateway need to move from pledges to projects at Chinese speeds. This requires cutting bureaucratic timelines, accepting more risk, and being willing to fund imperfect projects in imperfect countries. Development finance cannot be held to standards that make it functionally unavailable.
Compete on the private sector, not just the public sector. China’s most powerful new BRI instrument is private industry—CATL, LONGi, Huawei—backed by state industrial policy but operating with commercial agility. Western governments need to find ways to mobilize their own private sectors into developing-world markets at scale, through blended finance, risk guarantees, and trade facilitation that makes it commercially viable for Western firms to compete where Chinese firms currently dominate.
Engage on critical minerals with genuine urgency. The window to build alternative supply chains for lithium, cobalt, and rare earths is narrowing with each new BRI offtake agreement signed. The World Bank’s minerals framework provides useful architecture; what’s missing is the political will to fund it at the necessary scale.
Stop treating the Global South as a passive audience. The most effective counter-BRI strategy is not to badmouth the BRI—it is to offer recipient countries genuine choices. That means engaging with their actual development priorities, not just Western strategic preferences. Countries that feel they have real alternatives are countries that will negotiate harder with Beijing. Countries that feel they have no choice will sign whatever China puts in front of them.
The View from 2030
Project forward five years. If current trajectories hold, the BRI will have established a durable manufacturing and supply-chain ecosystem across Africa, Central Asia, the Middle East, and Latin America—one calibrated to Chinese industrial priorities, financed through diversified instruments, and partially insulated from Western financial pressure. The critical-minerals supply chains feeding China’s green-tech export machine will be deeper and harder to disrupt. The renminbi’s role in trade settlement will be meaningfully larger, if not yet dominant.
This is not inevitable. China faces real headwinds: domestic economic stress, growing recipient-country pushback on debt and local employment, competition from India and middle powers in specific corridors, and the possibility that some of its industrial bets—particularly in green tech—will be disrupted by technology shifts it doesn’t control.
But the West’s continued tendency to misread the BRI—to see it as a failing initiative rather than an evolving strategic instrument—makes the pessimistic scenario more likely. How China reinvented the BRI is not just an economic story. It is a masterclass in strategic adaptation under pressure, executed by a state that is patient, pragmatic, and playing a longer game than its rivals typically recognize.
The $213.5 billion that moved through BRI channels in 2025 is not a number. It is a signal. The question is whether Washington, Brussels, and London are finally ready to read it correctly.
Discover more from The Economy
Subscribe to get the latest posts sent to your email.



Key Takeaways
- Rolex’s secondary market rose approximately 7.9% year-over-year as of 2026 (per WatchCharts data) — trailing Patek Philippe (+16.2%) and Tudor (+11.4%) but still outperforming Audemars Piguet (+3.4%).
- Rolex raised U.S. retail prices 4–9% in January 2026 (steel models ~5.6%, gold models ~8.7%), narrowing the historical gap between retail and pre-owned pricing.
- Not every model appreciates: steel sports references (Submariner, GMT-Master II, Daytona) have held value far better than two-tone or widely available dress references like the standard Datejust.
- The Lady-Datejust posted the sharpest 2026 gain among tracked collections — up 22.73%, from roughly $9,269 to $11,376 — driven by demand for smaller, “everyday luxury” watches.
- Gold’s rise past $2,400/oz has directly lifted the investment case for Rolex’s precious-metal references (Day-Date, Sky-Dweller, Yacht-Master).
The Model-by-Model Picture
| Category | 2026 Trend |
|---|---|
| Lady-Datejust | +22.73% (strongest performer among tracked collections) |
| Steel sports models (Submariner, GMT-Master II) | Held value well; corrected from 2022 peak but stabilized above retail |
| Daytona | Corrected from highs above $50,000 to the mid-$30,000s; still among the most sought-after references |
| Two-tone/widely available Datejust | Flat to negative — “holds value” is an overstatement for this category |
| Gold references (Day-Date, Sky-Dweller) | Lifted by gold’s rise above $2,400/oz |
Why the “Rolex Always Appreciates” Myth Is Fading
The pandemic-era boom pushed some references — the Daytona above all — to speculative highs disconnected from historical norms. Since the March 2022 peak, steel sports models have compressed meaningfully, and dealers who bought inventory near the top have in some cases faced 20–40% markdowns on liquidation. The lesson for 2026 buyers: Rolex as a category is not a monolith. Value retention depends heavily on specific reference, condition, and whether the piece comes with box and papers (“full set”).
What’s Actually Driving 2026 Strength
- Retail price increases raise the floor. When a new Submariner retails at $10,050 (up from $9,500), a pre-owned example at $11,000–$12,000 suddenly represents a smaller premium — narrowing the gap without secondary prices actually moving.
- Supply discipline remains Rolex’s core lever. The brand has never confirmed production numbers, and secondary-market premiums remain entirely a function of Rolex’s own manufacturing decisions — a risk factor as much as a support.
- Certified Pre-Owned rollout. Rolex’s now fully rolled-out CPO program has changed how buyers transact in the used market, adding a layer of brand-verified legitimacy that supports pricing.
The Case for Rolex as a Portfolio Diversifier
Financial advisors increasingly frame luxury watches not as a replacement for equities or bonds, but as a tangible, historically low-correlation diversifier — one that carries its own risks (illiquidity, condition-dependent pricing, no yield) but has demonstrated multi-decade resilience for specific references.
Is Rolex a good investment in 2026?
It depends heavily on the specific reference. Steel sports models like the Submariner and Daytona have held or grown in value; two-tone and widely available dress models generally have not. Overall, Rolex’s secondary market rose about 7.9% year-over-year in 2026, trailing Patek Philippe but ahead of Audemars Piguet.
Discover more from The Economy
Subscribe to get the latest posts sent to your email.

Navigating Mortgage and Loan Refinancing in a High-Yield Environment
Global public debt crossing critical thresholds has kept central bank policies volatile, resulting in fluctuating US Treasury yields throughout 2026. For homeowners and commercial property holders burdened by previous high-interest borrowing cycles, finding optimal refinance windows has become a high-stakes financial puzzle. Stalled disinflation and stubborn employment numbers mean rate cuts are incremental, requiring borrowers to act with precision.
Timing your mortgage or commercial loan refinance in this environment requires a deep understanding of yield curve movements and lender risk appetites.
Decoding 2026 Refinance Dynamics
The 10-Year Treasury Yield Benchmark
Mortgage rates continue to track closely with the 10-year US Treasury yield. When macroeconomic anxiety spikes debt issuance, yields rise, tightening consumer borrowing capacity. Savvy borrowers monitor weekly Treasury auctions to lock in rates during brief dip windows.
Hybrid ARMs and Alternative Structures
With fixed rates remaining elevated, 7/1 and 10/1 adjustable-rate mortgages (ARMs) have surged in popularity. These products offer lower initial monthly payments, giving borrowers breathing room until central bank easing cycles fully materialize.
| Loan Product | Current Rate Range | Best For | Key Risk Factor |
| 30-Year Fixed Mortgage | 6.2% – 6.8% | Long-term predictability | Higher initial monthly outlay |
| 7/1 Hybrid ARM | 5.5% – 5.9% | Short-term ownership / flipping | Rate reset risk after year 7 |
| Commercial Refinance | 7.0% – 8.2% | Corporate asset restructuring | Strict DSCR lender covenants |
Actionable Steps for Successful Refinancing
To maximize your chances of securing favorable refinance terms in a volatile market, follow a disciplined preparation strategy.
Boost Your Credit Score Immediately: Lenders in 2026 are applying stringent credit tiering; a 20-point increase can drop your APR by a crucial quarter-point.
Shop Regional Credit Unions: Smaller financial institutions often offer portfolio loans with more flexible underwriting than major national banks.
Calculate the Break-Even Point: Ensure your total closing costs are recouped through monthly savings within 24 months of closing.
“Market Strategist View: Refinancing in 2026 is an exercise in opportunistic timing. Borrowers must maintain immaculate financial profiles ready to strike the moment Treasury yields dip.”
Mastering the complexities of today’s debt environment ensures you can successfully lower your debt service costs and protect your long-term financial stability.
Discover more from The Economy
Subscribe to get the latest posts sent to your email.

The days of pulling generic auto insurance quotes based purely on your zip code and age are officially over. In 2026, insurance comparison engines are powered entirely by generative AI and real-time telematics. These platforms digest thousands of live data points—ranging from your driving smoothness via connected vehicle sensors to real-time traffic congestion patterns—to generate hyper-personalized premiums instantly.
For consumers, this evolution represents both a massive opportunity for savings and a hidden trap for penalty pricing. Understanding how AI algorithms evaluate risk is essential for anyone looking to lower their monthly auto insurance premiums.
How AI Comparison Engines Evaluate Your Risk Profile
Behavioral Telematics and Connected Cars
Modern cars stream performance data directly to insurance aggregators. Generative AI models analyze braking sharpness, acceleration curves, cornering G-forces, and phone distraction metrics. Drivers who maintain smooth, defensive habits are rewarded with dynamic rate cuts of up to 40% compared to traditional rating tiers.
Predictive Traffic and Weather Modeling
AI tools now cross-reference your daily commute route with predictive weather and accident probability models. If your standard parking location or driving corridor has a statistically higher incidence of uninsured motorist claims, your quotes will reflect that hyper-local risk assessment.
| Comparison Factor | Traditional Rating Model | 2026 Generative AI Model | Impact on Premium |
| Mileage & Usage | Annual estimated odometer reading | GPS tracking & live trip duration | High (up to 35% savings) |
| Driving Behavior | MVR driving record & accidents | Real-time braking, speed, & G-force | Critical (determines tier) |
| Vehicle Tech | Make, model, and safety rating | ADAS calibration & repair cost data | Moderate |
Strategies to Lower Your AI-Driven Insurance Quote
To outsmart the algorithm and secure the lowest possible premium in 2026, drivers must proactively manage their digital footprint on insurance platforms.
Opt-In for Telematics Trial Periods: Many insurers offer immediate 15% discounts just for installing their driving app; let it track safe habits for 30 days to lock in permanent savings.
Scrub Unverified Public Records: Ensure your motor vehicle report is free of clerical errors that AI risk models misinterpret as reckless behavior.
Compare AI Aggregators: Use platforms that integrate multi-carrier API feeds rather than single-brand comparison sites to find the best risk-adjusted rate.
“Industry Note: AI-driven pricing rewards transparency and precision. Drivers who actively manage their telematics data consistently out-save those relying on legacy quote calculators.”
Embracing AI comparison tools allows savvy policyholders to customize coverage limits precisely to their driving habits, eliminating wasted premium spend while ensuring robust protection.
Discover more from The Economy
Subscribe to get the latest posts sent to your email.

Anthropic Draws the Line: Why Claude’s New Usage Policy Explicitly Bans ‘Cruel Behavior’ Toward AI

Ynon Kreiz & Mattel’s Digital Transformation: Franchise Strategy and Financial Growth

Crude Oil & Petroleum Market Analysis: OPEC+ Decisions and Price Forecasts

Top US Convenience Store Chains: Store Counts, EV Charging, and Sales Trends

Publix Store Closures Tracker: Locations, Rebuild Status, and What’s Changing

How to Find Google Maps Fuel Prices and Save on Every Fill-Up

Global Market Outlook: Navigating Interest Rates, Inflation, and Commodity Spikes

PEP Stock Analysis: PepsiCo Financials, Dividend Yield, and Sector Volatility

Social Security $90 Payment Claims: What’s Real, What’s a Scam, and What Your 2027 COLA Could Be

EU vs UK Electric Vehicle Tariffs: Impact on Automotive Supply Chains & Consumer Prices

Complete Guide to Home Loan Refinancing: Interest Rate Trends & Loan Calculation Strategies

Algorithmic Dogfights: Why the U.S. and China Must Establish Rules of Engagement for Autonomous Air Power

Stock Market Today: Dow, S&P 500, and Nasdaq Retreat as Treasury Yields

Global Economic Outlook 2026: 7 Forces Reshaping Markets, Trade and Business

Oil Prices Break $100 in 2026: Middle East Conflict & Energy Markets

China Stocks Today: Are Big Economies in Asia Nearing a Market Bottom?

Middle East War Economics 2026: Oil Prices & Energy Markets

PSX Forecast 2026: KSE-100, IMF Reviews & Geopolitics

Crypto Daily Outlook: Bitcoin, Altcoins, and the Future of Decentralized Finance

Global Pension Systems Ranked: The World’s Best and Worst Retirement Frameworks

Enterprise AI Platforms Disrupting B2B SaaS in 2026: Full Analysis

World’s Largest Economies: Ranking the Top Global Powers

Elon Musk’s Next Moves: Disrupting the 2026 Global Economy

Pakistan Economy 2026: Inside the SBP’s Balancing Act

GasBuddy Market Insights: How Crude Price Shifts Impact Local Fuel Cost Averages

World Bank & IMF Reports 2026: Why the “3% Growth” Consensus Is Actually a Debate

Global Equity Market Divergence: US Tech vs. European Dividend Stocks vs. Asian Growth

Stock Market Today: Dow Climbs 500 Points as Markets Shake Off Inflation Jitters
-

 Markets & Finance9 months ago
Top 15 Stocks for Investment in 2026 in PSX: Your Complete Guide to Pakistan’s Best Investment Opportunities
-

 Analysis8 months ago
Johor’s Investment Boom: The Hidden Costs Behind Malaysia’s Most Ambitious Economic Surge
-

 Analysis8 months ago
Top 10 Stocks for Investment in PSX for Quick Returns in 2026
-

 Banks9 months ago
Best Investments in Pakistan 2026: Top 10 Low-Price Shares and Long-Term Picks for the PSX
-

 Analysis8 months ago
Brazil’s Rare Earth Race: US, EU, and China Compete for Critical Minerals as Tensions Rise
-

 Investment9 months ago
Top 10 Mutual Fund Managers in Pakistan for Investment in 2026: A Comprehensive Guide for Optimal Returns
-

 Global Economy10 months ago
15 Most Lucrative Sectors for Investment in Pakistan: A 2025 Data-Driven Analysis
-

 Global Economy10 months ago
Pakistan’s Export Goldmine: 10 Game-Changing Markets Where Pakistani Businesses Are Winning Big in 2025