
Analysis
America’s Carmakers Cannot Escape Chinese EVs Forever

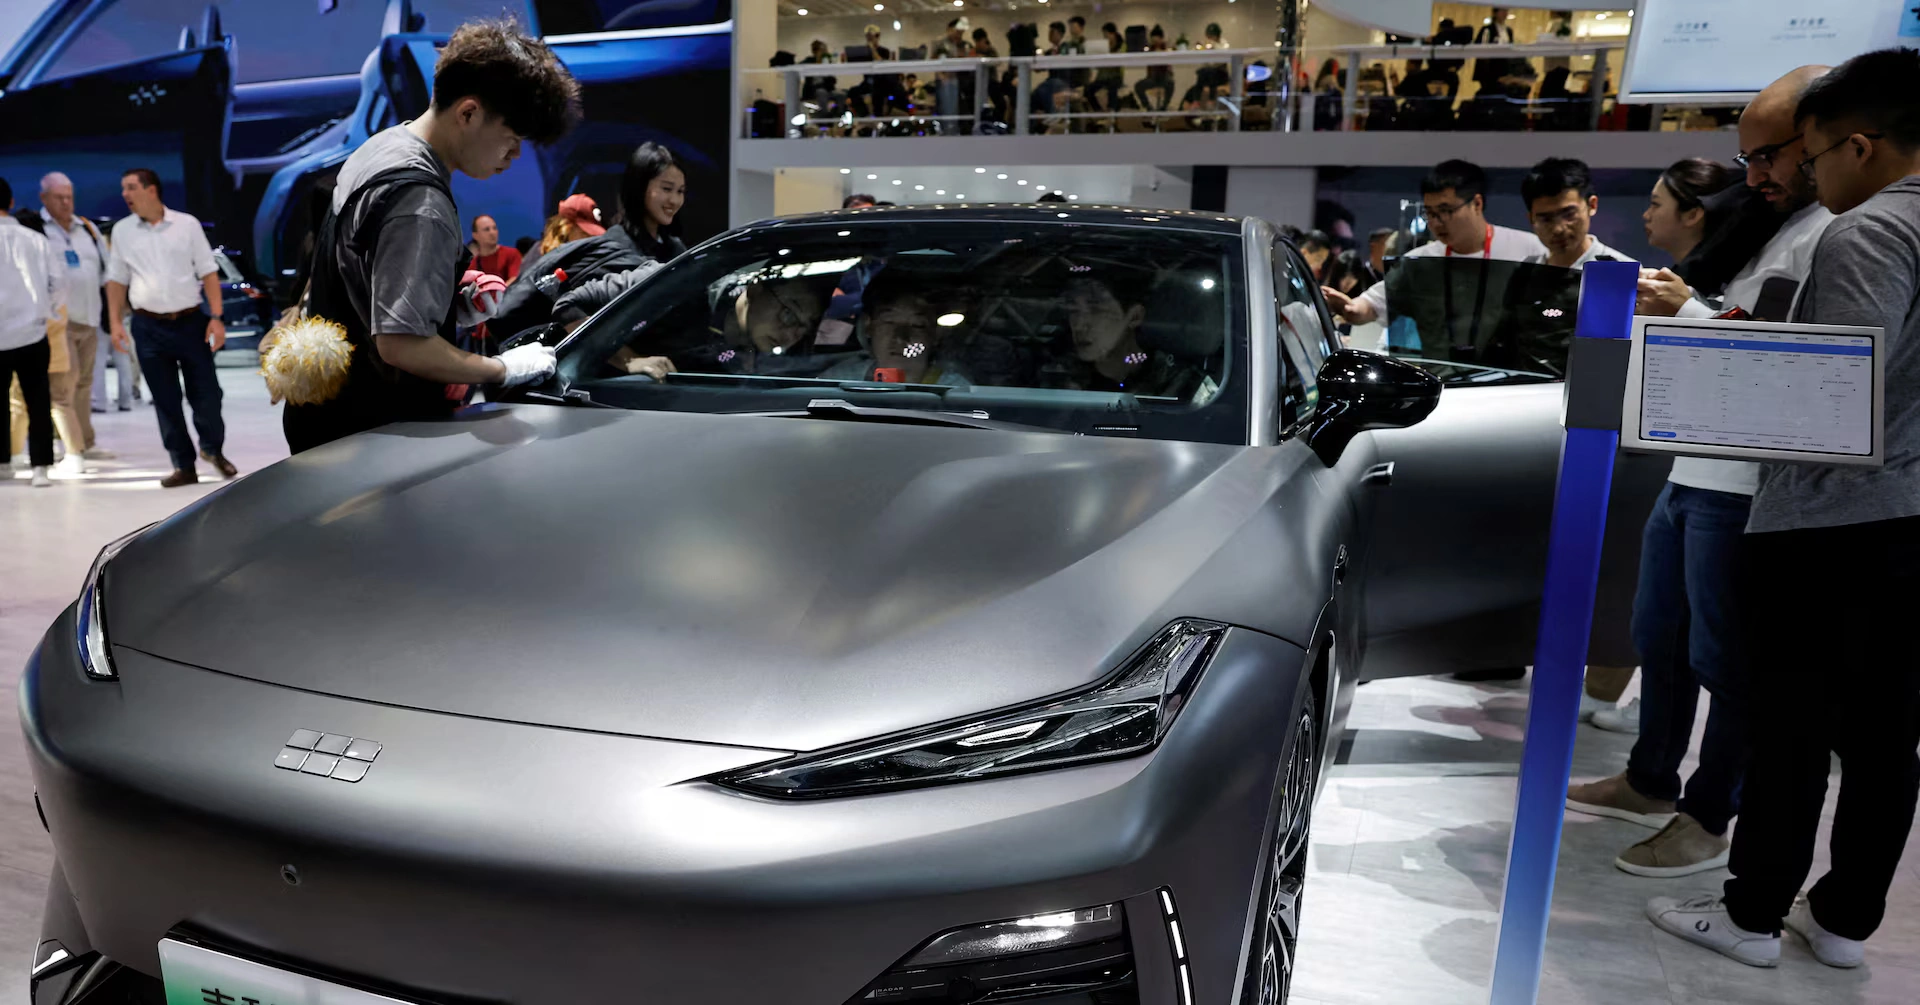
A Wuling Hongguang MiniEV rolls off a Liuzhou production line priced at $6,560. A Chevrolet Equinox EV, built four time zones away in Spring Hill, Tennessee, starts above $34,000. The gap between those two numbers is the real story of the global auto industry in 2026, and Chinese EVs are no longer a distant threat to Detroit — they are a wall the United States has built around itself, one that is already cracking at the edges in Mexico and Canada. The 100% U.S. tariff has not solved the competitiveness problem. It has only postponed the reckoning.
The Tariff Wall Is Holding, But the Perimeter Isn’t
Washington’s strategy has been simple: keep Chinese EVs out, buy American manufacturers time to catch up. The result has been a market frozen in place rather than one transformed. A 100% import tariff, first imposed by the Biden administration and kept in place by President Trump, continues to block direct retail competition between Chinese OEMs and U.S.-listed automakers on American soil. Detroit’s response has been retreat, not reinvention — General Motors and Ford have both pared back their near-term EV production targets, and the Big Three’s global market share has slid from 21.4% in 2019 to roughly 15.7% in 2025, according to reporting cited by the Detroit News.
That figure matters because it shows the tariff has protected market share at home while doing nothing to arrest the bigger loss abroad. BYD overtook Tesla as the world’s top-selling EV maker in 2025, delivering 2.26 million units against Tesla’s 1.64 million — a gap that didn’t exist five years ago and that no American tariff schedule touches, because it was won in markets the U.S. doesn’t control.
Meanwhile the wall has a side door. Canada cut its tariff on Chinese-built EVs to 6.1% in January 2026, allowing up to 49,000 vehicles a year in a deal Prime Minister Mark Carney struck directly with Beijing — reportedly in exchange for China easing its own tariffs on Canadian canola oil. The quota is expected to climb roughly 6% annually, reaching 70,000 within five years. BYD now has a partial North American foothold without ever crossing the U.S. border.
The headline number is almost absurd by American standards. Five of China’s best-selling EVs sit in a $10,000 to $12,000 price band, while the average new car in the U.S. now costs roughly $50,000 — more than four times as much. The Wuling Hongguang MiniEV anchors the bottom of that stack at $6,560, and Geely’s EX2 populates the $8,000–$12,000 tier with a full feature set; auto analyst Felipe Munoz has pointed to the EX2’s interior quality and use of cabin space as evidence that the price gap isn’t simply a subsidy illusion.
That price advantage is not a temporary distortion of currency or labor costs. It is structural. China’s three best-selling EV brands — BYD, Wuling, and Geely — received approval for 83 new passenger car models collectively in the twelve months to October 2025. Volkswagen received approval for six. Nissan got two. That isn’t a difference in effort; it’s a difference in industrial architecture — state subsidy, vertical integration across the battery supply chain, and a domestic manufacturing base operating at a scale Western automakers have never built. A 2024 AlixPartners report found Chinese EV models reach market two to three years faster than non-Chinese brands, a velocity gap tariffs delay but cannot erase.
Three numbers explain why this matters beyond price tags:
- 16 million — electric cars China produced in 2025, roughly 20% more than domestic demand absorbed, according to the International Energy Agency, pushing the surplus into export markets.
- 75% — China’s share of global EV manufacturing capacity.
- 40% — China’s share of global EV trade volume.
China isn’t just making cheaper cars. It’s making more of them than its own market can absorb, and that surplus is finding doors the United States hasn’t fully sealed — Mexico, where Chinese vehicles briefly captured a quarter of total sales before a new 50% tariff took effect in January 2026, and Canada, where the door is now deliberately ajar.
Why a 100% Tariff Hasn’t Produced American Competitiveness
Does the US tariff on Chinese EVs actually protect American carmakers long-term?
The tariff protects domestic sales volume in the short term but does not address the underlying cost and innovation gap. It has allowed GM, Ford, and Tesla to avoid building lower-priced models, leaving them structurally unprepared for competition whenever the tariff wall is lowered, bypassed regionally, or rendered irrelevant by Chinese manufacturing on North American soil.
That’s the uncomfortable analytical truth underneath the trade statistics. A protective tariff only works if the protected industry uses the breathing room to close the gap it’s being shielded from. Instead, the opposite has happened. Without Chinese competition forcing their hand, U.S. manufacturers — even Tesla, the supposed EV pioneer — have concentrated on affluent buyers rather than developing the lower-priced, lower-margin vehicles that would broaden the market. Tesla has, by its own public framing, become more focused on robotaxis and humanoid robots than on delivering new affordable models.
That’s a strategic choice with consequences. EV sales in the U.S. have softened since Biden-era tax credits expired, and the national charging buildout has underdelivered. Ford and GM have both announced significant pullbacks to their EV ambitions — not because Chinese cars are competing with them directly, but because the broader market the tariff was meant to nurture hasn’t matured the way policymakers hoped.
There’s also a quieter erosion happening through software, not steel. Volvo recently received U.S. government approval to continue selling vehicles running Chinese-developed and maintained software, even after a Biden-era rule targeting companies with significant Chinese ownership took effect in March 2026. The tariff wall was built for hardware. It was never designed for code.
The next phase of this story isn’t about whether Chinese EVs reach North America — they already have, through Mexico and now Canada. It’s about whether they reach the United States, and how.
Direct imports of Chinese-made EVs into the U.S. remain highly unlikely in the near term given the political weight the United Auto Workers carries in swing-state politics, and given the bipartisan security concerns that have hardened, not softened, since 2024. But a joint-venture manufacturing arrangement — Chinese EVs built on U.S. soil, with U.S. labor, under licensing or partnership structures — is increasingly treated as plausible by industry analysts. Ford has reportedly explored ties with Geely, and the Trump administration’s rhetoric toward Chinese EV plants in the U.S. has at times sounded more welcoming than the tariff policy it inherited suggests.
For policymakers, the second-order effect is a credibility problem. Stellantis, which owns Dodge, Chrysler, Jeep, and Ram alongside several European brands, now competes in a hemisphere where its northern and southern neighbors are taking opposite approaches — Canada opening a narrow channel, Mexico closing one. A North American auto market that operated for three decades as a single integrated zone under NAFTA and its successor is fragmenting into three different tariff regimes for the same category of vehicle. That complicates supply chains for every automaker with cross-border plants, not just the ones trying to sell EVs.
For American consumers, the implication is more direct and less abstract: continued exclusion from a global product category that is, by most independent measures, cheaper, more feature-rich, and evolving faster than its domestic alternative. The Council on Foreign Relations has framed this gap in stark terms — China’s EV producers have “taken the world by storm” in a way that poses a structural threat to an American auto industry still organized around a century-old product architecture.
Not everyone agrees the tariff is a mistake. The dominant counter-argument, voiced consistently by the UAW and echoed across both political parties, rests on national security and industrial-base preservation: allowing subsidized Chinese EVs unrestricted access to the U.S. market wouldn’t just compress American automaker margins — it could hollow out domestic manufacturing employment in a politically and economically sensitive sector, the way Japanese and South Korean competition reshaped Rust Belt manufacturing in the late twentieth century, but compressed into a far shorter timeline.
There’s also a more technical objection. Critics of liberalization point to the gap between the 100% tariff’s stated justification — countering Chinese state subsidies — and the scale of the subsidies themselves. Trade economists at Bruegel have noted the tariff rate implies that half the cost of a Chinese EV is government-funded, a claim that exceeds most independent estimates of actual subsidy levels, suggesting the policy may be doing more political signaling than precise economic correction.
Energy economist James Sallee of UC Berkeley represents the opposing camp most bluntly: he argues the Canada-China deal demonstrates that simply allowing the world’s most popular EVs to compete directly in North America would expand consumer access and accelerate decarbonization, without the U.S. needing to wait for Detroit to catch up on its own.
The contest over Chinese EVs was never really about a single number on a customs form. It’s about whether an industrial strategy built on exclusion can substitute for one built on competitiveness — and five years into the experiment, the evidence is uneven at best. The tariff has done exactly what it promised: it has kept Chinese-badged cars off American driveways. It has not done what its architects implied it would: force U.S. automakers to build something that could win on price, speed, or software if the wall ever came down.
That wall is no longer airtight. It has a 49,000-vehicle gap in Canada, a software loophole at Volvo, and a Mexican border where tariff rates are being renegotiated under pressure rather than settled by policy. None of those cracks amount to collapse. But they are the shape of how trade walls usually fail — not all at once, but at the edges, until the center can no longer hold the line it was built to protect.
America’s carmakers don’t have to compete with Chinese EVs today. That is not the same as being able to avoid it indefinitely.
Discover more from The Economy
Subscribe to get the latest posts sent to your email.



Key Takeaways
- Rolex’s secondary market rose approximately 7.9% year-over-year as of 2026 (per WatchCharts data) — trailing Patek Philippe (+16.2%) and Tudor (+11.4%) but still outperforming Audemars Piguet (+3.4%).
- Rolex raised U.S. retail prices 4–9% in January 2026 (steel models ~5.6%, gold models ~8.7%), narrowing the historical gap between retail and pre-owned pricing.
- Not every model appreciates: steel sports references (Submariner, GMT-Master II, Daytona) have held value far better than two-tone or widely available dress references like the standard Datejust.
- The Lady-Datejust posted the sharpest 2026 gain among tracked collections — up 22.73%, from roughly $9,269 to $11,376 — driven by demand for smaller, “everyday luxury” watches.
- Gold’s rise past $2,400/oz has directly lifted the investment case for Rolex’s precious-metal references (Day-Date, Sky-Dweller, Yacht-Master).
The Model-by-Model Picture
| Category | 2026 Trend |
|---|---|
| Lady-Datejust | +22.73% (strongest performer among tracked collections) |
| Steel sports models (Submariner, GMT-Master II) | Held value well; corrected from 2022 peak but stabilized above retail |
| Daytona | Corrected from highs above $50,000 to the mid-$30,000s; still among the most sought-after references |
| Two-tone/widely available Datejust | Flat to negative — “holds value” is an overstatement for this category |
| Gold references (Day-Date, Sky-Dweller) | Lifted by gold’s rise above $2,400/oz |
Why the “Rolex Always Appreciates” Myth Is Fading
The pandemic-era boom pushed some references — the Daytona above all — to speculative highs disconnected from historical norms. Since the March 2022 peak, steel sports models have compressed meaningfully, and dealers who bought inventory near the top have in some cases faced 20–40% markdowns on liquidation. The lesson for 2026 buyers: Rolex as a category is not a monolith. Value retention depends heavily on specific reference, condition, and whether the piece comes with box and papers (“full set”).
What’s Actually Driving 2026 Strength
- Retail price increases raise the floor. When a new Submariner retails at $10,050 (up from $9,500), a pre-owned example at $11,000–$12,000 suddenly represents a smaller premium — narrowing the gap without secondary prices actually moving.
- Supply discipline remains Rolex’s core lever. The brand has never confirmed production numbers, and secondary-market premiums remain entirely a function of Rolex’s own manufacturing decisions — a risk factor as much as a support.
- Certified Pre-Owned rollout. Rolex’s now fully rolled-out CPO program has changed how buyers transact in the used market, adding a layer of brand-verified legitimacy that supports pricing.
The Case for Rolex as a Portfolio Diversifier
Financial advisors increasingly frame luxury watches not as a replacement for equities or bonds, but as a tangible, historically low-correlation diversifier — one that carries its own risks (illiquidity, condition-dependent pricing, no yield) but has demonstrated multi-decade resilience for specific references.
Is Rolex a good investment in 2026?
It depends heavily on the specific reference. Steel sports models like the Submariner and Daytona have held or grown in value; two-tone and widely available dress models generally have not. Overall, Rolex’s secondary market rose about 7.9% year-over-year in 2026, trailing Patek Philippe but ahead of Audemars Piguet.
Discover more from The Economy
Subscribe to get the latest posts sent to your email.

Navigating Mortgage and Loan Refinancing in a High-Yield Environment
Global public debt crossing critical thresholds has kept central bank policies volatile, resulting in fluctuating US Treasury yields throughout 2026. For homeowners and commercial property holders burdened by previous high-interest borrowing cycles, finding optimal refinance windows has become a high-stakes financial puzzle. Stalled disinflation and stubborn employment numbers mean rate cuts are incremental, requiring borrowers to act with precision.
Timing your mortgage or commercial loan refinance in this environment requires a deep understanding of yield curve movements and lender risk appetites.
Decoding 2026 Refinance Dynamics
The 10-Year Treasury Yield Benchmark
Mortgage rates continue to track closely with the 10-year US Treasury yield. When macroeconomic anxiety spikes debt issuance, yields rise, tightening consumer borrowing capacity. Savvy borrowers monitor weekly Treasury auctions to lock in rates during brief dip windows.
Hybrid ARMs and Alternative Structures
With fixed rates remaining elevated, 7/1 and 10/1 adjustable-rate mortgages (ARMs) have surged in popularity. These products offer lower initial monthly payments, giving borrowers breathing room until central bank easing cycles fully materialize.
| Loan Product | Current Rate Range | Best For | Key Risk Factor |
| 30-Year Fixed Mortgage | 6.2% – 6.8% | Long-term predictability | Higher initial monthly outlay |
| 7/1 Hybrid ARM | 5.5% – 5.9% | Short-term ownership / flipping | Rate reset risk after year 7 |
| Commercial Refinance | 7.0% – 8.2% | Corporate asset restructuring | Strict DSCR lender covenants |
Actionable Steps for Successful Refinancing
To maximize your chances of securing favorable refinance terms in a volatile market, follow a disciplined preparation strategy.
Boost Your Credit Score Immediately: Lenders in 2026 are applying stringent credit tiering; a 20-point increase can drop your APR by a crucial quarter-point.
Shop Regional Credit Unions: Smaller financial institutions often offer portfolio loans with more flexible underwriting than major national banks.
Calculate the Break-Even Point: Ensure your total closing costs are recouped through monthly savings within 24 months of closing.
“Market Strategist View: Refinancing in 2026 is an exercise in opportunistic timing. Borrowers must maintain immaculate financial profiles ready to strike the moment Treasury yields dip.”
Mastering the complexities of today’s debt environment ensures you can successfully lower your debt service costs and protect your long-term financial stability.
Discover more from The Economy
Subscribe to get the latest posts sent to your email.

The days of pulling generic auto insurance quotes based purely on your zip code and age are officially over. In 2026, insurance comparison engines are powered entirely by generative AI and real-time telematics. These platforms digest thousands of live data points—ranging from your driving smoothness via connected vehicle sensors to real-time traffic congestion patterns—to generate hyper-personalized premiums instantly.
For consumers, this evolution represents both a massive opportunity for savings and a hidden trap for penalty pricing. Understanding how AI algorithms evaluate risk is essential for anyone looking to lower their monthly auto insurance premiums.
How AI Comparison Engines Evaluate Your Risk Profile
Behavioral Telematics and Connected Cars
Modern cars stream performance data directly to insurance aggregators. Generative AI models analyze braking sharpness, acceleration curves, cornering G-forces, and phone distraction metrics. Drivers who maintain smooth, defensive habits are rewarded with dynamic rate cuts of up to 40% compared to traditional rating tiers.
Predictive Traffic and Weather Modeling
AI tools now cross-reference your daily commute route with predictive weather and accident probability models. If your standard parking location or driving corridor has a statistically higher incidence of uninsured motorist claims, your quotes will reflect that hyper-local risk assessment.
| Comparison Factor | Traditional Rating Model | 2026 Generative AI Model | Impact on Premium |
| Mileage & Usage | Annual estimated odometer reading | GPS tracking & live trip duration | High (up to 35% savings) |
| Driving Behavior | MVR driving record & accidents | Real-time braking, speed, & G-force | Critical (determines tier) |
| Vehicle Tech | Make, model, and safety rating | ADAS calibration & repair cost data | Moderate |
Strategies to Lower Your AI-Driven Insurance Quote
To outsmart the algorithm and secure the lowest possible premium in 2026, drivers must proactively manage their digital footprint on insurance platforms.
Opt-In for Telematics Trial Periods: Many insurers offer immediate 15% discounts just for installing their driving app; let it track safe habits for 30 days to lock in permanent savings.
Scrub Unverified Public Records: Ensure your motor vehicle report is free of clerical errors that AI risk models misinterpret as reckless behavior.
Compare AI Aggregators: Use platforms that integrate multi-carrier API feeds rather than single-brand comparison sites to find the best risk-adjusted rate.
“Industry Note: AI-driven pricing rewards transparency and precision. Drivers who actively manage their telematics data consistently out-save those relying on legacy quote calculators.”
Embracing AI comparison tools allows savvy policyholders to customize coverage limits precisely to their driving habits, eliminating wasted premium spend while ensuring robust protection.
Discover more from The Economy
Subscribe to get the latest posts sent to your email.

Fidelity Investments Review: Maximizing Returns in a Volatile Stock Market

How Crypto Transformed the Trump Fortune: A $1.4 Billion Financial Breakdown

Global Pension Systems Ranked: The World’s Best and Worst Retirement Frameworks

Global Supply Chain Vulnerabilities: From Eurasian Trade Corridors to Food Consumer Recalls

Why 5% U.S. Treasury Yields Signal a Global Market Regime Shift.

Federal Reserve Defies White House Pressure: Inside Trump’s Demand for Sub-1% Interest Rates After Historic 2026 Rate Hike

How Rising Interest Rates Impact Gig Economy Apps: DoorDash, Uber, and Urban Services

GasBuddy Market Insights: How Crude Price Shifts Impact Local Fuel Cost Averages

DoorDash Driver Payouts, Fee Structures, and Market Competition Analysis

OPINION:Breaking the 3.5% Growth Trap: How Pakistan Can Build a High-Productivity Export Economy

Global Equity Market Divergence: US Tech vs. European Dividend Stocks vs. Asian Growth

Asian Markets Analysis: Navigating Volatility in China, Japan, and Singapore Stocks

Stagflation vs. Soft Landing: How Central Bank Rates Are Reshaping European and Asian Economies

IMF & World Bank Global Economic Outlook: Growth Forecasts Across Europe and Asia

State Farm’s $5B Dividend 2026: Who Qualifies & Payout Dates

US-China Relations in Q3 2026: Trade Tariffs and Supply Chain Risks

SpaceX Starship Flight 14: First Orbital Attempt & Starlink V3 Launch Explained

Top 30 Stocks for Investment in PSX for Massive ROI in 2026

The 2026 Crypto Regulatory Shift: What It Means for Institutional Investors

AI Chip Stocks 2026: The Best Semiconductor Investments Beyond Marvell

AI-Powered Training: The Next Multi-Billion Dollar Ecosystem in Fitness

Tween Back-to-School Trends 2026: What’s Driving the $85B Season

Oil Prices Break $100 in 2026: Middle East Conflict & Energy Markets

10-Year Treasury Yield Hits 4.80%: What It Means for Rates & Portfolios

Shein Clothes Quality & Safety in 2026: What Lab Tests Show

Fidelity Investments Review 2026: SPAXX Yields & Zero-Fee Funds

MRVL Earnings 2026: Why Marvell Sank Despite Beating Estimates

China’s US$10.8 Billion Trade Shortcut: Why the Pinglu Canal Matters
-

 Markets & Finance9 months ago
Top 15 Stocks for Investment in 2026 in PSX: Your Complete Guide to Pakistan’s Best Investment Opportunities
-

 Analysis7 months ago
Johor’s Investment Boom: The Hidden Costs Behind Malaysia’s Most Ambitious Economic Surge
-

 Analysis7 months ago
Top 10 Stocks for Investment in PSX for Quick Returns in 2026
-

 Analysis7 months ago
Brazil’s Rare Earth Race: US, EU, and China Compete for Critical Minerals as Tensions Rise
-

 Banks8 months ago
Best Investments in Pakistan 2026: Top 10 Low-Price Shares and Long-Term Picks for the PSX
-

 Investment8 months ago
Top 10 Mutual Fund Managers in Pakistan for Investment in 2026: A Comprehensive Guide for Optimal Returns
-

 Global Economy9 months ago
15 Most Lucrative Sectors for Investment in Pakistan: A 2025 Data-Driven Analysis
-

 Global Economy9 months ago
Pakistan’s Export Goldmine: 10 Game-Changing Markets Where Pakistani Businesses Are Winning Big in 2025