
Geopolitics
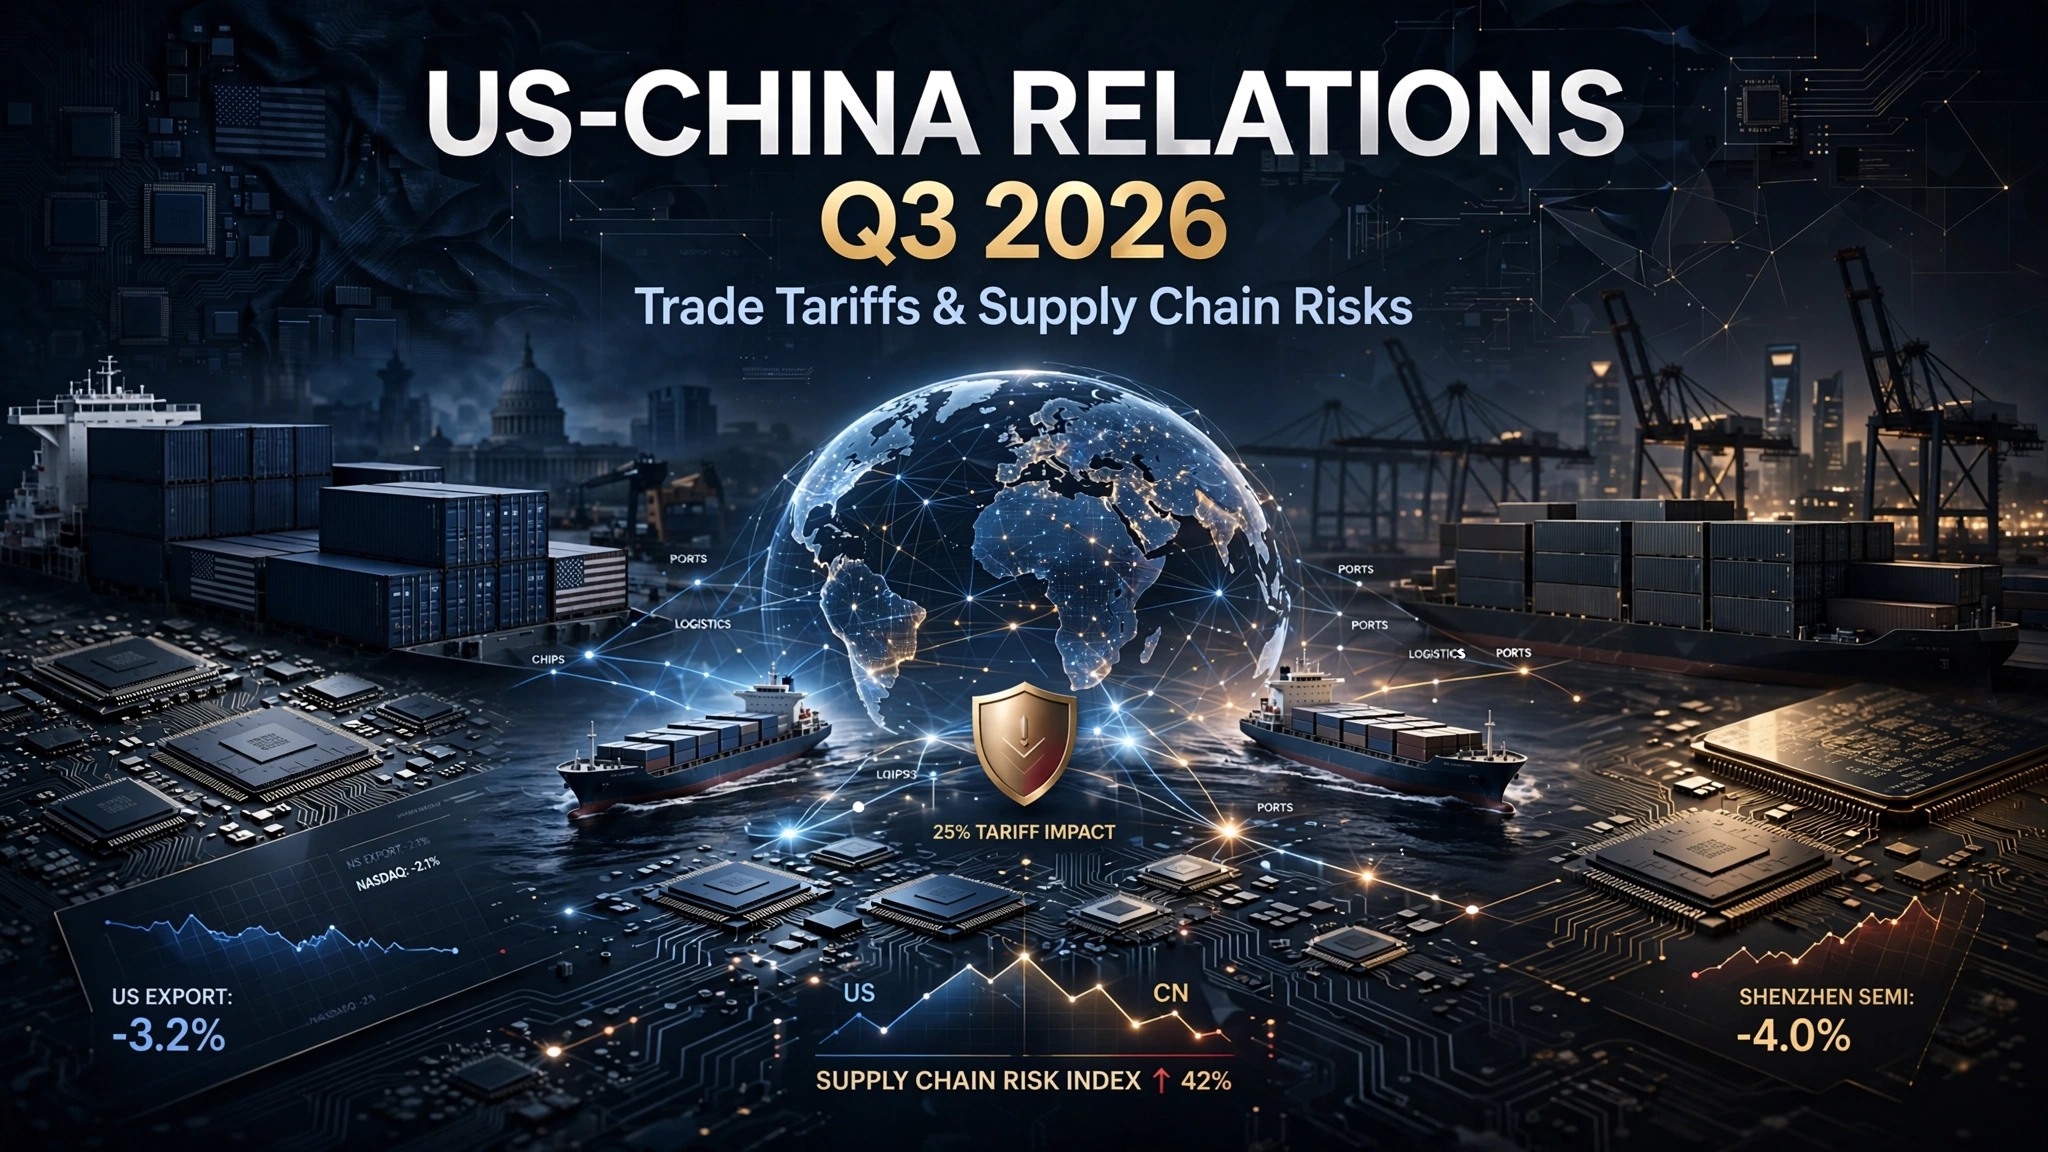
US-China Relations in Q3 2026: Trade Tariffs and Supply Chain Risks

Key Takeaways
- The US-China relationship in Q3 2026 is best described as a “tactical truce” — managed friction with both sides avoiding total decoupling, rather than a resolved trade relationship.
- The blended effective US tariff on Chinese imports stood around 33% as of May 2026, stacked across four separate legal layers, with some product categories (EVs, batteries, solar) clearing 145%.
- A Supreme Court ruling on February 20, 2026 found the President cannot use IEEPA to impose tariffs, forcing a pivot to Section 122 and Section 301 authorities — a significant legal constraint reshaping the tariff toolkit.
- Washington’s focus has shifted from tariff escalation toward structural supply chain revamps, including critical-minerals diplomacy with dozens of allied countries.
- US imports from China have fallen to near-2001 levels — the year China joined the WTO — reflecting one of the most significant trade reallocations in a generation.
From Escalation to “Managed Competition”
Q3 2026 finds the US-China relationship in a distinctly different posture than the tariff-escalation cycles of 2025. As of mid-2026, the US-China trade relationship is best described as a “tactical truce” — a state of managed friction where both nations maintain aggressive competitive postures while avoiding total economic decoupling. Unlike the optimistic expectations surrounding the 2020 Phase One agreement, today’s reality reflects a fundamental shift toward “de-risking” and “friend-shoring” strategies reshaping global logistics patterns.
That truce has institutional grounding. President Trump and President Xi Jinping appear to have maintained a fragile truce in the trade war following their May 2026 summit in Beijing, though experts say complete decoupling of the world’s two biggest economies remains unlikely, with high tariffs, rare earth restrictions, and tech export controls remaining major sticking points. The two leaders shared a vision of building “a constructive relationship of strategic stability” to bring enhanced certainty and predictability to the global economy — with the agreed approach to restore stability being “managed trade” through a board of trade to manage bilateral trade in non-sensitive goods, reduced tariff and non-tariff barriers in selective sectors, and Chinese commitments to purchase US aircraft and address US concerns about critical mineral supplies.
The Tariff Stack: Complex, Layered, and Legally Contested
Understanding the actual tariff burden on US-China trade in Q3 2026 requires unpacking a genuinely complex, multi-layered structure. The blended effective US tariff on Chinese imports stood around 33% in May 2026, stacked across four layers: MFN (~3.4%), Section 301 (7.5-25%), IEEPA fentanyl (20%), and the reciprocal tariff (currently 10% during a truce extension) — though some HS codes covering EVs, batteries, and solar clear 145%.
That legal architecture was upended mid-year by the judiciary. On February 20, 2026, the Supreme Court ruled that the President cannot use IEEPA to impose tariffs. President Trump subsequently lifted such tariffs and imposed a 10% global tariff for 150 days under Section 122 of the Trade Act instead. This ruling forced a structural pivot in how the administration constructs its China tariff policy — shifting weight toward Section 301 and Section 122 authorities, which carry different procedural and duration constraints than the IEEPA framework the administration had relied on.
The November 2025 Truce Framework Still Shapes Q3 2026
Under the trade agreement, the US halved the 20% fentanyl-related tariff to 10% and extended Section 301 tariff exclusions through November 2026, while China pledged to suspend retaliatory tariffs on US agricultural and food products. The US also agreed to suspend implementation of the new BIS “Affiliates Rule” for one year until November 9, 2026, and China agreed to “take appropriate measures” to resume semiconductor manufacturing and exports of legacy chips, suspending for one year its October 2025 export control measures on rare earth materials — though the status of its earlier April 2025 controls remains ambiguous.
That November 10, 2026 expiration date is the single most important near-term calendar event for anyone tracking US-China trade risk through Q3 and into Q4 2026 — nearly every major concession in the current truce is time-limited to that date.
The Structural Shift: From Tariffs to Supply Chain Architecture
The most consequential Q3 2026 development is not a new tariff announcement but a change in strategic focus. Washington has been steadily moving to revamp supply chains away from China — after taking US levies on China up past 100% at their peak, the administration’s efforts to reset the economic relationship have lately focused on a different set of tools. In early 2026, the United States convened dozens of countries and hosted two separate ministerial meetings on critical minerals, signalling that the policy centre of gravity has moved from bilateral tariff brinkmanship toward multilateral supply chain realignment.
The scale of the underlying reallocation is historically significant. The recalibration of supply chains has been so profound that US imports from China have returned to near-2001 levels — the year China entered the World Trade Organization — with research showing companies were already positioned to adjust to tariff levels well before the most recent escalations.
Comparative Table: US-China Trade Relationship, Late 2025 vs. Q3 2026
| Dimension | Late 2025 | Q3 2026 |
|---|---|---|
| Overall posture | Active tariff escalation | “Tactical truce” / managed competition |
| Primary tariff legal basis | IEEPA (executive emergency powers) | Section 122 / Section 301 (post-Supreme Court ruling) |
| Blended effective tariff rate | Higher, more volatile | ~33% (as of May 2026), layered across four mechanisms |
| Policy focus | Tariff rate negotiation | Critical-minerals diplomacy, supply chain diversification |
| US imports from China | Declining | Near 2001 (pre-WTO-accession-era) levels |
| Key expiration date to watch | N/A | November 9-10, 2026 (multiple truce provisions expire) |
Why It Matters: Sector-Specific Supply Chain Exposure
The blended tariff figures conceal enormous sector variation, and that variation is where the real corporate risk-management work lies. The technology sector has been hit hardest, with tariffs on components forcing abrupt sourcing shifts and catalysing a wave of investment in domestic fabrication, though dependence on Asian supply chains remains a persistent challenge. Automakers have been compelled to redesign supply routes, absorbing some extra costs via price adjustments while facing longer lead times and increased inventory holding that strain margins. Retailers in consumer goods and apparel have explored new sourcing from Bangladesh, India, and Central America, but price volatility and inconsistent quality control remain problematic.
For investors and supply chain planners, the practical takeaway is that “US-China trade risk” is no longer a single macro variable — it is a sector-specific, product-code-specific exposure that requires granular mapping rather than a single blended-tariff assumption.
What to Do Next
- Calendar the November 9-10, 2026 expiration dates explicitly — the Affiliates Rule suspension, Section 301 exclusions, and reciprocal tariff terms are all time-limited to this window, making it the highest-probability point for renewed volatility.
- Map exposure at the HS-code level, not the country level — with some categories facing 145% effective rates while the blended average sits near 33%, country-level tariff assumptions materially understate risk for EV, battery, and solar-linked supply chains.
- Track critical-minerals diplomacy as a leading indicator of the next phase of US trade strategy — the shift from tariff brinkmanship to allied-country mineral-supply coordination signals a more durable structural approach than tariff negotiation alone.
- Monitor the Supreme Court’s IEEPA ruling’s downstream effects on the administration’s remaining tariff toolkit, since Section 301 and Section 122 authorities carry different procedural constraints than the now-invalidated IEEPA approach.
- Treat “near-2001 levels” of US-China import volume as a durable baseline, not a cyclical dip — the scale of supply chain reallocation documented by Harvard Business School research suggests this is structural rather than temporary.
FAQ
What is the current effective tariff rate on Chinese imports to the US?
The blended effective US tariff on Chinese imports stood around 33% as of May 2026, stacked across four layers — MFN, Section 301, the IEEPA fentanyl tariff, and the reciprocal tariff — though specific categories like EVs, batteries, and solar can face rates as high as 145%.
Did the Supreme Court block Trump’s China tariffs?
Partially. On February 20, 2026, the Supreme Court ruled that the President cannot use the International Emergency Economic Powers Act to impose tariffs, prompting a shift to a 10% global tariff under Section 122 of the Trade Act instead. Section 301 tariffs, which rest on separate legal authority, remain largely intact.
When does the current US-China trade truce expire?
Multiple key provisions expire around the same date. The suspension of the BIS “Affiliates Rule” runs until November 9, 2026, and the suspension of heightened tariffs on Chinese imports is set to run until November 10, 2026 — making that window the most significant near-term risk point for the relationship.
Discover more from The Economy
Subscribe to get the latest posts sent to your email.



Key Takeaways
- Geopolitical risk is a measurable drag, not just a headline. A widely cited Federal Reserve study finds that higher geopolitical risk foreshadows lower investment and employment, and that the damage comes from both the threat of events and the events themselves.
- 2026 broke a familiar hedge. With oil driven higher by the Iran war, the U.S. 10-year Treasury yield briefly touched about 5.34%, its highest since 2002, so bonds did not cushion stocks the way textbooks promise.
- Energy is the transmission belt. Roughly a fifth of the world’s oil normally sails through the Strait of Hormuz, which is why a regional conflict becomes a global inflation story.
- Indexes can look calm while the market underneath is not. The S&P 500 sits within a couple of percent of its August record, yet market breadth is weak.
- The practical response is structural, not tactical. Diversification, a sensible time horizon and a plan for rebalancing do more than guessing the next headline.
Every few years a news story makes investors feel that the world has changed overnight. A tanker stops moving. A central bank surprises the room. A border closes. Then your portfolio app lights up red, and the temptation to do something becomes almost physical.
This guide is about doing the right something. It explains how international affairs actually reach your investments, what the evidence says about geopolitical shocks, what has happened in 2026 so far, and how to build a portfolio that can absorb the next surprise without a panic sale. It is general information, not personalized financial advice.
How a Distant Conflict Ends Up in Your Account
Geopolitics doesn’t touch prices directly. It moves through a few well-worn channels.
- Commodities. War and sanctions disrupt supply of oil, gas, grain and fertilizer. Prices jump, and costs ripple through transport, food and manufacturing.
- Inflation and interest rates. Higher energy prices push inflation up, which can force central banks to raise rates or delay cuts.
- Currencies and capital flows. Money rotates toward perceived safe havens and away from import-dependent economies.
- Corporate planning. Executives delay investment when the outlook is murky, which is exactly the effect researchers measure.
- Sentiment. Fear alone can reprice risk assets, even before any physical disruption shows up in the data.
The academic backbone here is the geopolitical risk index built by Fed economists Dario Caldara and Matteo Iacoviello. Their paper, published in the American Economic Review, finds that higher geopolitical risk is associated with lower investment and employment and with a greater probability of disasters and larger downside risks. Industries and firms more exposed to those risks cut investment more.
What 2026 Has Looked Like So Far
Start with the shock. Iran’s reported closure of the Strait of Hormuz in early March sent Brent crude sharply higher, as Yahoo Finance reported at the time, and Treasury yields rose on bets that inflation would run hotter. Within about a week, an AP report cited Rystad Energy estimating that more than 12 million barrels of oil equivalent per day had been taken offline.
Since then, the conflict has produced a pattern of hope and disappointment. Brent fell more than 7% in one early-August week on signals of a deal to reopen the strait, per CNBC, then rebounded as the prospects faded. By October 1, Brent was back above $100.
The knock-on effects reached everyday costs. U.S. on-highway diesel averaged $6.382 a gallon in the week of September 28, about $2.63 more than a year earlier.
Where markets stood on October 5
| Indicator | Level | What it signals |
|---|---|---|
| S&P 500 | About 7,720 | Near records, but narrow leadership |
| Nasdaq Composite | About 27,190 | Tech still carrying the index |
| U.S. 10-year Treasury yield | About 5.28% | Borrowing costs near two-decade highs |
| WTI crude | About $90 | Energy still priced for disruption |
| Gold | About $4,190 an ounce | Elevated, but not a one-way bet |
| U.S. Dollar Index | About 102 | A firm dollar tightens conditions abroad |
Figures are from Schwab’s market update and are rounded. Schwab also noted that the S&P 500 Equal Weight Index had posted its seventh straight weekly loss, a sign that gains are concentrated in a small group of large stocks.
The Hedge That Didn’t Hedge
For decades, investors assumed bonds would rise when stocks fell. A geopolitical energy shock can break that assumption, because the problem isn’t weak growth. It’s inflation, and inflation pushes bond yields up and prices down.
You can see it in 2026. The 10-year Treasury hit highs not seen since 2023 in early September, according to CNBC, and then climbed past 5.3% by October 1, a level last seen decades ago. The Federal Reserve raised rates in September to a 3.75% to 4.00% range, its first hike since 2023, and its next meeting is October 27 to 28.
The UK shows the same pattern. Its 10-year gilt yield hovered near 5.4% and the 30-year yield approached 6%, according to Trading Economics, as a global bond sell-off hit one market after another.
The lesson isn’t that bonds are broken. It’s that which kind of shock you face determines which assets protect you. A growth scare favors long-duration government bonds. An inflation scare punishes them.
How Different Assets Tend to React
| Asset | Typical behavior in a Gulf supply shock | Caveat from 2026 |
|---|---|---|
| Energy stocks and commodities | Often benefit as prices rise | Prices can reverse fast on peace headlines |
| Broad equities | Dip on the shock, then recover if growth holds | Leadership can be narrow and fragile |
| Long-term government bonds | Normally a safe haven | Fell when the shock was inflationary |
| Gold | Traditional geopolitical hedge | Highly volatile; forecasts miss often |
| Cash and short-term bills | Stable, with rising yields | Loses ground if inflation persists |
| Import-dependent currencies | Pressured by a higher oil bill | Depends on reserves and policy credibility |
On gold, remember how hard it is to time. JPMorgan was reported in March forecasting gold at $6,300 an ounce by the end of 2026. In early October it traded near $4,190. A gold gain of 7.1% in a single August week was its best weekly performance since January, which also shows how violently it can move in both directions.
Why Your Home Market Matters
Geopolitics hits countries unevenly. An oil shock is a windfall for some and a bill for others.
| Exposure type | Typical pressure points | Examples |
|---|---|---|
| Net energy importers | Higher import bills, weaker currencies, inflation | Pakistan, China |
| Major energy exporters | Stronger trade balances, sanction and logistics risk | Canada, Russia |
| Trade and finance hubs | Shipping costs, risk-off capital flows | Singapore, UK |
| Mixed commodity economies | Depends on the commodity mix | Malaysia, Indonesia |
If most of your income, spending and savings sit in one currency and one market, a geopolitical shock that hurts that economy hits you three times. Spreading exposure across regions and currencies is the cheapest protection available.
A Practical Framework for Investors
None of this requires predicting the next headline. It requires a plan you can follow when the headline arrives.
1. Decide what job each asset does
Equities for growth. Government bonds for stability in growth scares. Real assets or inflation-linked instruments for inflation scares. Cash for liquidity. If you can’t name the job, you probably don’t understand the risk.
2. Match your horizon to your holdings
Money you need within a few years shouldn’t sit in assets that can fall sharply during a crisis. Money you won’t touch for decades can ride out volatility that would be unbearable on a shorter clock.
3. Rebalance by rule, not by mood
Set thresholds in advance, such as reviewing when an asset class drifts five percentage points from target. Rebalancing forces you to trim what has run up and add to what has fallen, which feels wrong in the moment and works over time.
4. Check your inflation sensitivity
Ask what your portfolio does if energy prices stay high for a year. Long-duration bonds, rate-sensitive stocks and thin-margin businesses tend to struggle. Companies with pricing power tend to cope better.
5. Watch the transmission, not the noise
Four numbers tell you more than most cable-news segments: oil prices, bond yields, the dollar and central-bank decisions. If they are calm, the headline is probably just a headline.
Mistakes to Avoid
- Selling after the drop. Geopolitical selloffs are often sharpest early, so panic exits tend to lock in losses.
- Treating gold or any single asset as a guarantee. Hedges are probabilities, not promises.
- Ignoring currency risk. A foreign investment can rise in local terms and still lose in yours.
- Overreacting to forecasts. Price targets and scenario headlines are guesses, as the gold example shows.
Asked & Answered
Do wars always crash the stock market?
No. Research finds that higher geopolitical risk tends to weigh on investment, employment and stock returns, but the size and duration vary widely. Markets often absorb a shock and recover if the economy underneath stays healthy.
Why did bonds fall when stocks were under pressure in 2026?
Because the shock was inflationary. Higher oil prices raised inflation expectations, which pushed yields up and bond prices down, even while equities wobbled.
Is gold a reliable geopolitical hedge?
It can help, but it is volatile and hard to time. Gold moved sharply in both directions this year, and forecasts have repeatedly missed.
How does a Strait of Hormuz disruption affect everyday costs?
Roughly a fifth of the world’s oil normally passes through the strait. When that flow is disrupted, crude, diesel and shipping costs rise, which feeds into transport, food and manufacturing prices.
What should I do with my portfolio when conflict flares?
Start with your plan, not the news. Confirm your asset allocation matches your goals and time horizon, rebalance if you’ve drifted, and avoid large moves made in a hurry. For decisions specific to your situation, talk to a qualified financial adviser.
Discover more from The Economy
Subscribe to get the latest posts sent to your email.
Fintech & Global Finance
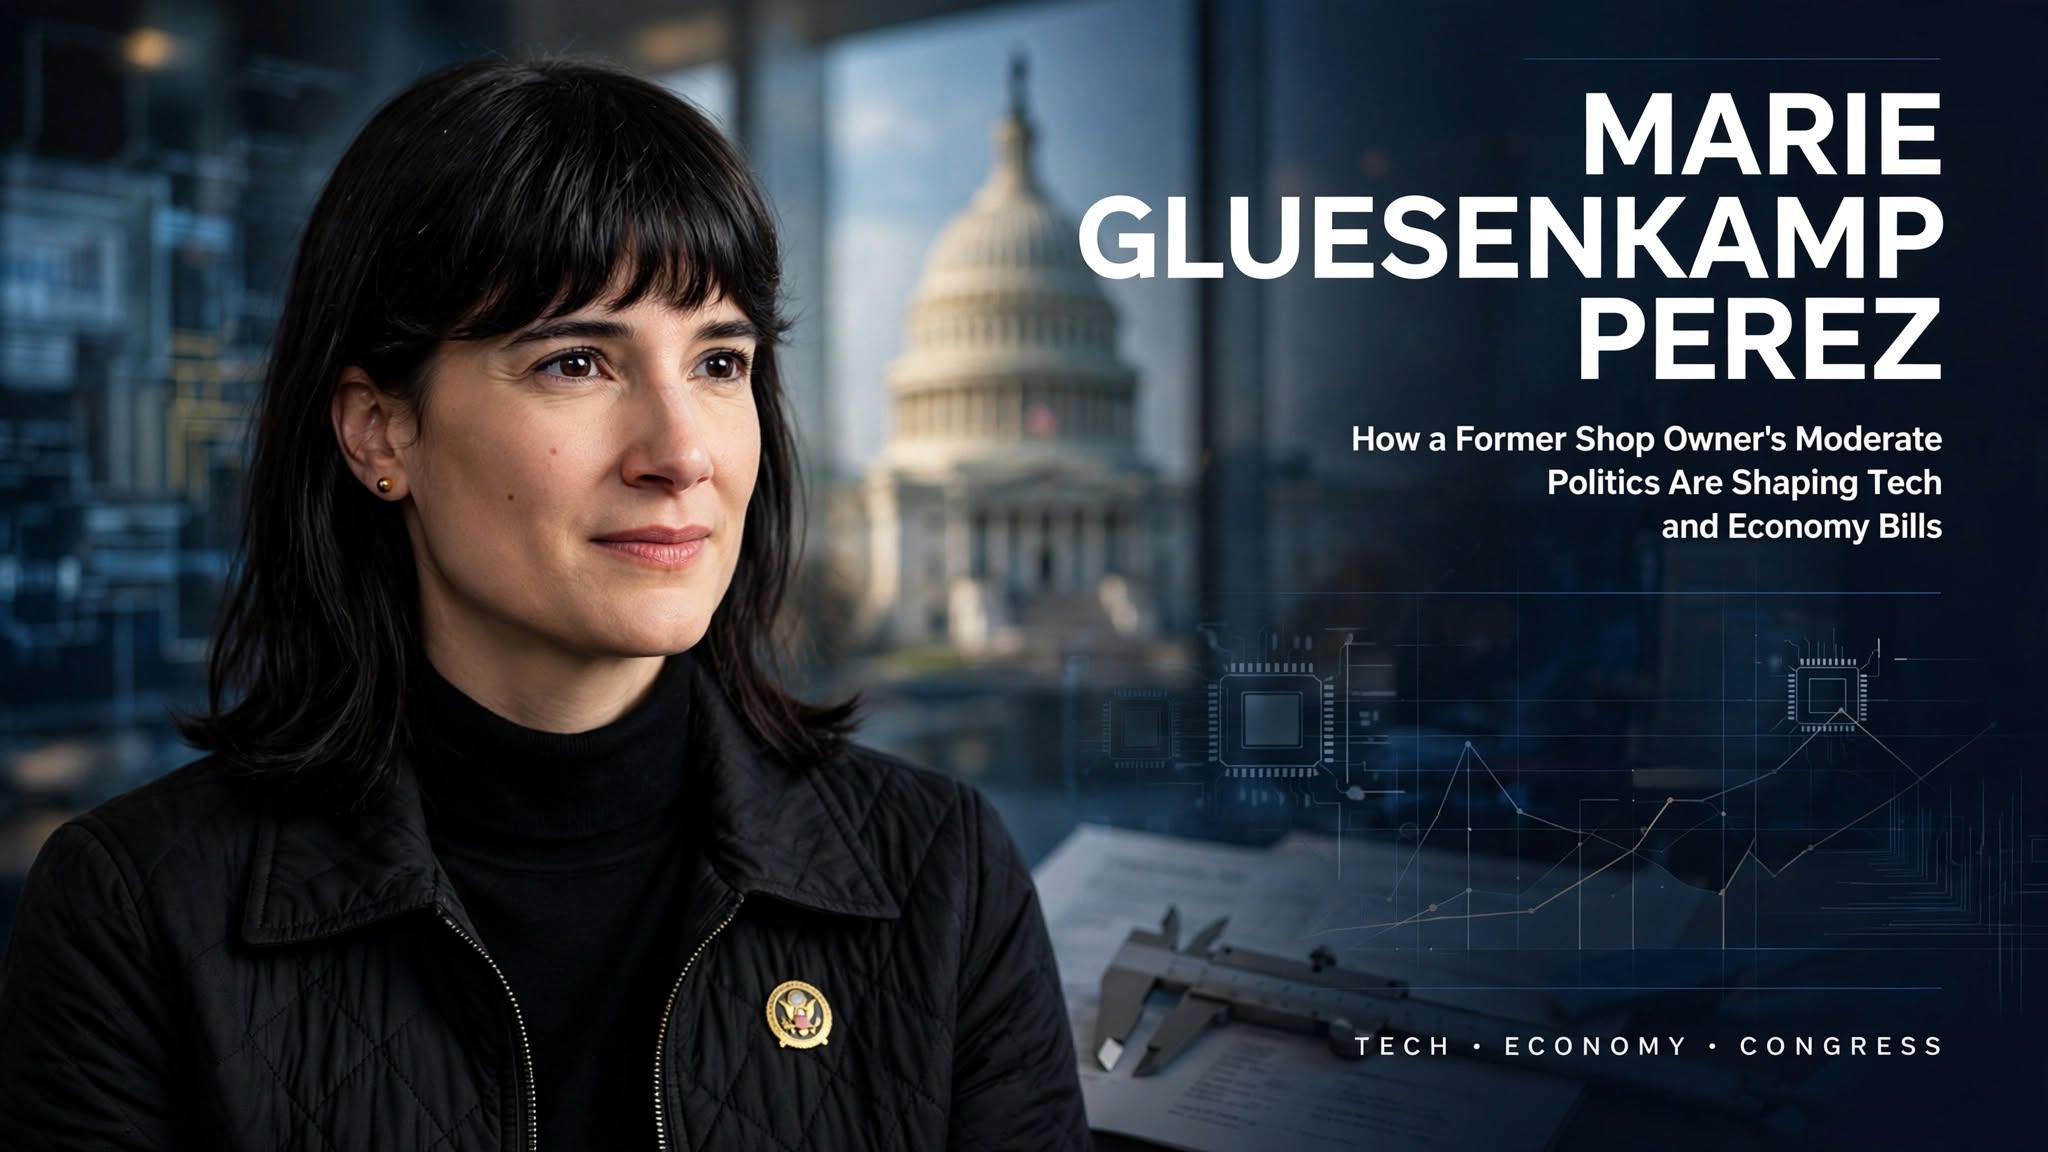
Marie Gluesenkamp Perez: How a Former Shop Owner’s Moderate Politics Are Shaping Tech and Economy Bills
Key Takeaways
- Rep. Marie Gluesenkamp Perez (D-WA-3), a former auto repair shop co-owner, has built a legislative record centered on right-to-repair, trades workforce development, and semiconductor manufacturing funding.
- She helped secure a $105 million federal investment for Analog Devices, including $80 million for Pacific Northwest projects, to modernize domestic semiconductor fabrication — reinforcing Washington’s “Silicon Forest” manufacturing base.
- Described as one of the House’s most centrist Democrats, she sits in the Problem Solvers Caucus, the Blue Dog Coalition, and the Congressional Hispanic Caucus, and serves on the House Appropriations Committee.
- She is seeking a third term in the 2026 midterms against Republican John Braun, the Washington State Senate minority leader.
- Her legislative approach consistently favors practical, trade-oriented policy over ideological framing — a positioning that has made her a notable swing-district data point heading into November.
From Auto Shop to Appropriations Committee
Gluesenkamp Perez co-owned an auto repair and machine shop with her husband before her 2022 upset win over Republican Joe Kent, a race she repeated and won again in 2024. That hands-on business background has directly shaped her legislative priorities: she has pushed bipartisan right-to-repair legislation for agricultural equipment, introduced the Fairness for the Trades Act to expand 529 education savings plans to cover trade-career tools, and worked to ease regulatory burdens on small businesses like the one she used to run.
The Semiconductor Funding Win
In one of her more tangible economy-facing wins, Gluesenkamp Perez — alongside Washington Senators Patty Murray and Maria Cantwell — helped secure $105 million for Analog Devices to modernize domestic chip fabrication, with $80 million specifically benefiting Pacific Northwest facilities, including an expansion in Camas. The investment targets mature-node semiconductors used in automotive, healthcare, aerospace, defense, and consumer electronics — chips that are less headline-grabbing than AI accelerators but arguably more embedded in everyday supply chains (a theme covered in our companion piece on 2026 silicon supply chain risk).
Where She Sits Politically
Caucus memberships tell their own story: Problem Solvers Caucus, Blue Dog Coalition, and Congressional Hispanic Caucus place her firmly in the House’s center-right Democratic lane. She has been publicly described as one of the chamber’s most centrist Democrats, willing to break from party lines on specific votes. Her appropriations work has focused heavily on constituent-level wins — from mobile home energy-efficiency provisions to Secure Rural Schools reauthorization — over broader ideological legislation.
2026 Midterm Context
Gluesenkamp Perez is defending her seat in Washington’s 3rd Congressional District against John Braun, the Washington State Senate’s Republican minority leader — a race widely watched as a bellwether for how centrist Democrats in competitive districts perform in the 2026 midterms.
What is Marie Gluesenkamp Perez known for in Congress?
Rep. Gluesenkamp Perez (D-WA-3) is known for centrist, trades- and small-business-focused legislation, including right-to-repair bills and a $105 million semiconductor manufacturing investment for the Pacific Northwest. She sits on the House Appropriations Committee and is seeking a third term in 2026 against Republican John Braun.
Discover more from The Economy
Subscribe to get the latest posts sent to your email.
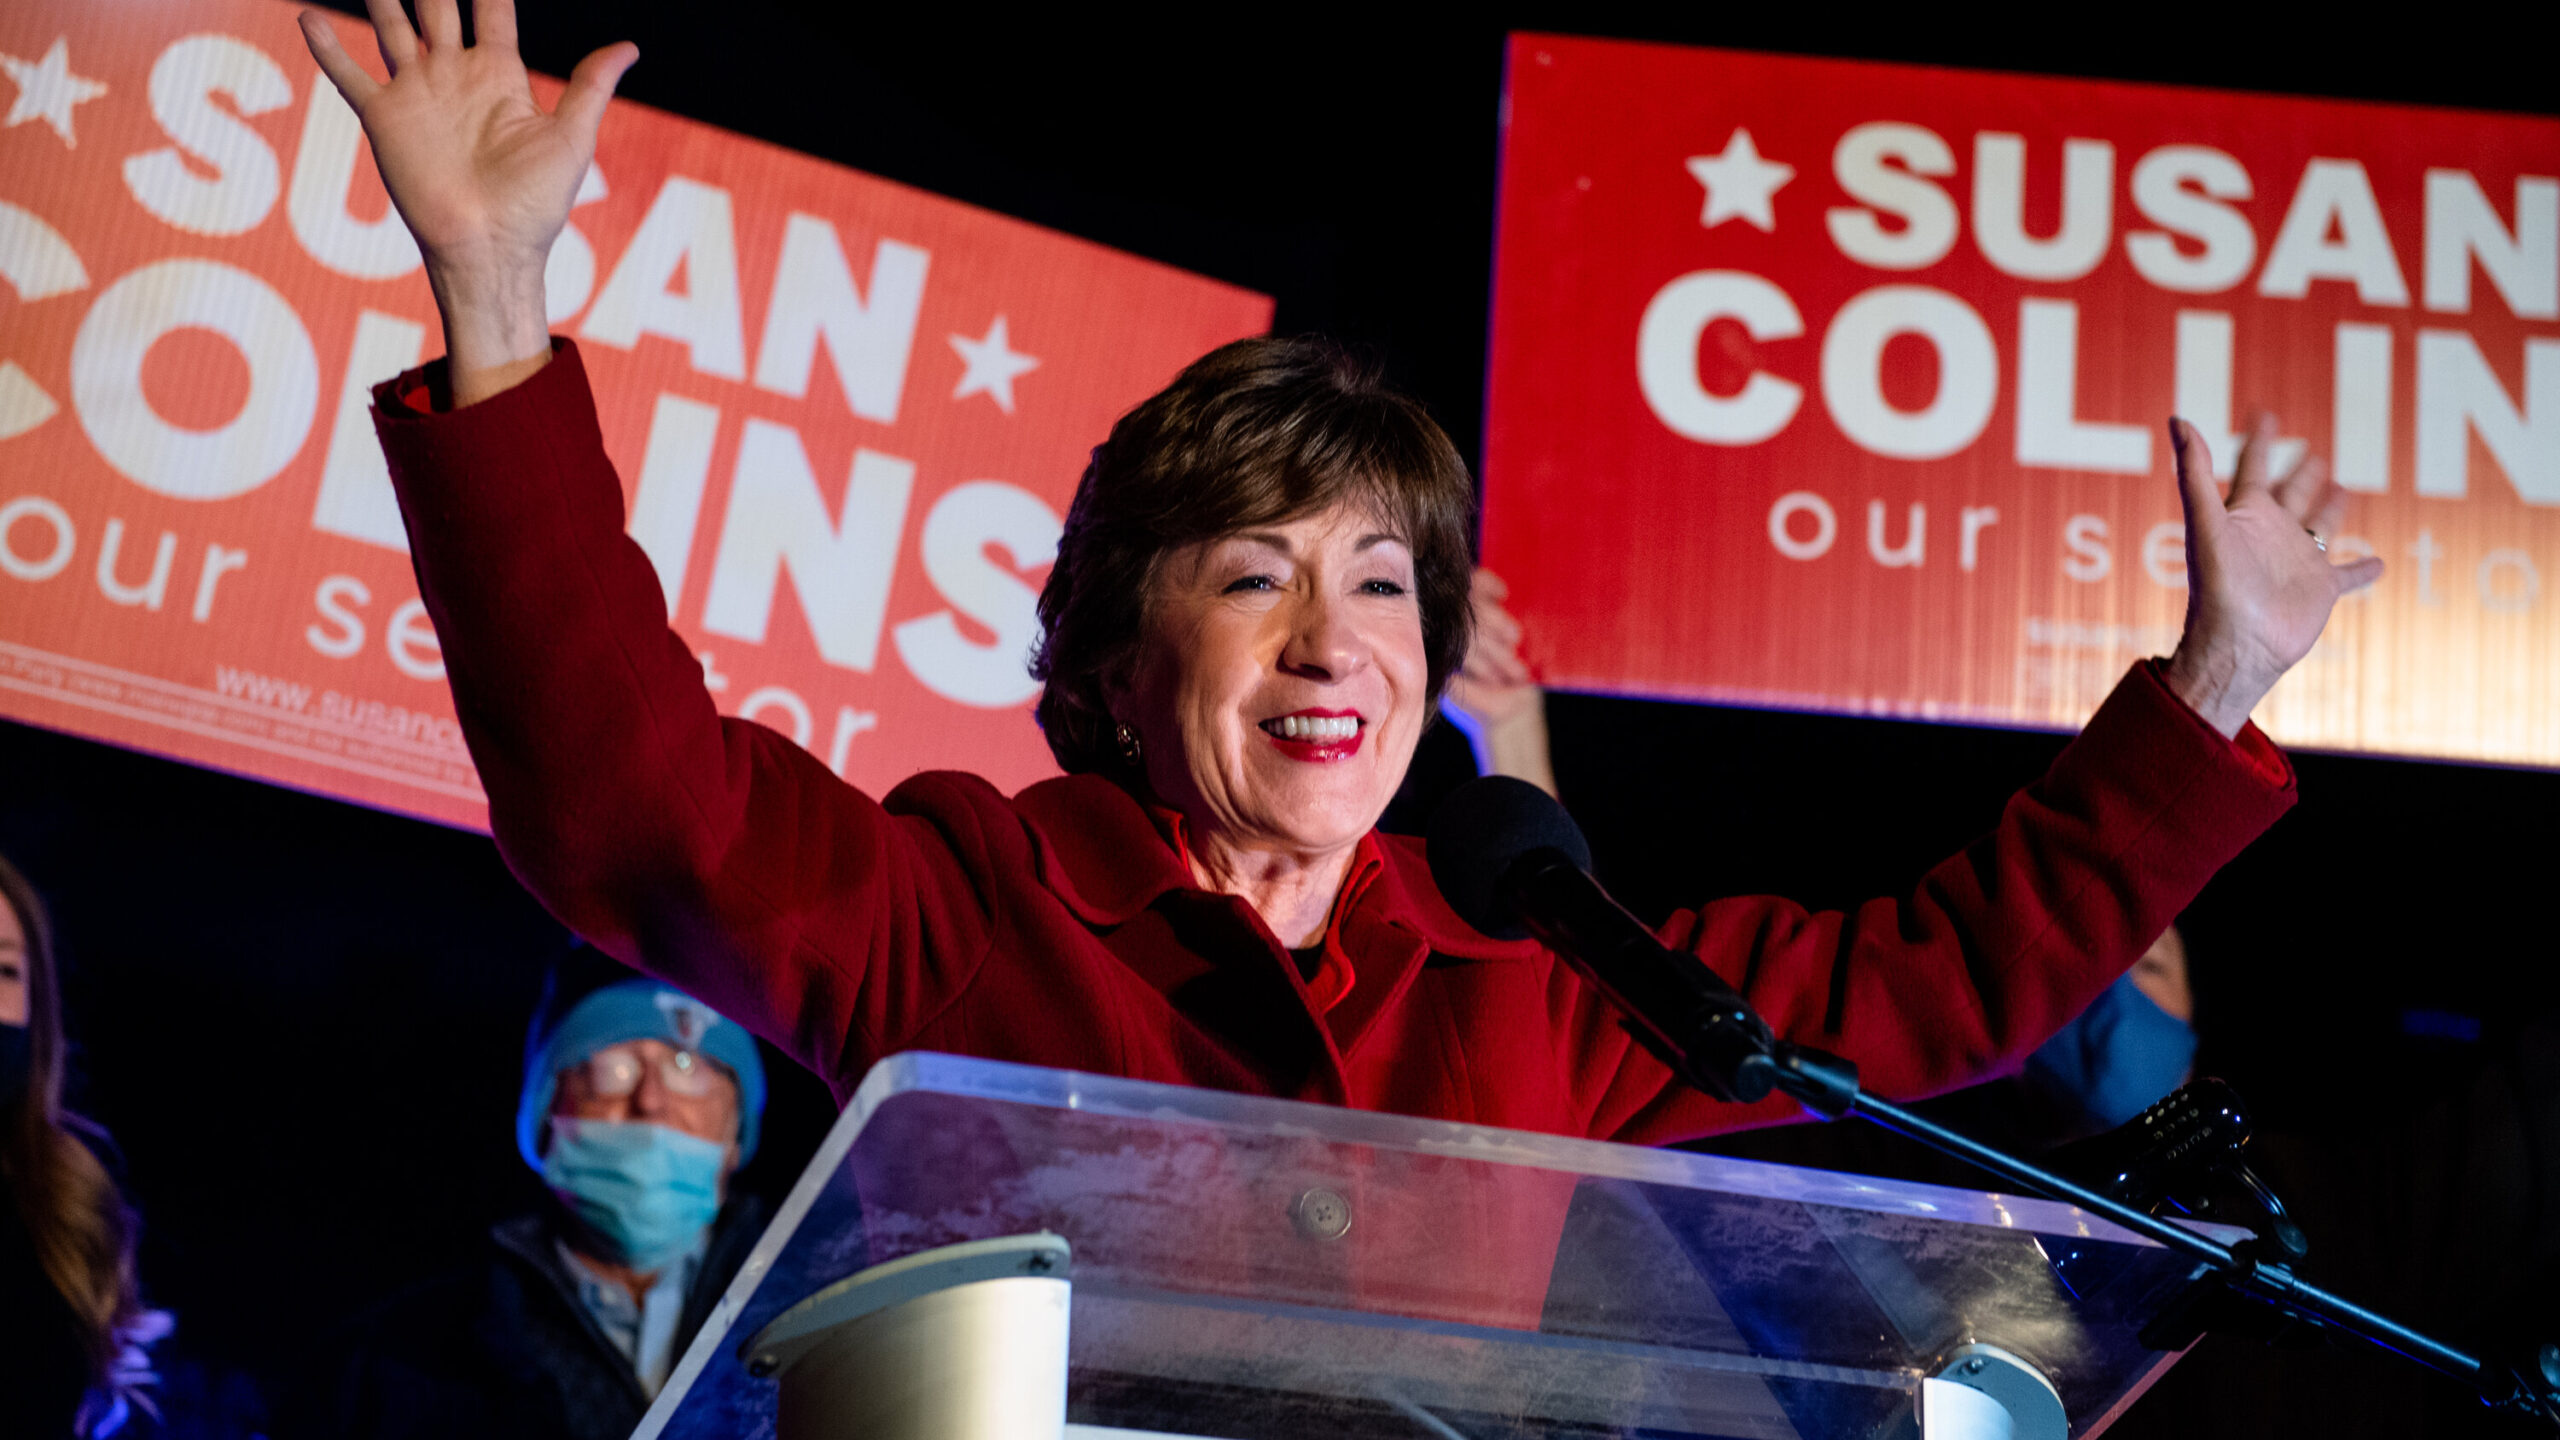
Susan Collins faces her toughest reelection yet against Troy Jackson after a chaotic Democratic candidate swap. Here’s why Maine is a genuine Senate toss-up.
Republican Sen. Susan Collins faces Democrat Troy Jackson, a former Maine Senate president, in a toss-up 2026 general election after Democrats’ original nominee, Graham Platner, was replaced through a special party nomination process. Recent polling shows Jackson with a slight edge.
For a senator who has survived six consecutive campaigns and just cast her 10,000th consecutive Senate vote, Susan Collins now faces what independent analysts are calling a genuine toss-up race — one of the clearest tests of whether Republicans can hold their Senate majority in November.
A Late, Chaotic Democratic Swap
The road to Collins’ current opponent was unusually turbulent. Maine’s Democratic field originally centered on a three-way primary between Gov. Janet Mills, oyster farmer and combat veteran Graham Platner, and former Maryland government official David Costello. Mills dropped out in April, leaving Platner as the grassroots-backed front-runner heading into the June 9 primary — a candidate whose anti-establishment profile and matched fundraising against Collins had national Democrats excited about their odds.
But Platner’s candidacy collapsed amid revelations that included past social media posts and a tattoo resembling a Nazi symbol. With the general election bearing down, the Maine Democratic Party activated an emergency special nomination process — built around county-level delegate meetings rather than a snap primary — to replace him. On July 25, that process produced Troy Jackson, a former Maine Senate president, as the party’s new standard-bearer with roughly 100 days left until Election Day.
Why the Race Is Genuinely Competitive
Despite the compressed timeline, early data suggests Jackson is not merely a placeholder candidate. A Pine Tree Poll conducted by the University of New Hampshire Survey Center showed Jackson with a three-point edge over Collins among likely general-election voters, and Fox News’ inaugural 2026 Power Rankings classify the race as a toss-up — one of roughly a dozen Senate contests that will determine which party controls the chamber.
Collins’ vulnerabilities are structural as much as political. Maine backed the Democratic presidential ticket by seven points in 2024, meaning Collins has long relied on ticket-splitting voters to survive in a state that leans against her party nationally. Democrats are also targeting her more directly than in past cycles, criticizing her comment that she doesn’t regret her 2018 vote to confirm Justice Brett Kavanaugh despite his later vote to overturn Roe v. Wade, and her continued support for Immigration and Customs Enforcement funding following a fatal shooting in Maine involving ICE agents earlier this month.
Collins, who chairs the powerful Senate Appropriations Committee, is leaning on 28 years of relationship-building with industries dependent on federal spending, along with a substantial outside-money advantage. In her campaign launch, Collins argued that “my experience, seniority and independence matter,” while Democrats have countered that “seniority without a backbone is just tenure.”
What It Means for Senate Control
Maine is one of two Senate seats Democrats are defending — or, in Collins’ case, one Republicans are defending — in a state won by the opposing party’s presidential nominee in 2024, making it a marquee Senate battleground alongside Georgia, North Carolina, and Alaska. Democrats need to net four seats nationally to reclaim the majority, and unseating Collins is widely viewed as central to that math given how few genuinely competitive Republican-held seats exist on the 2026 map.
The compressed Jackson campaign timeline is itself a variable worth watching: Collins has now defeated multiple well-funded Democratic challengers over her career, and whether Jackson can build statewide name recognition and a comparable small-dollar fundraising operation in roughly 14 weeks will likely determine whether Maine actually flips or simply stays close.
Discover more from The Economy
Subscribe to get the latest posts sent to your email.

KOSPI Crash October 2026: What Korea’s Chip Selloff Reveals

CoreWeave Stock 2026: CRWV, AI Infrastructure Debt and the Selloff Explained

OP-ED:The AI Race Has No Single Winner — And Pakistan Must Choose Its Own Future

VA Disability Rates Increase 2027: The Confirmed 3.6% COLA Explained

US–China AI Export Controls in 2026: Chips, Testing Rules and Corporate Risk

World Trade in 2026: Tariffs, Supply Chains and the Cost of Fragmentation

Global Economy Outlook 2026–27: What to Watch Ahead of the IMF October Report

Strait of Hormuz in 2026: Why Shipping Risks Matter for Oil, Insurance and Food Prices

US–China Critical Minerals Competition in 2026: Who Controls the Supply Chain?

Oil and Diesel Prices in October 2026: How Supply Shocks Can Reach Inflation

AI Chip Demand in 2026: What TSMC, Nvidia and Data-Center Spending Reveal

Q3 2026 Earnings Season: The Bank, AI and Consumer Signals That Really Matter

Treasury Yields in 2026: Why Higher Bond Rates Matter for Stocks, Mortgages and Savings

KOSPI 2026: Why South Korean Stocks Turned Volatile and What AI Investors Should Watch

World’s Largest Economies: Ranking the Top Global Powers

Global Pension Systems Ranked: The World’s Best and Worst Retirement Frameworks

Elon Musk’s Next Moves: Disrupting the 2026 Global Economy

Crude Oil & Petroleum Market Analysis: OPEC+ Decisions and Price Forecasts

Pakistan Economy 2026: Inside the SBP’s Balancing Act

GasBuddy Market Insights: How Crude Price Shifts Impact Local Fuel Cost Averages

Global Equity Market Divergence: US Tech vs. European Dividend Stocks vs. Asian Growth

IMF & World Bank Global Economic Outlook: Growth Forecasts Across Europe and Asia

Bitcoin Price Forecast 2026–2027: Will the 4-Year Cycle Hold?

Silver Price Today: Why the Xi-Trump AI Standoff Is Fueling a Safe-Haven Rally

The Future of Silicon: Supply Chain Vulnerabilities in the 2026 Tech Sector

Asian Stock Markets 2026: Japan, China, Pakistan & More

Stagflation vs. Soft Landing: How Central Bank Rates Are Reshaping European and Asian Economies

SpaceX IPO: How Aerospace Is Reshaping Tech Startup News
-

 Markets & Finance9 months ago
Top 15 Stocks for Investment in 2026 in PSX: Your Complete Guide to Pakistan’s Best Investment Opportunities
-

 Analysis8 months ago
Johor’s Investment Boom: The Hidden Costs Behind Malaysia’s Most Ambitious Economic Surge
-

 Analysis8 months ago
Top 10 Stocks for Investment in PSX for Quick Returns in 2026
-

 Banks9 months ago
Best Investments in Pakistan 2026: Top 10 Low-Price Shares and Long-Term Picks for the PSX
-

 Analysis8 months ago
Brazil’s Rare Earth Race: US, EU, and China Compete for Critical Minerals as Tensions Rise
-

 Investment9 months ago
Top 10 Mutual Fund Managers in Pakistan for Investment in 2026: A Comprehensive Guide for Optimal Returns
-

 Global Economy10 months ago
15 Most Lucrative Sectors for Investment in Pakistan: A 2025 Data-Driven Analysis
-

 Global Economy10 months ago
Pakistan’s Export Goldmine: 10 Game-Changing Markets Where Pakistani Businesses Are Winning Big in 2025