
Exclusive
Why Economists Are Raising the US Economic Outlook for 2026 Above 2% Despite Trumponomics
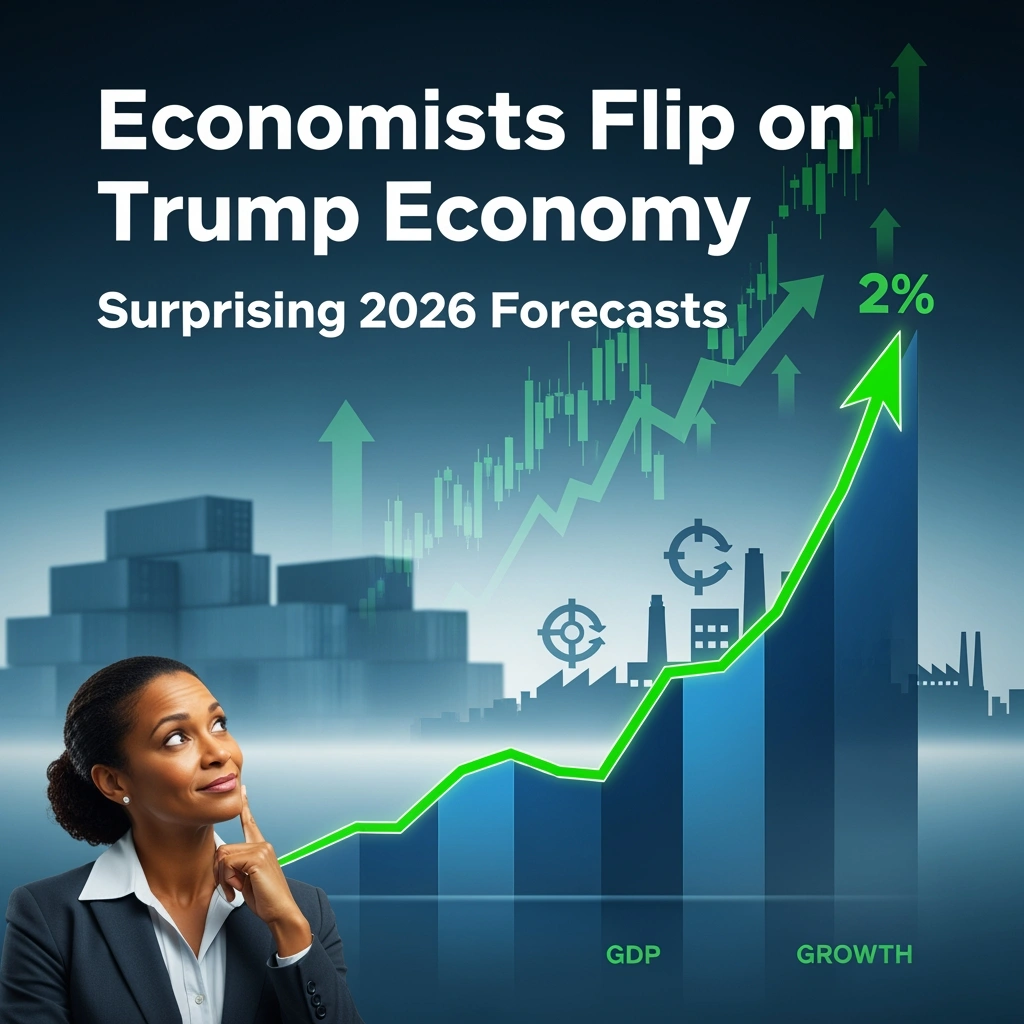
There’s a peculiar rhythm to economic forecasting in polarized times. Last year, as President Trump’s second term began with talk of sweeping tariffs and aggressive trade renegotiations, professional economists did what they’re trained to do: they downgraded their growth projections. The US economic outlook 2026 dimmed considerably, with consensus forecasts sliding from a comfortable 2.4% GDP growth to a more anemic 1.8% by mid-2025.
Now, barely six months later, those same economists are quietly walking back their pessimism. The latest Wall Street Journal survey of forecasters shows the 2026 GDP forecast rebounding to 2.2%—a meaningful revision that signals something important has shifted in how the professional class views Trumponomics impact on the American economy.
It’s a classic case of markets—and economists—hating uncertainty more than bad news. What we’re witnessing isn’t necessarily a vindication of Trump’s economic policies, nor is it a repudiation. Rather, it’s a sophisticated recalibration based on three critical insights: the policies are more predictable than feared, the underlying economy has proven remarkably resilient, and the full policy mix includes growth-positive elements that may offset the drag from protectionism.
This article examines why economic sentiment has reversed course, what the latest data reveals about US GDP growth 2026 forecast, and what this recalibration means for investors, policymakers, and everyday Americans navigating an economy caught between competing forces.
The Evolution of Forecasts: From Pre-Election Optimism to Tariff Fears and Back
To understand where we are, we need to trace where we’ve been. The forecast trajectory for 2026 reads like a volatility chart.
In late 2024, before the November election, economists were cautiously optimistic. The Federal Reserve had engineered what looked increasingly like a soft landing—inflation cooling from its 2022 peaks without triggering recession. The Blue Chip Economic Indicators survey showed consensus 2026 GDP forecast hovering around 2.3%, roughly in line with estimates of potential growth. The Conference Board projected similar numbers, while the IMF’s October 2024 World Economic Outlook pegged US growth at 2.2% for 2026.
Then came the election and its aftermath. President Trump’s victory brought promises of universal baseline tariffs, potential 60% levies on Chinese imports, and sweeping immigration restrictions. For economists schooled in the costs of protectionism, alarm bells rang. The Trump tariffs economic growth calculus looked decidedly negative.
By February 2025, the downgrades began in earnest. Goldman Sachs economists, who had been relatively optimistic, trimmed their 2026 forecast from 2.4% to 1.9%. The Wall Street Journal’s monthly survey saw its consensus plummet to 1.8% by March 2025—the lowest reading since the COVID recovery. The National Association for Business Economics (NABE) survey told a similar story, with members citing trade policy uncertainty as their top concern. Even typically sanguine forecasters like Vanguard’s economic team reduced their baseline scenario.
The concerns were well-founded in economic theory. Tariffs function as consumption taxes, raising prices for businesses and consumers. Immigration restrictions, in an economy near full employment, threatened to constrain labor supply and boost wage pressures. The Tax Foundation estimated that comprehensive tariff implementation could reduce GDP by 0.5-0.7 percentage points. Oxford Economics modeled potential scenarios showing growth dropping below 1.5% under aggressive trade action.
But here’s what economists didn’t fully anticipate: the gap between campaign rhetoric and implemented policy, the market’s growing comfort with Trump’s negotiating style, and the resilience of the underlying economic fundamentals.
What the Latest Surveys Reveal: A Quiet Consensus Emerges
Fast forward to January 2026, and the forecast landscape looks strikingly different. The latest Wall Street Journal survey, conducted in early January and released last week, shows the consensus US economic outlook 2026 rising to 2.2%—a 40-basis-point upgrade from the trough just months ago.
But the WSJ survey doesn’t stand alone. A convergence is happening across the forecasting community:
Major Forecast Revisions (2026 GDP Growth):
- Goldman Sachs: Now projecting 2.5%, up from 1.9% (June 2025 revision)
- Morgan Stanley: 2.3%, revised from 1.7%
- JP Morgan: 2.1%, up from 1.8%
- Deloitte Economic Outlook: 2.2% baseline scenario
- Blue Chip Economic Indicators: Consensus 2.2% (January 2026)
- IMF World Economic Outlook Update: 2.3% (January 2026 release)
- World Bank Global Economic Prospects: 2.1% (January 2026)
- Conference Board: 2.0% (December 2025 revision)
The pattern is unmistakable. Institutions that slashed forecasts in late 2024 and early 2025 are now rebuilding their growth expectations. Goldman Sachs economist Jan Hatzius, whose team produces some of Wall Street’s most closely watched forecasts, noted in a recent client note that “the policy uncertainty premium has declined meaningfully as the administration’s approach has become clearer and more selective than initially feared.”
The Federal Reserve’s own Summary of Economic Projections, released at the December 2025 FOMC meeting, shows Fed governors’ median 2026 GDP forecast at 2.0%—unchanged from September but notably not downgraded despite ongoing policy uncertainty. The Atlanta Fed’s GDPNow model, which provides real-time tracking, has been running consistently above 2% for Q1 2026.
Even international observers are upgrading. The OECD’s November 2025 Economic Outlook raised its US forecast to 2.2%, while private European forecasters like Capital Economics shifted from recession warnings to modest growth projections.
What explains this collective revision? The answer lies not in economists becoming Trump enthusiasts, but in three interconnected developments that have reduced tail risks and clarified the policy trajectory.
Why Concerns Have Receded: Pricing In Predictability
The first and perhaps most important factor: policy clarity has increased, and actual implementation has been more measured than feared.
While President Trump imposed selective tariffs—including 20% levies on certain steel and aluminum imports and targeted increases on Chinese electric vehicles and semiconductors—the promised universal baseline tariff never materialized. The threatened 60% across-the-board China tariffs were replaced by sector-specific measures and ongoing negotiations. The administration has clearly prioritized using tariff threats as negotiating leverage rather than as a comprehensive policy overhaul.
“We’ve essentially moved from pricing in worst-case scenarios to pricing in what’s actually happening,” explains Mark Zandi, chief economist at Moody’s Analytics, in a recent podcast. “The administration has proven more pragmatic than the campaign suggested.”
This matters enormously for economic modeling. A 10% universal tariff has very different effects than targeted 20-25% tariffs on specific sectors. The former would ripple through the entire price system; the latter creates manageable adjustments in affected industries while leaving broader consumption patterns largely intact.
The immigration policy follow-through has similarly been less disruptive than modeled. While border enforcement has tightened and deportations have increased, mass deportation scenarios haven’t materialized. The labor market, while showing some regional tightness in agriculture and construction, hasn’t experienced the supply shock that February 2025 forecasts assumed. Initial claims for unemployment insurance remain near historic lows, and workforce participation has actually edged up.
Second, the underlying economic fundamentals have proven remarkably robust, providing a buffer against policy headwinds.
Consumer spending, which accounts for roughly 70% of US GDP, has maintained momentum through the uncertainty. Retail sales grew 3.2% in Q4 2025 (year-over-year), supported by solid wage growth, accumulated pandemic savings still working through the system, and a strong labor market. The unemployment rate stood at 3.9% in December 2025—above the 3.5% lows of 2023 but still historically tight.
Corporate balance sheets remain healthy. S&P 500 companies entered 2026 with leverage ratios near two-decade lows and cash positions that can fund investment even if financing conditions tighten. Capital expenditure plans, particularly in technology and infrastructure, continue to show strength. The Deloitte CFO Signals survey indicates that 64% of chief financial officers plan to increase capital spending in 2026—a vote of confidence in medium-term growth prospects.
The financial system is stable. Banks are well-capitalized, credit spreads remain reasonable, and there are no obvious bubbles threatening systemic stability. The Fed’s financial stability report, released in November 2025, identified no major vulnerabilities requiring immediate policy action. This stands in sharp contrast to the fragile conditions that preceded the 2008 financial crisis or even the regional banking stress of early 2023.
Third, economists have recalibrated their models to account for growth-positive policy elements that were underweighted in initial assessments.
The extension and expansion of the 2017 Tax Cuts and Jobs Act provisions—which were set to expire in 2025—provides meaningful fiscal stimulus. The Tax Foundation estimates that making these cuts permanent and adding new provisions (including expanded bonus depreciation and R&D expensing) could add 0.3-0.5 percentage points to GDP growth over a two-year horizon.
Deregulation across energy, finance, and technology sectors has proceeded faster than anticipated. While the economic effects of regulatory relief are notoriously difficult to quantify, surveys of business sentiment show meaningful improvement in perceived operating freedom. The National Federation of Independent Business (NFIB) optimism index rose 8 points between mid-2025 and January 2026, with “government regulations” dropping from the top concern to fourth place.
Energy policy has tilted decisively toward production maximization. Permits for drilling on federal lands have accelerated, and the administration has fast-tracked LNG export facilities. While this carries environmental costs, the economic modeling clearly shows near-term GDP benefits from increased domestic energy production and exports. The Energy Information Administration projects US crude oil production reaching 13.5 million barrels per day in 2026—a record that supports both GDP growth and the trade balance.
Potential Upside Drivers: Tax Cuts, Productivity, and the AI Wildcard
Beyond the recession of specific fears, there are genuine positive scenarios that some economists now see as plausible upside risks to the 2.2% consensus.
The most significant involves productivity growth. After decades of disappointing productivity performance—the so-called “productivity slowdown” that puzzled economists since the early 2000s—there are tantalizing hints of acceleration. Labor productivity grew at a 2.3% annual rate in Q3 2025, following 2.5% in Q2. These numbers, if sustained, would represent a meaningful break from the 1.3% average of the 2010-2019 period.
The driver? Artificial intelligence and related technologies may finally be showing up in the productivity statistics. Goldman Sachs research suggests that generative AI could boost productivity growth by 0.3-0.5 percentage points annually over the next decade as adoption spreads beyond early-adopting tech firms into traditional sectors. While productivity is notoriously hard to forecast, the possibility of sustained acceleration represents the most consequential upside scenario for long-term growth.
“If we’re entering a genuine productivity boom driven by AI diffusion, then 2.5-3% growth becomes achievable without triggering inflation,” notes Northwestern University economist Diane Swonk. “That would be the best-case scenario—and it’s not impossible.”
Tax policy provides another potential accelerant. Beyond simply extending existing cuts, there’s discussion of further corporate tax reduction and expanded investment incentives. While the fiscal sustainability of such measures is questionable, the growth effects in the near term could be meaningful. The Penn Wharton Budget Model estimates that comprehensive tax reform along the lines being discussed could add 0.2-0.4 percentage points to 2026 growth, though at the cost of significantly larger deficits.
Infrastructure spending, ironically, could provide bipartisan stimulus. Despite political dysfunction, there’s surprising consensus on the need for infrastructure investment, particularly in broadband, the electrical grid (to support AI data centers and EV charging), and water systems. The Infrastructure Investment and Jobs Act passed in 2021 continues to ramp up spending, and there are indications of potential additional packages. These have multiplier effects that many mainstream models may be underestimating.
Consumer balance sheets also carry upside potential. Household debt service ratios remain well below pre-2008 levels, suggesting capacity for increased borrowing if consumers choose to leverage themselves. The median FICO score has risen to 717—the highest in decades—indicating broad creditworthiness. If confidence continues improving and consumers decide to spend rather than save, consumption growth could exceed the modest projections embedded in current forecasts.
Lingering Risks: Inflation Persistence, Trade Escalation, and Fiscal Limits
Yet for all the upgraded optimism, significant downside risks remain—and prudent analysts are quick to enumerate them.
Inflation hasn’t fully surrendered. Core PCE inflation stood at 2.8% in December 2025, still uncomfortably above the Fed’s 2% target. The disinflationary progress that characterized 2023-2024 has stalled. If tariffs broaden or immigration restrictions tighten further, price pressures could reaccelerate. The Cleveland Fed’s inflation nowcast suggests core inflation may tick up to 3.0% by mid-2026 under current policy trajectories.
The Fed faces an uncomfortable dilemma. With inflation above target but growth forecasts modest, the central bank has limited room for error. The market currently prices in one 25-basis-point rate cut in 2026—far fewer than the four cuts anticipated a year ago. If inflation proves stickier than expected, the Fed may need to maintain restrictive policy longer, or even hike again, which would pressure growth. Goldman Sachs assigns a 25% probability to a “no-landing” scenario where persistent inflation forces renewed tightening.
Trade policy remains a wildcard. While the administration has been more selective than feared, the tariff toolkit remains on the table. Negotiations with China remain contentious, and there are indications of potential new actions on autos and pharmaceuticals. Each escalation carries ripple effects through supply chains that are difficult to model. The Peterson Institute for International Economics maintains that comprehensive tariff implementation could still reduce GDP by 0.5-1.0 percentage points if deployed broadly.
Global retaliation poses additional risks. The EU has already implemented measured counter-tariffs on $6 billion in US goods. China has responded with restrictions on rare earth exports and agricultural purchases. If tit-for-tat escalation accelerates, US exporters—particularly in agriculture, aerospace, and professional services—could face significant headwinds. The National Association of Manufacturers warns that export-dependent sectors remain vulnerable to policy shifts.
Fiscal sustainability concerns are mounting. The Congressional Budget Office projects the federal deficit reaching $2.0 trillion in fiscal 2026—roughly 7% of GDP during a period of relative prosperity. If tax cuts expand without offsetting spending reductions, these deficits could swell further. While markets have thus far absorbed Treasury issuance without difficulty, there are limits to fiscal tolerance.
Higher deficits push up long-term interest rates, crowd out private investment, and create vulnerability to future crises. The 10-year Treasury yield has climbed from 3.8% in mid-2025 to 4.4% currently—not yet problematic, but moving in a concerning direction. If foreign buyers (particularly China and Japan) reduce Treasury holdings or if inflation fears intensify, financing costs could jump, creating a drag on growth that swamps policy stimulus.
Political dysfunction in Washington adds uncertainty. With narrow margins in Congress, legislative gridlock on fiscal and regulatory matters could prevent coherent policy implementation. The debt ceiling fight looms again in mid-2026, carrying the risk of another damaging standoff. These political economy factors don’t appear directly in GDP models but affect business confidence and planning horizons.
Global Ripple Effects and Comparative Outlooks
The US economic trajectory doesn’t unfold in isolation. How America performs relative to other major economies shapes capital flows, currency movements, and global growth dynamics.
The latest forecasts show US GDP growth 2026 forecast outpacing most developed economies. The Eurozone faces persistent structural challenges—aging demographics, energy dependence, and fiscal fragmentation—that constrain growth to around 1.3%. Germany, Europe’s largest economy, may barely reach 1.0% as manufacturing weakness persists. The UK, still managing post-Brexit adjustments and political uncertainty, is projected at 1.5%.
Japan presents an interesting case. After decades of stagnation, modest reforms and inflation returning to positive territory have created cautious optimism. The IMF projects 1.1% growth for Japan in 2026—underwhelming in absolute terms but representing relative improvement. The yen’s weakness has boosted export competitiveness, though at the cost of eroding real purchasing power for Japanese consumers.
China’s trajectory remains the great uncertainty in global forecasting. Official targets suggest 4.5-5.0% growth, but private analysts are increasingly skeptical. The property sector downturn continues to metastasize, local government debt pressures mount, and demographic headwinds intensify. Consensus among Western forecasters has settled around 4.2% for 2026—still high by developed economy standards but representing continued deceleration for the world’s second-largest economy.
This comparative context matters because US outperformance attracts capital. The dollar has strengthened against most major currencies, reflecting both higher relative growth and more attractive yields. This creates a virtuous cycle for US assets but potentially complicates the Fed’s inflation fight, as a strong dollar pressures commodity prices upward and tightens financial conditions globally.
Emerging markets face squeeze from multiple directions. Higher US yields pull capital away from riskier markets. A strong dollar increases debt servicing costs for the many countries that borrowed in dollars. Trade policy uncertainty disrupts supply chains that many emerging economies depend upon. The Institute of International Finance notes that emerging market growth forecasts have been revised down by 0.3 percentage points on average for 2026, partly reflecting spillovers from US policy uncertainty.
Yet there are winners in the new configuration. Mexico benefits from nearshoring trends and USMCA trade advantages, with forecasts around 2.7%. India continues to attract investment as a China alternative, with projections near 6.5%. Vietnam, Indonesia, and Poland have emerged as beneficiaries of supply chain diversification.
The global picture, then, shows the US growing faster than most developed economies but slower than major emerging markets—a middle ground that reflects both American strengths (dynamism, innovation, deep capital markets) and constraints (high debt levels, political polarization, demographic pressures).
What This Means for Investors, Policymakers, and Everyday Americans
So economists are upgrading forecasts. What does that actually mean beyond wonky spreadsheets and academic debates?
For investors, the message is nuanced. A 2.2% growth environment is neither boom nor bust—it’s a Goldilocks scenario where corporate earnings can expand modestly without triggering inflation that forces aggressive Fed tightening. Equity market valuations currently reflect considerable optimism, with the S&P 500 trading near 21x forward earnings. That’s sustainable if earnings grow 8-10%, which is plausible in a 2.2% GDP environment with healthy margins.
Fixed income becomes more interesting. If the Fed cuts once in 2026 as markets expect, the yield curve should steepen, benefiting longer-duration bonds. But inflation risks argue for caution on long-duration exposure. The classic 60/40 portfolio may finally find firmer footing after years of challenges, though with returns likely in the high single digits rather than the double-digit bonanza of recent years.
Real assets deserve attention. If inflation proves persistent in the 2.5-3.0% range, commodities, real estate, and infrastructure investments provide natural hedges. Gold has already rallied to near-record levels, reflecting both inflation hedging and geopolitical risk premiums. Energy equities could benefit from both production-friendly policy and constrained global supply.
For policymakers, the upgraded outlook creates breathing room but not comfort. The Fed can likely hold rates steady rather than hiking again, but cuts depend on inflation cooperating. Fiscal authorities face the awkward reality that deficits remain high despite solid growth—a structural problem that will require painful adjustments eventually.
Trade negotiators operate in a window where economic resilience allows aggressive bargaining without immediate crisis, but the patience of affected industries has limits. The agricultural sector, for example, has absorbed significant export losses from retaliatory tariffs; continued pain could force policy adjustments.
Regulatory agencies implementing deregulation must balance growth objectives with prudential oversight. The 2008 financial crisis demonstrated the costs of regulatory capture and inadequate supervision. Finding the right equilibrium—enough oversight to prevent systemic risk, enough freedom to enable innovation—remains deeply challenging.
For everyday Americans, a 2.2% growth economy means the labor market should remain relatively healthy. Unemployment may drift up toward 4.2-4.5% but not spike toward recessionary levels. Wage growth should continue modestly above inflation, supporting real income gains. That said, the gains will be uneven—knowledge workers in tech hubs fare better than manufacturing workers in legacy industries.
Housing affordability remains challenged. With mortgage rates likely staying in the 6-7% range and home prices elevated, homeownership hurdles persist for younger households. Renters face similar pressures as construction hasn’t kept pace with household formation.
The wealth gap continues widening. Asset price appreciation disproportionately benefits the already-wealthy, while those dependent on wages face stagnant or modestly improving living standards. This dynamic, while not new, carries political implications that feed back into economic policy debates.
Perhaps most importantly, everyday Americans should recognize that consensus forecasts have error bars. A 2.2% forecast could easily become 1.5% if trade escalation accelerates or 3.0% if productivity surges. The range of outcomes remains wide, and individual circumstances vary enormously based on industry, geography, and skill level.
Looking Ahead: Confidence Tempered by Uncertainty
The story of economists Trump policies 2026 assessment is ultimately one of professionals adjusting their models to reality. The downgrade cycle of late 2024 and early 2025 reflected genuine concerns about policy direction; the upgrade cycle now underway reflects recognition that implementation has been more measured and the economy more resilient than feared.
But let’s be clear: raising forecasts from 1.8% to 2.2% doesn’t mean all is well. It means the probability of near-term recession has diminished while the likelihood of moderate, unspectacular growth has increased. It’s the economic equivalent of revising a student’s grade from a C-minus to a C-plus—better, but hardly honor roll material.
The US economic outlook 2026 remains clouded by uncertainty that no model fully captures. Geopolitical tensions from Ukraine to the Middle East to Taiwan carry tail risks. Technological disruption could accelerate or disappoint. Political polarization could intensify or ease. Climate events grow more frequent and severe, creating economic costs not fully reflected in GDP forecasts.
What economists have learned—or relearned—through this cycle is humility. The confident downgrades of early 2025 now look premature, just as the comfortable 2.4% forecasts of late 2024 proved naïve. Economic forecasting remains more art than science, particularly in an era where policy whiplash and structural change make historical relationships less reliable.
The honest assessment is this: The US economy appears positioned for moderate growth in 2026, supported by resilient fundamentals and more predictable policy than initially feared. Inflation pressures remain elevated but not runaway. The labor market continues near full employment. Financial stability looks sound. Productivity may be inflecting upward.
Yet meaningful risks persist across multiple dimensions—inflation, trade, fiscal sustainability, political dysfunction, and global spillovers. The margin for error remains thin. Policy mistakes could tip the economy toward stagnation; external shocks could disrupt even the most carefully constructed forecasts.
For those watching from outside the economics profession, the takeaway should be measured optimism tempered by realism. The worst-case scenarios of early 2025 have receded. The best-case scenarios remain plausible but not assured. What’s most likely is muddle-through growth—enough to keep recession at bay, not enough to solve structural challenges.
And perhaps that’s fitting. In an era of extraordinary change and genuine uncertainty, muddling through with modest growth and manageable risks might be the best outcome we can reasonably expect. Economists have upgraded their forecasts because that’s what the data suggests. Whether those forecasts prove accurate will depend on countless decisions—by policymakers, business leaders, consumers, and global actors—that haven’t yet been made.
The one certainty? Six months from now, economists will be revising their forecasts again. And the cycle will continue.
Discover more from The Economy
Subscribe to get the latest posts sent to your email.


Discover the world’s strongest currencies in 2026 — ranked by exchange value, economic backing & purchasing power. From Kuwait’s $3.27 dinar to the Swiss franc’s unmatched stability, the definitive guide.
Where Money Is Worth More Than You Think
There is a question that unsettles most travellers the moment they land at an unfamiliar airport and squint at a currency board: how much, exactly, is this money worth? The instinct is to reach for the US dollar as a yardstick — to ask, almost reflexively, whether the local note in your hand represents more or less than a single greenback. That reflex is understandable. The dollar remains, by a vast margin, the most traded and most held reserve currency on the planet. But it is not the strongest.
That distinction belongs to a small Gulf emirate whose population would fit comfortably inside greater Manchester, and whose currency has quietly dominated every global ranking for more than two decades. It is joined on the podium by neighbours whose names rarely make mainstream financial headlines, and by a landlocked Alpine republic whose monetary tradition has become almost mythological in global finance circles.
Currency strength is, of course, a deceptively complicated concept. A high nominal exchange rate — the number of US dollars one unit of a foreign currency can buy — is the most intuitive measure, but it captures only part of the picture. Purchasing power parity (PPP), the stability of the issuing central bank, inflation history, current-account balances, and forex reserve depth all feed into a fuller assessment of monetary credibility. The rankings below attempt to honour that complexity: they are ordered primarily by nominal value against the USD as of early March 2026, but enriched with structural and macroeconomic context at every step.
For travellers, the implications are vivid and practical: a strong home currency means your holiday budget stretches further in weaker-currency markets. For investors, it signals where monetary policy is disciplined, inflation is tamed, and capital preservation is most plausible. For economists, it is a mirror of a nation’s fiscal choices — and occasionally its geological luck.
Here, then, is the definitive ranking of the world’s strongest currencies in 2026.

Methodology: How We Ranked the World’s Strongest Currencies
Ranking currencies by strength is not a single-variable exercise. Our methodology combines four weighted criteria:
1. Nominal exchange rate vs. USD (primary weight: 50%) — the most cited metric globally; how many US dollars one unit of the currency buys as of early March 2026.
2. Purchasing Power Parity (PPP) and domestic price stability (25%) — drawing on the IMF World Economic Outlook database and World Bank ICP data to assess what each currency actually buys at home.
3. Central bank credibility, forex reserves, and current-account balance (15%) — using BIS data, central bank publications, and IMF Article IV consultations.
4. Long-term inflation track record and monetary regime stability (10%) — a currency pegged rigidly to the dollar for decades earns credit for predictability; a currency that preserved purchasing power across multiple global crises earns even more.
Geographic territories whose currencies are pegged 1:1 to a sovereign currency (Gibraltar Pound, Falkland Islands Pound) are noted but not separately ranked; they effectively mirror their parent currency’s fundamentals.
The World’s Strongest Currencies in 2026: Comparative Table
| Rank | Country / Territory | Currency | Code | Value vs. USD (Mar 2026) | 1-Year Change | Exchange Regime |
|---|---|---|---|---|---|---|
| 1 | Kuwait | Kuwaiti Dinar | KWD | ≈ $3.27 | Stable (±0.5%) | Managed basket peg |
| 2 | Bahrain | Bahraini Dinar | BHD | ≈ $2.66 | Stable (fixed) | Hard USD peg |
| 3 | Oman | Omani Rial | OMR | ≈ $2.60 | Stable (fixed) | Hard USD peg |
| 4 | Jordan | Jordanian Dinar | JOD | ≈ $1.41 | Stable (fixed) | Hard USD peg |
| 5 | United Kingdom | Pound Sterling | GBP | ≈ $1.26 | −1.8% | Free float |
| 6 | Cayman Islands | Cayman Dollar | KYD | ≈ $1.20 | Stable (fixed) | Hard USD peg |
| 7 | Switzerland | Swiss Franc | CHF | ≈ $1.13 | +2.1% | Managed float |
| 8 | European Union | Euro | EUR | ≈ $1.05 | −1.2% | Free float |
| 9 | Singapore | Singapore Dollar | SGD | ≈ $0.75 | +1.4% | NEER-managed |
| 10 | United States | US Dollar | USD | $1.00 | Benchmark | Free float |
Exchange rates are indicative mid-market values, early March 2026. Sources: Central Bank of Kuwait, Central Bank of Bahrain, Central Bank of Oman, Bloomberg, Reuters.
#10 — United States: The Dollar That Rules the World (Even When It Isn’t the Strongest)
USD/USD: 1.00 | Reserve share: ~56% of global FX reserves (IMF COFER, mid-2025)
It would be intellectually dishonest to construct any list of monetarily significant currencies without beginning — or in this case, ending — with the US dollar. Technically ranked tenth by nominal exchange rate, the dollar’s omission from any strong-currency discussion would be absurd. It is the global reserve currency, the denomination of roughly 90% of all international foreign-exchange transactions, and the standard against which every other currency on this list is measured.
The dollar’s structural power derives not from its face value but from the depth and liquidity of US capital markets, the legal enforceability of US-dollar-denominated contracts, and the unrivalled network effects that come from decades of institutional entrenchment. When the world is frightened — by a banking crisis, a pandemic, or a geopolitical rupture — capital flows into dollars, not away from them. That is the ultimate credential.
The Federal Reserve’s aggressive rate-hiking cycle of 2022–2023 temporarily turbocharged the greenback to multi-decade highs. Since then, a gradual easing cycle has modestly softened the dollar index (DXY), which hovered around the mid-100s range in early 2026. Yet its dominance in global trade invoicing and central bank reserves remains essentially unchallenged.
Travel angle: For American travellers abroad, the dollar’s reserve status means widespread acceptance and generally favourable conversion, particularly in emerging markets. The caveat: in the Gulf states above the dollar on this list, the local currencies are pegged to the dollar, so there is no exchange-rate advantage — the mathematics are already baked in.
#9 — Singapore: The Asian Precision Instrument
SGD/USD: ≈ 0.75 | Inflation: ~2.1% (MAS, 2025) | Current account: strong surplus
Singapore manages its currency with the kind of institutional exactitude one might expect from a city-state that has spent sixty years treating good governance as a competitive export. The Monetary Authority of Singapore (MAS) does not set interest rates in the conventional sense; it manages the Singapore dollar’s value against an undisclosed basket of currencies through a “nominal effective exchange rate” (NEER) policy band — a mechanism that gives it enormous flexibility to use currency appreciation as an anti-inflation tool.
The result is a currency that, while not high in nominal USD terms, has consistently outperformed peers in Asia on purchasing-power stability. Singapore’s AAA sovereign credit rating (Standard & Poor’s, Fitch), perennially current-account surplus, and status as Asia’s pre-eminent financial hub all feed into the SGD’s credibility premium. The SGD appreciated modestly against the dollar in 2025 as MAS maintained a slightly appreciating NEER slope — a deliberate policy response to residual imported inflation from elevated global commodity prices.
For investors, the Singapore dollar is one of very few Asian currencies worth holding as a diversification tool in a hard-currency portfolio. For travellers from weaker-currency nations, Singapore’s cost of living will feel punishing — this is, after all, consistently one of the world’s most expensive cities. But that high cost is the precise reflection of the currency’s strength.
#8 — The Euro: Collective Strength, Individual Tensions
EUR/USD: ≈ 1.05 | ECB deposit rate: 2.25% (as of Feb 2026) | Eurozone GDP growth: ~0.9% (IMF 2026 forecast)
The euro is the world’s second most traded currency and the reserve currency of choice after the dollar, held in roughly 20% of global central bank foreign exchange portfolios. It represents the collective monetary credibility of twenty nations — a fact that is simultaneously its greatest source of strength and its most persistent structural vulnerability.
The European Central Bank’s prolonged rate-hiking campaign of 2022–2024 was executed with more determination than many in financial markets expected, and it produced results: eurozone core inflation fell from its 2022 peak of above 5% to below 2% by mid-2025, a trajectory that restored considerable credibility to the ECB’s inflation-targeting framework. The subsequent easing cycle has been cautious; the deposit rate stood at approximately 2.25% in early 2026, a level the ECB’s governing council has characterised as still moderately restrictive.
The euro’s Achilles heel remains the fiscal divergence between its member states. Germany’s near-recessionary growth in 2024–2025, combined with France’s persistent budget deficit challenges and Italy’s elevated debt-to-GDP ratio (above 135%), keeps sovereign risk premia alive in bond markets and periodically unsettles the currency. Still, the Eurozone’s aggregate current-account position is in surplus, and the ECB’s “Transmission Protection Instrument” — its bond-buying backstop — has effectively capped the threat of another existential sovereign debt crisis for now.
Travel angle: For USD- or GBP-holders, the euro’s current rate around $1.05 represents a relatively modest barrier. Western European travel remains expensive not because of the exchange rate but because of local price levels — a function of high wages and robust social provision rather than currency manipulation.
#7 — Switzerland: The Safe-Haven That Earned Its Reputation
CHF/USD: ≈ 1.13 | SNB policy rate: 0.25% | Inflation: ~0.3% (SNB, Feb 2026) | Current account surplus: ~9% of GDP
If the Kuwaiti dinar wins on headline exchange rate, the Swiss franc wins on something arguably more impressive: institutional longevity. Switzerland has managed its monetary affairs with such consistent discipline that the franc has preserved real purchasing power across multiple global crises, two world wars (in which Switzerland remained neutral), the collapse of the Bretton Woods system, the 2008 global financial crisis, and the COVID-19 shock. That record of monetary continuity, spanning more than 175 years since the franc’s introduction in 1850, is essentially without parallel among modern fiat currencies.
The Swiss National Bank (SNB) operates with an independence and a long-termism that remains the envy of its peers. Its mandate — price stability, defined as annual CPI inflation of 0–2% — has been met with remarkable consistency. Swiss inflation in early 2026 stood at approximately 0.3%, one of the lowest in the developed world, and a reflection of the SNB’s willingness in previous years to tolerate the economic pain of a strong franc (which reduces import costs and anchors domestic prices) rather than engineer currency weakness for short-term competitiveness.
Switzerland’s current-account surplus, running at roughly 9% of GDP, reflects a country that consistently exports more value than it imports — in pharmaceuticals, precision machinery, financial services, and, of course, the world’s most trusted watches. That structural external surplus is a bedrock of franc credibility.
The SNB’s policy rate stood at 0.25% in early 2026 — low, because very low inflation means there is no need for restrictive policy. The franc’s strength is not conjured by high interest rates attracting hot capital; it is built on structural surpluses, institutional credibility, and a century and a half of monetary conservatism.
Investor angle: The CHF remains one of the most reliable safe-haven plays in global markets. When geopolitical risk flares — and it has consistently done so across 2024–2026 — capital rotates into the franc. Its appreciation during such episodes is the price of insurance.
#6 — Cayman Islands: Offshore Stronghold, Surprising Currency
KYD/USD: 1.20 (fixed since 1974) | Sector: International financial centre
The Cayman Islands may be small — approximately 65,000 residents across three Caribbean islands — but their currency punches well above its geographic weight. The Cayman Islands dollar has been pegged to the US dollar at a fixed rate of 1.20 since 1974, a peg that has held without interruption for over five decades.
The peg is sustainable because the Cayman Islands economy generates exceptional foreign currency inflows. As one of the world’s leading offshore financial centres, the Cayman Islands hosts thousands of hedge funds, private equity vehicles, structured finance vehicles, and the regional offices of major global banks. This financial infrastructure creates persistent capital inflows that underpin the peg’s credibility without recourse to the kind of oil revenues that sustain Gulf currencies.
The absence of direct taxation — no corporate tax, no income tax, no capital gains tax — also functions as a structural attractor for international capital, further reinforcing demand for the local currency.
For travellers, the Cayman Islands’ combination of strong currency and luxury resort economy makes it one of the Caribbean’s more expensive destinations. But that premium reflects something real: it is, genuinely, one of the most politically stable and financially sophisticated jurisdictions in the Western Hemisphere.
#5 — United Kingdom: History’s Most Enduring Major Currency
GBP/USD: ≈ 1.26 | Bank of England base rate: 4.25% (Feb 2026) | UK GDP growth forecast: 1.3% (IMF 2026)
The pound sterling has a plausible claim to being the world’s oldest currency still in active use. Predating the United States by more than a millennium in its earliest forms, sterling carries the weight of institutional memory — and the scars of historical crises, from the 1976 IMF bailout to Black Wednesday in 1992 to the post-Brexit adjustment of 2016. That the pound has navigated all of this and still trades above $1.25 says something significant about the resilience of UK monetary institutions.
The Bank of England, established in 1694, has been on a cautious easing path since mid-2024, reducing its base rate from the post-pandemic peak of 5.25% to 4.25% by early 2026 as UK inflation — which ran brutally hot in 2022–2023 — returned closer to the 2% target. Core CPI had moderated to approximately 2.7% by early 2026, still slightly elevated but no longer the acute political crisis it was.
The UK’s economic structure — highly service-oriented, with the City of London representing one of the world’s two or three most important financial centres — means sterling’s value has always been intimately connected to confidence in UK financial governance. Post-Brexit trade frictions have not destroyed that confidence, though they have permanently restructured some trade flows and depressed productivity estimates.
Travel angle: Sterling’s strength makes UK residents among the best-positioned travellers in the world, particularly when visiting North Africa, South-East Asia, or Eastern Europe, where exchange rate differentials translate into substantial purchasing power advantages. The pound buys significantly more in emerging markets today than it did five years ago.
#4 — Jordan: Strength Without Oil
JOD/USD: 1.41 (fixed peg) | Inflation: ~2.8% | IMF programme: Extended Fund Facility (ongoing)
Jordan’s presence in the top four is the most intellectually interesting entry on this list, because it is a standing refutation of the narrative that strong currencies require oil. Jordan has no significant hydrocarbon reserves. Its economy depends on phosphate exports, manufacturing, services, remittances from a large diaspora, foreign aid — primarily from the United States, Saudi Arabia, and the EU — and its strategic geopolitical position at the intersection of three continents and several of the region’s most complex political dynamics.
The Jordanian dinar has been pegged to the US dollar at a fixed rate of 0.709 JOD per dollar (implying approximately $1.41 per dinar) since 1995, a commitment the Central Bank of Jordan has maintained through multiple regional crises — the 2003 Iraq war, the 2011 Arab Spring, the Syrian refugee crisis (Jordan hosts one of the world’s largest refugee populations relative to its size), and the ongoing regional tensions of 2024–2025.
The peg’s credibility is purchased at a fiscal cost: Jordan must maintain sufficient foreign exchange reserves to defend it, which constrains domestic monetary flexibility and requires disciplined fiscal policy, often in collaboration with IMF structural adjustment programmes. That discipline — painful as it has periodically been — is precisely what makes the dinar’s high nominal value sustainable.
Investor angle: The JOD peg makes Jordan one of the more predictable currency environments in the Middle East, which partly explains why Amman has attracted meaningful foreign direct investment in logistics, technology, and pharmaceuticals in recent years.
#3 — Oman: The Prudent Gulf State
OMR/USD: 2.60 (fixed peg) | Oil production: ~1 mbpd | Moody’s rating: Ba1
The Omani rial’s fixed exchange rate of 2.6008 USD per rial has been unchanged for decades — a testament to the consistency of Oman’s monetary framework. Like its Gulf neighbours, Oman’s currency strength is anchored in hydrocarbon wealth, but the sultanate has pursued a more earnest diversification agenda than some of its neighbours, with meaningful investment in tourism, logistics, fisheries, and renewable energy under its Vision 2040 framework.
Oman’s fiscal position has improved markedly since the turbulence of the low-oil-price years of 2015–2016, when the country ran significant budget deficits and accumulated external debt. Higher oil prices in the early 2020s rebuilt fiscal buffers, and the government has since pursued subsidy reform and revenue diversification with greater determination than before. Moody’s upgraded Oman’s sovereign credit in 2023, reflecting improving balance-of-payment dynamics.
The Central Bank of Oman manages the currency through a currency board-style arrangement, holding sufficient USD reserves to back every rial in circulation at the fixed rate. This mechanistic commitment is what gives the OMR its enviable nominal stability — and what keeps it permanently ranked as the world’s third most valuable currency by exchange rate.
Travel angle: Oman’s strong currency, combined with its emergence as a luxury-eco-tourism destination, means it is not an especially cheap place to visit. But for holders of stronger currencies like the pound or the Swiss franc, the arithmetic is favourable — and Oman’s landscapes, from the Musandam fjords to the Wahiba Sands, make the cost worthwhile.
#2 — Bahrain: The Gulf’s Financial Hub
BHD/USD: 2.659 (fixed peg since 1980) | Financial sector: ~17% of GDP | Moody’s: B2
Bahrain’s dinar has been fixed to the US dollar at 0.376 BHD per dollar — implying approximately $2.66 per dinar — since 2001, maintaining an unchanged peg for a quarter century. That consistency, in a region not historically associated with monetary conservatism, is itself a form of credibility.
Bahrain’s economy is more diversified than Kuwait’s: the financial services sector contributes roughly 17% of GDP, making Manama one of the Gulf’s two dominant financial centres alongside Dubai. The country also has a more developed manufacturing base, including aluminium smelting, and has positioned itself as a regional hub for Islamic finance. This economic diversification is strategically significant because Bahrain has proportionally lower oil reserves than Kuwait or Saudi Arabia — the financial sector was, to some extent, a deliberate hedge against that exposure.
The BHD’s nominal strength is reinforced by Saudi Arabia’s implicit backstop role: the two countries share a causeway, a deep economic relationship, and a security alliance. Saudi Arabia’s vast financial resources have historically been seen as an informal guarantor of Bahraini monetary stability — a factor markets price into the risk premium attached to the dinar’s peg.
Investment angle: Bahrain’s status as a relatively open economy with few capital controls makes the BHD more accessible to international investors than most Gulf currencies. Its fintech regulatory sandbox and digital banking framework have drawn growing interest from global financial institutions in 2024–2025.
#1 — Kuwait: The Uncontested Crown
KWD/USD: ≈ 3.27 | Oil reserves: world’s 6th largest | Inflation: ~2.1% | FX reserves: > $45bn (CBK)
The Kuwaiti dinar is, by the most direct measure available — how many US dollars it takes to buy one unit — the strongest currency in the world. One dinar buys approximately $3.27 at current exchange rates, a premium that has been maintained, with only modest fluctuation, for decades.
Kuwait’s monetary position begins with geology. The country sits atop the world’s sixth-largest proven oil reserves, estimated at approximately 101 billion barrels — a figure that, relative to the country’s population of around 4.3 million citizens (and a total population of roughly 4.7 million including expatriates), represents extraordinary per-capita resource wealth. Oil and petroleum products account for more than 85% of government revenue and over 90% of export earnings. When oil prices are elevated — as they broadly have been across 2022–2025 — the fiscal arithmetic is essentially self-reinforcing.
The Central Bank of Kuwait manages the dinar through a managed peg to an undisclosed basket of international currencies, with the US dollar believed to constitute the largest single weight, given Kuwait’s oil revenues are denominated in dollars. This basket arrangement gives the CBK marginally more flexibility than a simple USD peg — it insulates the dinar slightly from bilateral dollar volatility.
Kuwait’s sovereign wealth fund, the Kuwait Investment Authority (KIA), is among the oldest and largest in the world, with assets variously estimated at over $900 billion. This vast stock of externally held financial wealth provides an additional buffer for the currency — in extremis, the KIA’s assets could theoretically be liquidated to defend the dinar. In practice, they have never needed to be. The combination of ongoing oil revenues, low domestic inflation (circa 2.1%), and conservative fiscal management has kept the dinar stable in nominal terms for as long as most investors can remember.
It is worth acknowledging the critique: Kuwait’s currency strength reflects resource rents and fiscal subsidies rather than diversified economic productivity. The dinar has not been “stress-tested” in the way the Swiss franc has, across multiple non-commodity-linked monetary regimes. A world permanently transitioning away from fossil fuels would eventually restructure the fiscal basis of KWD strength. But “eventually” is doing considerable work in that sentence. In March 2026, with global oil demand still running at near-record levels and the energy transition proceeding more slowly than many modelled, the Kuwaiti dinar remains — unchallenged — the most valuable currency on the planet by exchange rate.
Travel angle: For visitors holding stronger currencies (GBP, CHF, EUR), Kuwait is a genuinely affordable destination for what it offers — a sophisticated urban environment, world-class dining, and proximity to the rest of the Gulf. For those arriving with weaker currencies, the dinar’s strength can feel formidable at the exchange counter.
The Big Picture: What Strong Currencies Mean for Travel and Investment in 2026
The Travel Equation
Currency strength creates a purchasing-power asymmetry that sophisticated travellers have long exploited. Holding a strong currency — Kuwaiti dinar, British pound, Swiss franc, or euro — means that destinations with weaker currencies effectively go “on sale” from the holder’s perspective.
In 2026, the most compelling value gaps are between strong-currency nations and emerging markets where inflation has eroded local purchasing power without triggering proportionate currency depreciation. South-East Asia (Thailand, Vietnam, Indonesia), parts of Central and Eastern Europe, and much of Sub-Saharan Africa offer exceptional experiential value for travellers from the currencies on this list.
For travellers from weaker-currency nations visiting strong-currency countries — the United Kingdom, Switzerland, or the Gulf states — the inverse applies. The exchange rate headwind is real and material. Budget accordingly.
The Investment Case
Strong currencies are not automatically superior investment vehicles. A currency that is strong because it is pegged to the dollar (BHD, OMR, JOD, KYD) offers exchange-rate stability but does not offer upside appreciation. The Swiss franc and Singapore dollar — both managed floats — have historically appreciated in real terms over time, making them genuine long-term stores of value.
The broader investment signal from strong-currency nations is less about the currency itself and more about the policy environment it implies: low inflation, institutional independence, disciplined fiscal management, and rule of law. These are also the conditions most conducive to long-term capital preservation and, frequently, to strong equity market performance.
The Geopolitical Dimension
Several currencies on this list are exposed to geopolitical tail risks that their stable exchange rates do not fully price. Gulf currencies depend on continued hydrocarbon demand and regional stability. The pound is permanently sensitive to UK fiscal credibility and any resurgence of concerns about debt sustainability. The euro faces structural tensions that have been managed but not resolved.
The Swiss franc and Singapore dollar stand apart: their strength is built on institutional foundations that are largely independent of any single commodity price, political decision, or regional dynamic. In a world of elevated geopolitical uncertainty, that institutional bedrock commands a premium that is likely to persist.
Conclusion: Currency Strength as a Mirror of National Character
The currencies at the top of this ranking are not accidents. The Kuwaiti dinar is strong because Kuwait made conservative choices about how to manage extraordinary resource wealth — choices that not every resource-rich nation has made. The Swiss franc is strong because Switzerland has maintained institutional discipline across a century and three-quarters of monetary history. The pound retains its position because British financial markets have earned global trust over decades, even while political decisions have periodically tested it.
For travellers, the lesson is straightforward: when your home currency is strong, the world effectively gives you a discount on its experiences. For investors, the lesson is more nuanced: strength by nominal exchange rate and strength by structural monetary credibility are not the same thing — and in the long run, the latter matters more.
In 2026, the world’s currency hierarchy reflects, as it always has, the aggregate of every monetary policy decision, every fiscal choice, and every institutional investment that preceded it. The dinar, the franc, the pound, the rial — each is a ledger of its nation’s choices, settled daily on the world’s foreign exchange markets.
Frequently Asked Questions (FAQ Schema)
Q1: What is the strongest currency in the world in 2026?
The Kuwaiti Dinar (KWD) is the strongest currency in the world in 2026 by nominal exchange rate, trading at approximately $3.27 per dinar as of early March 2026. Its strength is underpinned by Kuwait’s vast oil reserves, conservative central bank management, and a managed basket peg that maintains extraordinary stability.
Q2: Which country has the strongest currency for travel in 2026?
For travellers, holding UK Pounds Sterling (GBP), Swiss Francs (CHF), or Euros (EUR) provides the most practical travel purchasing power advantage globally, as these currencies are widely accepted worldwide and deliver significant exchange-rate advantages in emerging markets across Asia, Africa, and Eastern Europe.
Q3: Why is the Kuwaiti Dinar so strong?
The Kuwaiti Dinar’s strength derives from Kuwait’s position as one of the world’s largest per-capita oil exporters, responsible fiscal management by the Central Bank of Kuwait, a managed currency peg to a basket of international currencies, low domestic inflation, and the backing of the Kuwait Investment Authority — one of the world’s largest sovereign wealth funds, with assets estimated at over $900 billion.
Q4: Is a strong currency good for a country’s economy?
A strong currency has both benefits and costs. Benefits include lower import costs (reducing inflation), greater purchasing power for citizens abroad, and stronger investor confidence. Costs include reduced export competitiveness, as locally produced goods become more expensive for foreign buyers, and potential pressure on manufacturing sectors. Countries like Switzerland and Singapore manage this tension deliberately through monetary policy.
Q5: What are the best currencies to hold as an investment in 2026?
For capital preservation, the Swiss Franc (CHF) and Singapore Dollar (SGD) have the strongest track records of long-term purchasing-power preservation among free-floating or managed-float currencies. For nominal stability, USD-pegged Gulf currencies (KWD, BHD, OMR) offer predictable exchange rates but limited upside appreciation. The US Dollar retains unparalleled liquidity and reserve-currency status. Diversification across multiple hard currencies remains the consensus recommendation from institutional investors.
Sources : Data sourced from Central Bank of Kuwait, Central Bank of Bahrain, Central Bank of Oman, Monetary Authority of Singapore, Swiss National Bank, Bank of England, European Central Bank, IMF World Economic Outlook (Oct 2025 / Jan 2026 update), World Bank International Comparison Programme, BIS Triennial Survey, Bloomberg FX data, and Reuters market data. Exchange rates are indicative mid-market values as of early March 2026 and are subject to market fluctuation.
Discover more from The Economy
Subscribe to get the latest posts sent to your email.
Analysis
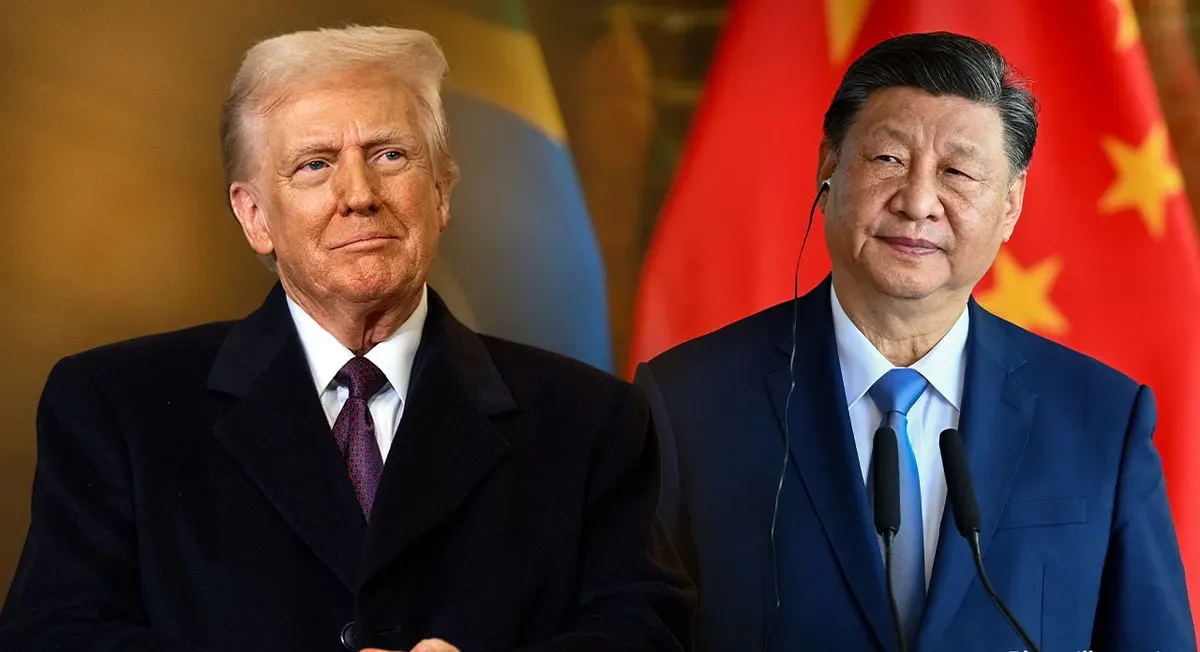
China Plays the Long Game: What Beijing’s Measured Response to Trump’s New Tariffs Means for US-China Trade Talks 2026
As a Supreme Court ruling strips Washington of its most powerful tariff weapon, Beijing signals strategic patience ahead of a high-stakes presidential summit — and the world’s markets are watching.
China vows to decide on US tariff countermeasures “in due course” while welcoming the sixth round of US-China trade consultations. Here’s what the Supreme Court ruling, Trump’s China visit, and Beijing’s record trade surplus mean for global markets in 2026.
There is an old Chinese proverb that patience is power. In the escalating theater of US-China trade tensions, Beijing appears to have taken that maxim as official policy. On Tuesday, China’s Ministry of Commerce signaled it would respond to President Donald Trump’s newly announced 15% blanket tariff on all US imports — not with an immediate salvo, but with carefully calibrated restraint, pledging to decide on countermeasures “in due course.” That phrase, deceptively simple, conceals a sophisticated geopolitical calculation made infinitely more complex by a landmark US Supreme Court ruling that has fundamentally altered the architecture of the trade war.
Welcome to the newest chapter of US-China trade talks 2026 — and it may be the most consequential one yet.
The Supreme Court Ruling That Changed Everything
To understand Beijing’s composure, you first have to understand what happened in Washington last Friday. The US Supreme Court struck down tariffs imposed under the International Emergency Economic Powers Act (IEEPA), the legal scaffolding Trump had used to levy sweeping duties on Chinese goods. Those tariffs had subjected Chinese imports to an additional 20% charge. With that authority now invalidated, Trump announced a substitute measure: a 15% temporary tariff on imports from all countries, a blunter instrument that legal scholars and trade analysts immediately flagged as constitutionally fragile.
For Beijing, the ruling was not merely a legal technicality — it was a strategic windfall. As the Council on Foreign Relations has noted, the Supreme Court’s decision meaningfully constrains the executive branch’s ability to deploy emergency tariff authority unilaterally, weakening the credibility of future tariff threats and handing China’s trade negotiators a structural advantage at the bargaining table. The impact of the Supreme Court ruling on US-China tariffs in 2026 cannot be overstated: Washington’s tariff weapon has been legally blunted, and Beijing knows it.
China’s commerce ministry official was measured but unmistakably pointed in response. “China has consistently opposed all forms of unilateral tariff measures,” the official said Tuesday, “and urges the US side to cancel unilateral tariffs and refrain from further imposing such tariffs.” Translation: China is not going to blink — and it no longer has to.
China’s Negotiating Position: Stronger Than the Headlines Suggest
Analysts assessing China’s response to new US tariffs in the post-IEEPA era should resist the temptation to read Beijing’s patience as weakness. The data tells a different story.
Despite the full weight of US tariff pressure across 2025, China’s economy grew at 5% in 2025, meeting its official target and confounding forecasters who predicted a more severe slowdown. Yes, US imports from China fell sharply — by approximately 29% over the year — but Chinese exporters demonstrated remarkable adaptability, pivoting aggressively toward Southeast Asia, Japan, and India. The result: a record trade surplus of roughly $1 trillion in the first eleven months of 2025, according to Chinese customs data. That figure is not just an economic statistic; it is a geopolitical statement.
Global supply chain shifts from the US-China trade war have, paradoxically, expanded China’s trade network rather than isolated it. Vietnamese factories now process Chinese intermediate goods before export to the United States. Indian manufacturers source Chinese components at scale. The diversification that Washington hoped would weaken Beijing has instead made Chinese trade flows more resilient and more globally embedded.
Key data points underpinning China’s leverage:
- GDP growth of 5% in 2025 despite sustained US tariff pressure
- US imports from China down 29%, but export diversification to Asia offsets losses
- Record $1 trillion trade surplus in the first 11 months of 2025
- Supreme Court ruling invalidating IEEPA tariffs, limiting Trump’s unilateral authority
- Sixth round of US-China economic and trade consultations on the near-term horizon
The Sixth Round: “Frank Consultations” in a Charged Atmosphere
The commerce ministry’s announcement that China is willing to hold frank consultations during the upcoming sixth round of US-China economic and trade talks is diplomatically significant. In the lexicon of Chinese official communication, “frank” is a carefully chosen word. It signals both seriousness of purpose and a willingness to engage on difficult issues — without promising concessions.
What should the sixth round US-China trade consultations analysis account for? First, the structural asymmetry created by the Supreme Court ruling means the US arrives at the table with reduced coercive leverage. Second, China’s domestic economic performance insulates Beijing from the urgency that might otherwise force hasty compromise. Third, the approaching Trump-Xi summit creates a diplomatic deadline that cuts both ways: both sides have incentives to show progress, but neither wants to appear to have capitulated.
The Wall Street Journal has reported that Beijing views the court ruling as an opening — a chance to reframe negotiations on more equitable terms rather than under the shadow of maximalist tariff threats. That reframing will likely define the sixth round’s tone.
Trump’s China Visit: Summit Diplomacy Under a New Tariff Reality
Perhaps the most dramatic element of this unfolding story is the announcement that President Trump is scheduled to visit China from March 31 to April 2 for direct talks with President Xi Jinping. The economic implications of the Trump-Xi summit in April 2026 are substantial, and they extend well beyond bilateral trade.
Markets have already taken note — and not optimistically. US stocks stumbled following Trump’s 15% tariff announcement, with investors recalibrating expectations for a near-term trade resolution. The prospect of a presidential summit offers hope for de-escalation, but the diplomatic road between now and April is strewn with obstacles.
Taiwan remains a structural irritant in any trade discussion. Beijing has consistently insisted that its “one China” position is non-negotiable, and any US moves on Taiwan arms sales or official contacts risk derailing economic negotiations entirely. Meanwhile, Trump’s domestic political constituency demands visible toughness on China — a constraint that limits his negotiating flexibility even as the courts limit his tariff authority.
As CNBC has observed, China’s leverage before this high-stakes summit has materially increased since the Supreme Court’s ruling. The question is whether Trump can construct a face-saving framework that satisfies his base while offering Beijing enough substantive concessions to justify Xi Jinping’s engagement.
What Does China’s Stance Mean for Global Markets?
For investors and policymakers monitoring the situation, China’s “in due course” posture on countermeasures to US tariffs carries a specific signal: Beijing is in no hurry to escalate, because it doesn’t need to. The current trajectory favors strategic patience.
But patience has limits. If the 15% blanket tariff survives legal challenge and takes full effect, China’s commerce ministry has both the rhetorical justification and economic capacity to respond — whether through targeted duties on US agricultural exports, restrictions on rare earth materials critical to American technology supply chains, or regulatory pressure on US companies operating in China.
The global implications are equally consequential. The WTO’s dispute resolution mechanisms, already strained by years of US unilateralism, face further stress as both sides maneuver outside established multilateral frameworks. Emerging economies caught between Washington and Beijing — particularly in Southeast Asia — face mounting pressure to choose sides in a bifurcating trade architecture.
China’s trade surplus amid US tariffs in 2026 also raises uncomfortable questions for the European Union and other trading partners. A flood of Chinese goods diverted from the US market is already generating trade friction in Europe and Asia, creating pressure for their own defensive measures and complicating the global supply chain shifts from the US-China trade war.
Looking Ahead: Three Scenarios for the Summit
Scenario One: Managed De-escalation. The sixth round of talks produces a face-saving framework — a pause on new tariffs, renewed market access commitments from Beijing, and a summit declaration emphasizing “strategic communication.” Markets rally, tensions simmer but stabilize. Probability: moderate, contingent on domestic political constraints on both sides.
Scenario Two: Symbolic Summit, Structural Stalemate. Trump and Xi meet, photos are taken, statements are issued. But the fundamental disagreements over technology decoupling, Taiwan, and trade imbalances remain unresolved. The 15% tariff stays. China holds its countermeasures in reserve. The trade war continues by other means. Probability: high, reflecting the structural depth of the conflict.
Scenario Three: Escalatory Breakdown. Legal challenges to the 15% tariff succeed, Trump seeks new legislative authority, and China responds to a hardened US position with targeted countermeasures on agriculture and rare earths. The summit is postponed or canceled. Global markets reprice risk sharply downward. Probability: lower but non-trivial, especially if Taiwan developments intervene.
The Bottom Line
The phrase “in due course” may sound like bureaucratic evasion, but in the context of US-China trade talks in 2026, it represents a sophisticated strategic posture. China is not reacting — it is calibrating. The Supreme Court’s ruling has handed Beijing a structural advantage at precisely the moment a presidential summit demands careful choreography. China’s economic resilience, its record trade surplus, and its expanding export network have all strengthened its hand.
As the New York Times has noted, Trump arrives at this summit with both an opportunity and a liability: the chance for a landmark diplomatic achievement, burdened by reduced legal leverage and an electorate expecting visible wins. For Xi Jinping, the calculus is simpler — wait, negotiate with clarity, and let Washington’s internal contradictions do some of the work.
In a trade war that has reshaped global supply chains and tested the limits of economic statecraft, Beijing’s patience may prove to be its most effective weapon of all.
Discover more from The Economy
Subscribe to get the latest posts sent to your email.

Explore how Bangladesh’s new PM Tarique Rahman aims to boost GDP growth, manage remittances, and navigate China-US relations amid post-election revival.
When Tarique Rahman finally set foot on Bangladeshi soil after nearly two decades in London exile, the crowds that greeted him weren’t merely celebrating a political homecoming. They were, in a very real sense, betting their livelihoods on him. The BNP’s sweeping two-thirds majority in February 2026 — an election made possible only by the extraordinary student-led uprising that drove Sheikh Hasina from power in 2024 — handed Rahman a mandate that is simultaneously historic and terrifying in its weight. Bangladesh’s GDP stands at roughly $460 billion, growth has decelerated to a sluggish 4%, and a geopolitical tightrope stretches in every direction. The question isn’t whether Rahman wants to revive Bangladesh’s economy. The question is whether the tools he has are equal to the task.
The Economic Inheritance: More Fragile Than It Looks
Bangladesh’s macro story has long been one of development economics’ favorite fairy tales — a low-income country that outpaced neighbors through garment exports, microfinance, and disciplined remittance flows. That story has grown considerably more complicated.
The IMF projects GDP growth to rebound to 4.7% in FY2026, a modest recovery from the post-Hasina political turbulence that rattled investor confidence in late 2024 and through 2025. But 4.7% is not the 6–7% Bangladesh needs to absorb its vast young workforce, reduce poverty meaningfully, or finance the public investment that decades of cronyism left underfunded. The structural gaps are significant: private investment hovers well below the 35% of GDP economists identify as necessary for sustained high growth. Public institutions — tax administration, the judiciary, anti-corruption bodies — carry the scars of 15 years of systematic politicization.
Agriculture still employs roughly 44% of the workforce, a share that underscores both the rural depth of economic vulnerability and the limits of an export-led model that has concentrated prosperity in Dhaka and Chittagong. When a cyclone hits the Sundarbans or global cotton prices spike, nearly half the country feels it in their bones.
Then there’s the remittance lifeline. Bangladeshis abroad sent home $30 billion in 2025 — a remarkable surge driven partly by the depreciation of the taka making dollar transfers more attractive, and partly by the expanded diaspora built up across the Gulf, Malaysia, and Europe. Remittances now rival garment export earnings as the backbone of foreign exchange reserves. That’s a double-edged asset: invaluable as a buffer, but structurally fragile because it depends on labor-market conditions in Riyadh and Dubai, not Dhaka.
The Garment Sector: A Crown Jewel Under Pressure
Bangladesh’s readymade garment industry — a $40+ billion export engine that dresses much of the Western world — faces its most complex moment in a generation. The challenges are formidable: automation threatens lower-skill sewing jobs, Western buyers are demanding ESG compliance that many Bangladeshi factories can’t yet afford, and competitors from Vietnam and Ethiopia are chipping away at market share.
US tariff policy adds another layer of uncertainty. Bangladesh’s garment exports to America — its single largest market — flow under preferences that have never been fully secure and are now subject to the broader unpredictability of Washington’s trade posture. Rahman’s government has signaled it will pursue a formal trade framework with the US, a pragmatic move that would reduce vulnerability but requires diplomatic capital Bangladesh is only beginning to rebuild.
The harder domestic challenge is labor. The 2024 revolution was partly ignited by garment workers and students united by economic grievance. Any BNP government that ignores wage stagnation in the sector risks repeating the political miscalculations that ultimately doomed Hasina. Rahman has spoken of a “social compact” with workers — the test will be whether that translates into enforceable minimum wages and functional unions, or remains campaign rhetoric.
Navigating the Great Power Triangle: China, the US, and India
China: Partner, Creditor, or Competitor?
Bangladesh’s trade relationship with China is the defining economic relationship most Western analysts underestimate. Bilateral trade runs at approximately $18 billion, overwhelmingly weighted toward Chinese exports — machinery, raw materials, electronics — that Bangladesh’s industry desperately needs but can’t yet produce domestically. Chinese firms have also financed key infrastructure, from the Padma Bridge rail link to power plants, creating debt obligations that constrain fiscal flexibility.
Rahman’s stated approach is “multipolar pragmatism” — maintaining strong economic ties with Beijing while signaling openness to Washington and Tokyo. It’s a reasonable strategy, and it reflects a broader trend across Southeast and South Asia. But it requires a diplomatic dexterity that Bangladesh’s foreign ministry has not traditionally needed to exercise. The risk is that both great powers interpret hedging as hostility rather than prudence.
The India Question: Thaw or Freeze?
Relations with India are the most emotionally charged variable in Rahman’s foreign policy inbox. New Delhi was perceived as Hasina’s patron — a relationship Bangladeshi nationalists resented and the BNP stoked for electoral advantage. Border tensions have flared since the revolution, with incidents along the fencing that runs most of the 4,000-kilometer frontier. The Teesta water-sharing agreement, long in diplomatic limbo, remains unsigned.
And yet the economics of India-Bangladesh interdependence are powerful enough to compel engagement regardless of political temperature. Indian goods flood Bangladeshi markets via both formal and informal channels. Bangladesh’s northeast-facing connectivity — ports, power grids, transit routes — cannot be optimized without Indian cooperation. A sustained chill with Delhi would cost Rahman more than it costs Modi. The smart money is on a gradual, face-saving thaw: enough symbolism to satisfy nationalist sentiment at home, enough pragmatism to keep the border economy functioning.
ASEAN: The Aspiration That Requires Homework
Bangladesh’s ASEAN aspirations have been discussed for years with more enthusiasm than strategy. Joining ASEAN — even as a dialogue partner — would require institutional reforms, trade liberalization, and a regional diplomatic posture that Dhaka has not historically prioritized. Rahman’s team has floated ASEAN engagement as part of a broader Indo-Pacific pivot. It’s an appealing vision. Translating it into policy requires, first, getting the basics right at home.
The Political Economy of Reform: Who’s Really in the Room?
Any honest assessment of Bangladesh’s economic outlook has to grapple with the coalition Rahman is governing within. The BNP’s two-thirds majority is a powerful instrument — but it came partly on the back of Jamaat-e-Islami’s organizational muscle in constituencies where the BNP had been weakened during the Hasina years. Jamaat’s social conservatism and ambiguous attitude toward Bangladesh’s secular liberal elite creates real tension with the reform agenda that investors and multilaterals are expecting.
Youth are the other critical constituency. The students who brought down Hasina want jobs — real ones, not patronage positions — transparency, and an end to the culture of political violence that has made Bangladeshi politics so costly to its own institutions. Rahman’s government has promised a crackdown on corruption and civil service reform. These are not merely good governance talking points; they are the precondition for private investment to grow toward that 35% of GDP target. Foreign capital follows institutional credibility, and Bangladesh’s institutional credibility is currently being rebuilt from a low base.
The Awami League, despite its electoral collapse, commands deep roots in parts of the bureaucracy, the military officer class, and civil society. A wise BNP government manages this not through purges — which historically backfire — but through transparent accountability processes that don’t look like victors’ justice.
LDC Graduation: The November 2026 Cliff
Looming over everything is Bangladesh’s scheduled graduation from Least Developed Country status in November 2026. This is, in development terms, a success story — Bangladesh has met the income, human assets, and economic vulnerability thresholds for graduation. But success brings a cost: the erosion of preferential trade terms that have underpinned garment export competitiveness for decades.
Duty-free access to the EU under the Everything But Arms initiative will phase out. WTO-TRIPS flexibilities on pharmaceuticals will tighten. The IMF and World Bank have urged Bangladesh to negotiate transition arrangements and diversify its export base before the preferences expire. Rahman’s government has approximately two years of post-graduation transition runway — time that must be used to move up the value chain, attract technology-intensive investment, and build the trade infrastructure that makes Bangladeshi exports competitive on merit rather than preference.
This is where the $460 billion economy’s future is genuinely being written. Not in political speeches, but in whether Chittagong port gets the upgrades it needs, whether the power grid can reliably supply the industrial zones, and whether the education system starts producing graduates with skills the 21st-century economy demands rather than the 20th.
Opportunities and Pitfalls: A Forward Look
Where the optimists have a point:
- The remittance surge provides a genuine foreign exchange cushion that buys reform time.
- Bangladesh’s demographic dividend — a young, urbanizing population — is a real asset if youth employment programs gain traction.
- The global supply chain diversification away from China creates an opening for Bangladesh in electronics and light manufacturing if the enabling environment improves.
- The BNP’s large majority, paradoxically, gives Rahman room to absorb short-term political pain from reform — a luxury narrow coalition governments rarely have.
Where the pessimists may be right:
- Jamaat-e-Islami’s influence in the coalition could slow liberal economic reforms and deter Western investors with ESG mandates.
- India-Bangladesh tensions, if they deepen, could disrupt the connectivity projects that unlock northeastern Bangladesh’s economic potential.
- LDC graduation without adequate preparation could trigger a garment sector shock that reverberates across the 4 million workers — mostly women — who depend on it.
- Institutional rebuilding takes longer than election cycles. The IMF’s 4.7% projection is predicated on policy continuity and reform progress that is far from guaranteed.
The Bottom Line
Tarique Rahman inherits a Bangladesh that is more resilient than its critics acknowledge and more fragile than its boosters admit. The $460 billion economy has real foundations — a hardworking diaspora, an adaptable garment sector, a tradition of pragmatic policymaking that survived even the Hasina years’ worst excesses. But those foundations need serious maintenance: institutional reform, investment in human capital, and a foreign policy sophisticated enough to manage great power competition without becoming a casualty of it.
The students who made this government possible are watching with the same energy they brought to the streets in 2024. They are not an audience to be managed with press releases. They are Bangladesh’s most important economic asset — and its most demanding constituency. Getting the economy right, for Rahman, is not just a technocratic challenge. It’s the condition of his political survival, and the measure by which history will judge whether the 2024 revolution delivered on its promise.
Discover more from The Economy
Subscribe to get the latest posts sent to your email.
-

 Markets & Finance2 months ago
Top 15 Stocks for Investment in 2026 in PSX: Your Complete Guide to Pakistan’s Best Investment Opportunities
-

 Analysis4 weeks ago
Brazil’s Rare Earth Race: US, EU, and China Compete for Critical Minerals as Tensions Rise
-

 Investment2 months ago
Top 10 Mutual Fund Managers in Pakistan for Investment in 2026: A Comprehensive Guide for Optimal Returns
-

 Banks2 months ago
Best Investments in Pakistan 2026: Top 10 Low-Price Shares and Long-Term Picks for the PSX
-

 Asia2 months ago
China’s 50% Domestic Equipment Rule: The Semiconductor Mandate Reshaping Global Tech
-

 Global Economy2 months ago
Pakistan’s Export Goldmine: 10 Game-Changing Markets Where Pakistani Businesses Are Winning Big in 2025
-

 Global Economy2 months ago
What the U.S. Attack on Venezuela Could Mean for Oil and Canadian Crude Exports: The Economic Impact
-

 Global Economy2 months ago
15 Most Lucrative Sectors for Investment in Pakistan: A 2025 Data-Driven Analysis