
Analysis
Russia May Halt Gas Supplies to Europe: Putin’s Iran Gambit and the New Energy Order
The Kremlin’s signal that it could voluntarily exit the European gas market is part bluff, part genuine pivot — and entirely consequential for global energy security in 2026 and beyond.
Russia may halt gas supplies to Europe as Putin exploits the Iran energy spike. Analysing the real stakes behind the Kremlin’s threat, TTF price surge, and Moscow’s Asian pivot.
Introduction: A Threat Dressed as a Business Decision
On the morning of March 4, 2026, Russian President Vladimir Putin sat down with Kremlin television correspondent Pavel Zarubin and appeared to do something unusual for a man whose public statements are rarely accidental: he thought out loud. Against the backdrop of global energy markets in full-blown crisis — triggered by the U.S.-Israeli military campaign against Iran and Tehran’s counter-strikes across the Gulf — Putin mused that Russia might halt gas supplies to Europe entirely, and do so immediately, rather than wait to be formally ejected under the European Union’s own phase-out timeline.
“Now other markets are opening up,” Putin said, according to the Kremlin transcript. “And perhaps it would be more profitable for us to stop supplying the European market right now. To move into those markets that are opening up and establish ourselves there.”
He was careful, almost lawyerly, in his framing. “This is not a decision,” he added. “It is, in this case, what is called thinking out loud. I will definitely instruct the government to work on this issue together with our companies.” But in the language of energy geopolitics, where a single presidential signal can move commodity markets by double digits, the distinction between thinking out loud and making policy is narrower than it appears. What Putin said on March 4 was not a bluff — or at least, not entirely one. It was a calculated reflection of a structural shift already underway, supercharged by a Middle East crisis that has remade the arithmetic of global gas markets in just seventy-two hours.
To understand what this means, you have to understand where Europe stands today — and where Russia has been heading for the past three years.
Background: A Market Already Departing Itself
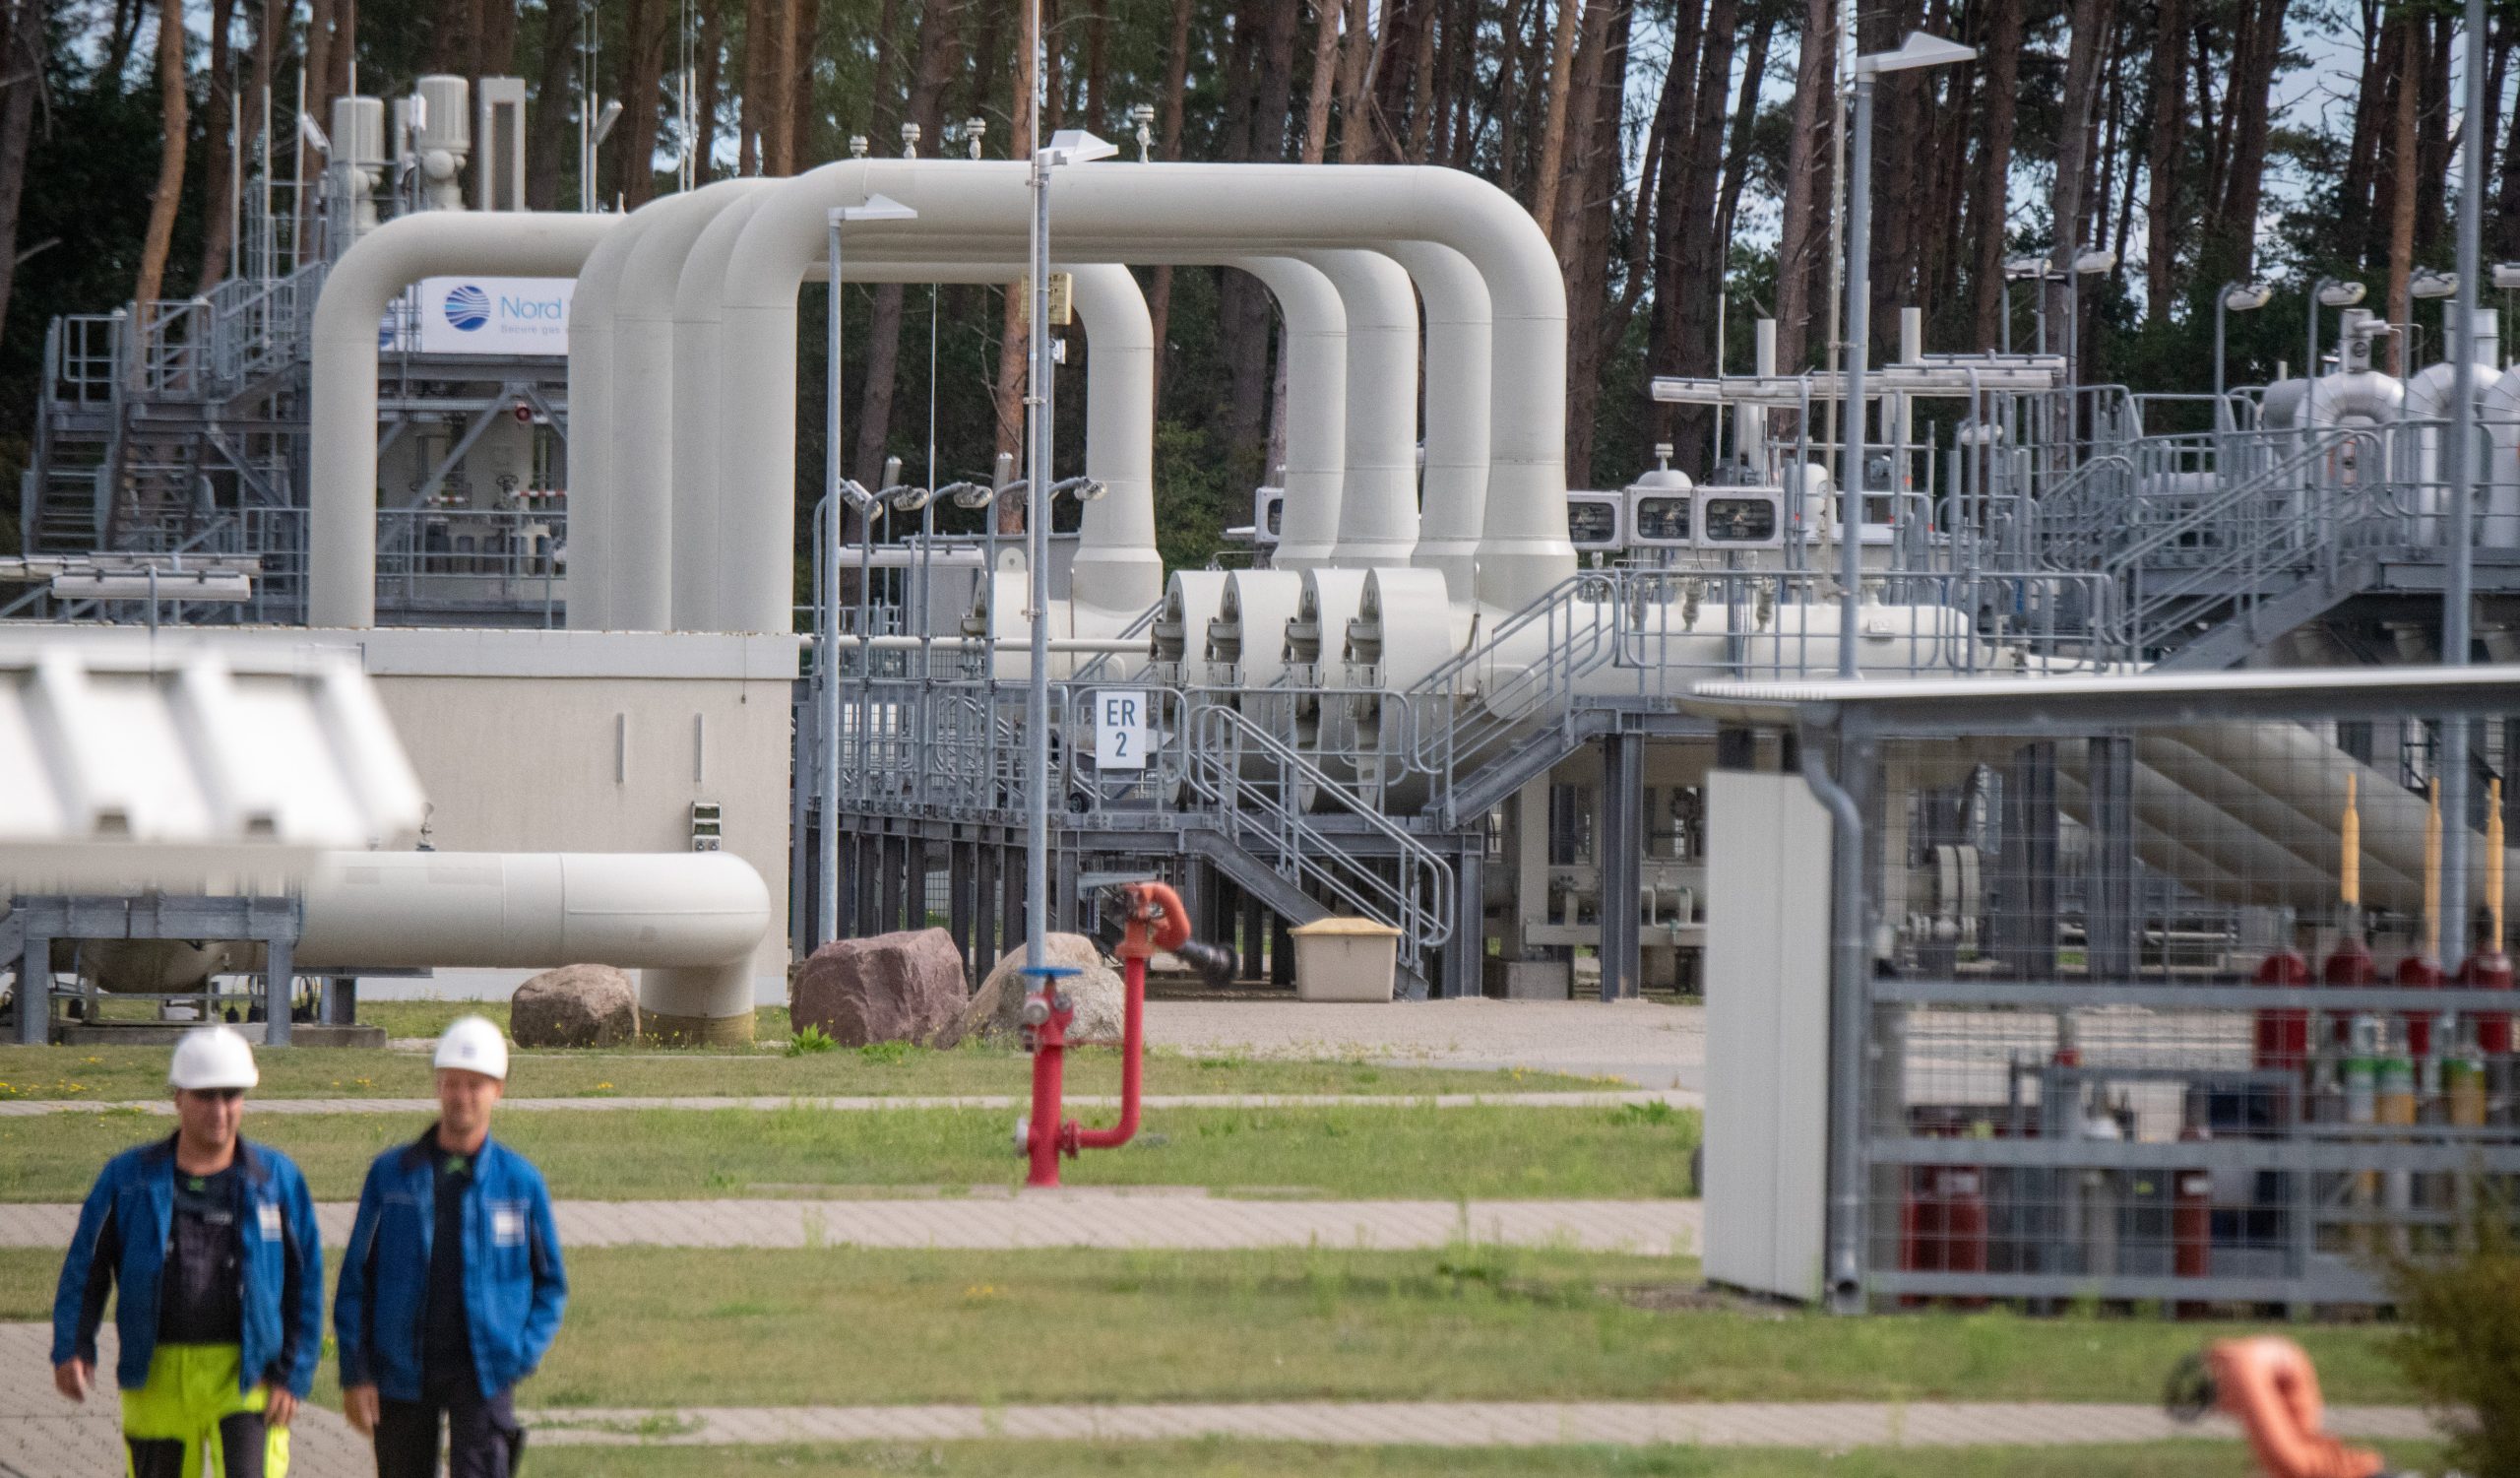
The story of Russia’s decline as Europe’s dominant gas supplier is one of the most dramatic commercial collapses in modern energy history. Before February 2022, Russia supplied approximately 40% of the EU’s pipeline gas, making Gazprom — then valued at over $330 billion — the third-largest company in the world. By early 2026, that figure had fallen to just 6%, and Gazprom’s market capitalisation had cratered to roughly $40 billion, a destruction of value that no Western sanctions regime alone could have engineered without Moscow’s own strategic miscalculations.
Europe’s REPowerEU programme — launched in the immediate aftermath of the Ukraine invasion — has proven surprisingly effective. Norway, the United States, and Algeria have collectively absorbed most of what Russia once provided. LNG import terminals that did not exist three years ago now dot Europe’s Atlantic coastline. The continent’s dependence on pipeline gas from a single adversarial supplier has been structurally dismantled.
What remained of Russia’s European gas footprint was a dwindling rump of legacy contracts, principally serving Hungary and Slovakia — nations whose governments had maintained warmer diplomatic relationships with Moscow. It was a commercially marginal position, but one that gave the Kremlin a residual foothold in Europe’s energy map and, more importantly, a psychological card to play. That card is what Putin attempted to deploy on Wednesday.
The European Commission has approved a binding phase-out schedule that accelerates significantly this spring. The key EU ban milestones are: April 25, 2026, for short-term Russian LNG contracts; June 17, 2026, for short-term pipeline gas; January 1, 2027, for long-term LNG contracts; and September 30, 2027, for long-term pipeline contracts. Putin’s suggestion — that Russia should exit now rather than wait to be shown the door — is, on one level, a face-saving exercise. But on another, it is a genuine strategic calculation being shaped by events thousands of kilometres away, in the Persian Gulf.
The Iran Crisis: How a Middle East War Changed European Gas Arithmetic Overnight
The convergence of the Iran crisis with Putin’s remarks is not coincidental. In late February 2026, European gas markets had entered what traders described as a period of “prolonged dormancy.” The Dutch TTF benchmark — Europe’s primary gas pricing index — had drifted to roughly €32 per megawatt hour, the lower half of Goldman Sachs’s estimated coal-to-gas switching range. Norwegian output from the Troll field was at peak efficiency. The energy crisis of 2022 seemed a distant, if instructive, memory.
Then, over the weekend of February 28 to March 1, came the military escalation that markets had not priced in. Iranian strikes on Gulf Arab neighbors, the effective closure of the Strait of Hormuz, and — most critically for gas markets — QatarEnergy’s announcement that it was halting all LNG production after Iranian drone attacks targeted two of its facilities. QatarEnergy accounts for nearly one-fifth of global LNG exports. The impact was immediate and seismic.
By Tuesday, March 3, the TTF had surged more than 60% to a three-year high, peaking intraday at €65.79/MWh. Goldman Sachs — which had entered the week forecasting a €36/MWh April TTF price — raised its April forecast to €55/MWh and warned that a full one-month Strait of Hormuz closure could drive TTF toward €74/MWh, the level that triggered large-scale demand destruction during the 2022 crisis. Brent crude climbed to around $83 a barrel mid-week, some 25% above its pre-strike close.
Chart: European TTF Gas Price vs. Iran Crisis Timeline (February–March 2026) TTF at ~€32/MWh (Feb 28) → €46.41/MWh (Mar 2, Hormuz closure) → €65.79/MWh intraday peak (Mar 3, Qatar halt) → ~€60/MWh (Mar 4, Putin statement). Goldman Sachs scenario range: €74–€90/MWh if disruption extends beyond 30 days. 2022 crisis peak for reference: €345/MWh (August 2022). Source: ICE TTF, Goldman Sachs Commodity Research, ICIS.
The scale of Europe’s structural vulnerability was made even more vivid by the storage data. EU gas storage entered March 2026 at approximately 46 billion cubic metres — compared to 60 bcm in 2025 and 77 bcm in 2024. Facility fill rates were sitting at around 30% of capacity, with Germany at roughly 21.6% and France in the low-20s. Oxford Economics warned that European storage was now on track to fall below 20% by the end of the summer refill season, making the EU’s mandated 80% target for December virtually unreachable without a rapid restoration of Qatari output and Hormuz shipping lanes.
It was into this environment — with European buyers suddenly desperate for any available molecule and willing to pay premium prices — that Putin delivered his “thinking out loud” signal.
Deep Analysis: What Putin Actually Said, and What It Means
Strip away the diplomatic language and the Kremlin’s careful framing, and Putin’s message on March 4 had three distinct layers.
The first was commercial. With global spot LNG prices surging alongside TTF, the opportunity cost of continuing to sell residual pipeline volumes to a market that has legislated for your exit has genuinely shifted. “Customers have emerged who are willing to buy the same natural gas at higher prices, in this case due to events in the Middle East, the closure of the Strait of Hormuz, and so on,” Putin told Zarubin. “This is natural; there’s nothing here, there’s no political agenda — it is just business.” This is not entirely a confection. The disruption to Qatari and Gulf supply has created a genuine spot-market premium that makes diverting flexible LNG cargoes to Asian buyers financially attractive.
The second layer was geopolitical. Ukraine’s government immediately characterised Putin’s remarks as “Energy Blackmail 2.0”, arguing that Moscow is attempting to exploit the global energy shock to pressure Europe into softening its next round of gas sanctions — specifically the April 25 deadline for banning new short-term Russian LNG contracts. That reading is credible. Putin linked his remarks directly to the EU’s “misguided policies” and singled out Slovakia and Hungary as “reliable partners” who would continue to receive Russian gas — a studied wedge aimed at splitting the bloc along its most familiar fault lines.
The third layer is structural, and it is the one that matters most for the medium term. Russia is not simply threatening to leave Europe’s gas market. It is trying, under conditions of genuine commercial pressure, to accelerate a pivot that is already underway — but that faces serious bottlenecks. Russia’s pipeline gas exports to China via the Power of Siberia 1 line are expected to hit 38–39 bcm in 2025, up from 31 bcm the previous year. A legally binding memorandum to build the 50 bcm Power of Siberia 2 pipeline — running from the Yamal Peninsula through Mongolia to northern China — was signed in September 2025. But key commercial parameters, including price, financing, and construction timeline, remain unresolved. The pipeline could not realistically begin deliveries before 2030.
That gap — between the rhetoric of an Asian pivot and its physical reality — is the central vulnerability in Putin’s position. Russia can talk about redirecting gas to “more promising markets.” It cannot actually do so at scale, quickly, without the infrastructure that does not yet exist.
The Asymmetry of Pain: Who Needs This More?
The critical question any serious analyst must ask is: who is in the weaker negotiating position? And the honest answer is that both sides are weaker than they publicly admit.
Europe is, right now, more exposed than at any point since 2022. Low storage, a Qatari production halt, a constrained Hormuz corridor, and the structural dependency on spot LNG that replaced Russian pipeline gas — all of this has placed the EU in a position where any additional supply disruption narrows the margin between a price shock and a supply crisis. The European Commission told member states on March 4 that it saw no immediate threat to supplies and was not planning emergency measures — technically accurate, but dependent on the Hormuz situation resolving within weeks rather than months. A sustained shutdown beyond thirty days would likely trigger EU emergency coordination mechanisms and, potentially, renewed industrial demand rationing in Germany and Italy.
Russia, meanwhile, is not in a position of strength it can easily monetise. Gazprom’s finances have been devastated by the loss of the European market. The company that was worth $330 billion in 2007 is now a shadow institution, sustained by domestic subsidies and Chinese pipeline flows priced at significant discounts to European rates. Before the war, Russia earned $20–30 billion annually from 150 bcm of gas sales to Europe. Even the completion of Power of Siberia 2 would replace only a fraction of that revenue, at lower unit prices. Nature Communications’ modelling suggests that under even the most optimistic Asian pivot scenario, Russia’s gas exports in 2040 would remain 13–38% below pre-crisis levels.
The Iran crisis is, therefore, a short-term opportunity for Moscow — a window in which spot prices are high enough to make diverting LNG cargoes look commercially rational, and in which Europe’s anxiety is visible enough to potentially extract political concessions. The window may be narrow, but Putin, characteristically, is using it.
Europe’s Alternatives and the Long-Term Structural Outlook
For European policy desks, the Iran crisis and the Putin signal converge into a single, uncomfortable lesson: the substitution of Russian pipeline gas with global LNG has increased Europe’s resilience against one specific geopolitical actor, while simultaneously increasing its exposure to a different category of risk — global market volatility and shipping lane disruption.
The diversification has been real and substantial. Norway remains the most stable and geographically proximate anchor of European supply. U.S. LNG — whose export volumes have grown dramatically since 2022 — provides a flexible, if expensive, buffer. Algeria and Azerbaijan offer incremental pipeline capacity. The EU’s REPowerEU framework — which accelerated renewable deployment alongside supply diversification — has also reduced the bloc’s structural gas demand.
But Bruegel’s analysis is pointed: “Europe’s exposure to geopolitical shocks remains rooted in its continued reliance on imported fossil fuels traded on volatile global markets — even if it has shifted dependency from Russia to other suppliers.” A continent that spent 2022 learning that pipeline dependency is a strategic liability spent 2023–2025 building LNG infrastructure — only to discover in March 2026 that LNG, too, has a geopolitical chokepoint problem. The Strait of Hormuz handles roughly one-fifth of global LNG trade. That is a structural risk that no European Commission regulation can address directly.
The medium-term policy implications are significant. Europe must continue to accelerate domestic renewable capacity at a pace that reduces structural gas demand — not merely substitutes one supplier for another. The ambition to hit 80% renewable electricity by 2030 under the Green Deal framework looks, against this backdrop, less like an environmental aspiration and more like an energy security imperative.
The Russia-China Variable: Beijing Holds the Cards
Perhaps the most consequential long-term dynamic in this story is not Russia’s leverage over Europe, but China’s leverage over Russia. Beijing has watched Moscow’s European collapse with the cool patience of a buyer who knows the seller has nowhere else to go. China’s share of Russia’s gas imports rose from 10% in 2021 to over 25% by 2024, and Power of Siberia 1 is now delivering above its planned annual capacity. But the pricing dynamic tells the real story: China is reportedly seeking gas prices closer to domestic levels around $60 per thousand cubic metres, while Russia has historically priced European contracts at approximately $350. That gap is not merely a commercial negotiating point — it is a measure of Russia’s strategic desperation.
When Putin instructs his government to “work on this issue together with our companies,” the companies in question face a market reality that the Kremlin’s rhetorical confidence does not reflect. The molecules that currently flow to residual European buyers cannot, in the near term, be physically rerouted to Asia without the infrastructure that will not exist for years. In the meantime, Russia’s attempt to leverage the Iran crisis into a position of energy market strength is constrained by its own strategic isolation — and by Beijing’s entirely rational decision to extract maximum commercial advantage from a supplier with limited alternatives.
What This Means for Global Energy Markets in 2026–2027
The Putin signal and the Iran crisis, taken together, define the contours of a global gas market that has entered a structurally more volatile phase. Several dynamics deserve close attention over the next twelve to eighteen months.
The TTF price range is not reverting to pre-crisis levels quickly. Goldman Sachs’s revised Q2 2026 forecast of €45/MWh represents a structural step-up from pre-crisis pricing, even under a relatively benign resolution of the Hormuz situation. The combination of low European storage, disrupted Qatari supply, and elevated geopolitical risk premia will keep European gas prices meaningfully above their late-2025 baseline.
Russia’s European exit is happening on Europe’s terms, not Moscow’s. Putin’s attempt to frame a forced commercial retreat as a voluntary strategic pivot is partly theatre. The EU’s phase-out timeline is legally binding, broadly supported across member states, and operationally advanced. The April 25 ban on new short-term Russian LNG contracts will proceed regardless of Putin’s “thinking out loud.” Hungary and Slovakia may retain some residual pipeline flows under existing long-term contracts, but these are margin cases, not strategic leverage.
The Power of Siberia 2 is not yet a solution. The September 2025 memorandum between Gazprom and CNPC was significant — but it left pricing, financing, and construction timing unresolved. The pipeline cannot realistically deliver first gas before 2030. Russia’s “pivot to Asia,” for the medium term, remains a slogan with better infrastructure than revenues.
The global LNG market is entering a period of structural tightness. The convergence of Qatari disruption, the Hormuz closure, and strong Asian demand growth means that the spot-market flexibility that Europe has relied upon since 2022 will be more expensive and less reliable than buyers had assumed. The ICIS-modelled €90/MWh scenario is not a tail risk — it is a realistic outcome if Hormuz shipping remains constrained through April and May. European industrial competitiveness, already under severe pressure, faces another energy cost headwind.
The real winner may be Washington. Putin himself acknowledged that if premium buyers emerge elsewhere, American LNG exporters “will, of course, leave the European market for higher-paying markets.” This is accurate — but it also reflects a constraint on U.S. flexibility. American LNG export facilities are capacity-constrained and cannot rapidly increase volumes. In the short term, the Iran crisis helps the case for additional U.S. LNG export investment. It also strengthens the hand of American negotiators in any bilateral energy diplomacy with European allies.
The deeper lesson, one that transcends any single news cycle, is that the post-2022 European energy reordering has produced greater supply diversity but not necessarily greater supply security. Swapping a pipeline from Moscow for LNG from a global market that transits through contested choke points is a trade-off, not a solution. Putin’s remarks on March 4 are best read not as a threat, but as a symptom — of Russia’s commercial decline, of Europe’s structural exposure, and of a global gas market in which the old certainties have been permanently dissolved.
The age of cheap, abundant gas flowing reliably through predictable corridors is over. What comes next will be shaped not by any single leader’s calculations, but by the hard physics of where the molecules are, how they move, and who controls the routes between them.
Discover more from The Economy
Subscribe to get the latest posts sent to your email.


The era of the verbose central banker may be nearing its end, if a growing faction of monetary conservatives has its way. For the better part of two decades, the Federal Reserve has operated under a simple, seemingly unassailable premise: more transparency equals less market volatility. The institution transitioned from the cryptic briefcase-watching days of the Alan Greenspan era to a modern regime of dot plots, forward guidance, and post-meeting press conferences that parse every syllable of economic data. Yet, former Federal Reserve governor Kevin Warsh has emerged as the loudest voice calling for a radical reversal. His prescription for the central bank is startling in its simplicity. He wants them to stop explaining everything.
What follows, however, is not a call for renewed secrecy, but a structural critique of how monetary policy transparency has inadvertently cornered the world’s most powerful financial institution. Since the 2008 financial crisis, the volume of central bank communication has exploded. The average length of an FOMC post-meeting statement grew from roughly 130 words in 1999 to over 800 words by the early 2020s, a symptom of an institution desperately trying to script the future. Warsh, currently a visiting fellow at the Hoover Institution, argues that this hyper-communication has transformed the Fed from a reactive stabiliser into an anxious market manager. By pre-committing to future policy paths through extensive forward guidance, the central bank has severely limited its own optionality when macroeconomic conditions inevitably change.
The core of the argument surrounding Kevin Warsh Fed communication reforms rests on the idea that the central bank has become a prisoner of its own forward guidance. In the post-Bernanke era, the Federal Reserve adopted the philosophy that explaining future policy intentions would smooth out market reactions and anchor yield curves. Warsh contends this approach has fundamentally backfired. Instead of calming markets, hyper-transparency has created a brittle financial system highly reactive to minor shifts in the Fed’s linguistic tone.
When the Fed attempts to narrate the economic future, it invites Wall Street to trade the narrative rather than the underlying economic reality. Warsh has repeatedly warned that central banks are not omniscient forecasting agencies. When policymakers issue detailed dot plots projecting interest rates three years into the future, they project a false certainty. If inflation spikes or employment drops unexpectedly, the Fed is forced into a humiliating retreat, damaging its institutional credibility. A report by the Bank for International Settlements recently highlighted that over-reliance on forward guidance during periods of high inflation actually delayed necessary policy tightening, as central banks hesitated to break their own public promises.
By retreating from the microphone, Warsh suggests the Federal Reserve can reclaim its tactical flexibility. If markets are given less explicit guidance, they must revert to doing their own price discovery based on incoming data, rather than waiting to be spoon-fed by Jerome Powell. This forces market participants to price in risk more accurately. The current regime, Warsh argues, acts as a psychological subsidy to financial markets, encouraging risk-taking because traders believe the Fed has broadcast its entire playbook in advance.
To understand the mechanics of this critique, one must examine the specific tools the Fed uses to broadcast its intentions. The most controversial is the Summary of Economic Projections, colloquially known as the dot plot. Introduced in 2012, the dot plot was designed to provide a visual representation of where each FOMC member expects interest rates to be in the coming years. Warsh views the dot plot not as a tool of clarity, but as an engine of confusion that central bank forward guidance relies on too heavily.
What is forward guidance in monetary policy? Forward guidance is a communication tool used by central banks to signal the future path of interest rates to the public and financial markets. By clearly stating their long-term policy intentions, central banks aim to influence current financial conditions, lower long-term borrowing costs, and stimulate or cool economic activity.
When 19 different Fed officials publish 19 different interest rate trajectories, the result is often chaotic. Markets fixate on the median dot, treating it as a blood oath rather than a fleeting estimate. If a single official alters their projection, the median shifts, triggering billions of dollars in algorithmic trading volume. This creates a feedback loop where the Fed is constantly managing market reactions to its own theoretical forecasts. According to research published by the International Monetary Fund, central bank communications that provide excessively narrow path projections often result in higher bond market volatility when those paths inevitably change.
Warsh’s proposed alternative is a return to an older, quieter style of central banking. The Fed should state what it is doing today, provide a brief rationale based on current data, and remain largely silent on what it might do six months from now. This approach acknowledges the inherent unpredictability of the global macroeconomy. It shifts the burden of forecasting back to private markets, where it belongs. The Federal Reserve, in this model, speaks through its actions—its rate adjustments and balance sheet mechanics—rather than its press releases.
If the Federal Reserve were to adopt this doctrine of strategic silence, the immediate downstream consequence would be a structural repricing of risk across global markets. For the past 15 years, a vast ecosystem of analysts, commentators, and algorithmic trading models has been built entirely around parsing Fed rhetoric. A sudden reduction in central bank forward guidance would strip away the guardrails that equity and bond markets have come to rely on.
In the short term, this shift would almost certainly spike the VIX and drive up bond yields, as investors demand a higher premium for the uncertainty of an unscripted Fed. Traders would no longer have the luxury of perfectly timed rate cut expectations. Instead, they would be forced to closely monitor real-time economic indicators—wage growth, supply chain bottlenecks, and capital expenditure trends—to anticipate monetary policy adjustments. This represents a return to fundamental investing. As noted by The Economist in a recent briefing, stripping away the Fed’s vocal safety net could ultimately create a more resilient financial system, one less prone to the speculative bubbles that form when borrowing costs are transparently guaranteed.
For policymakers, adopting Warsh’s approach would require immense institutional discipline. Central bankers are naturally inclined to manage expectations. Stepping back to the podium and saying less during a crisis runs contrary to modern political instincts. Yet, for businesses and citizens, a quieter Fed might actually be a more effective one. When the central bank constantly shifts its rhetoric to manage daily market sentiment, it risks losing the public’s trust. A Fed that speaks rarely, but acts decisively, projects a far greater sense of authority than one that issues a 3,000-word justification for every 25-basis-point move.
The push for a quieter Federal Reserve is not without its fierce detractors. Many prominent economists and former policymakers argue that retreating from the current communication framework would be a catastrophic step backward. The modern era of monetary policy transparency was hard-won, largely driven by Ben Bernanke’s desire to democratise the institution and prevent the kind of market panic that occurs when investors are caught entirely off guard.
Defenders of the status quo argue that forward guidance is not just a communication strategy; it is an active monetary policy tool. When short-term interest rates hit zero, as they did after 2008 and again in 2020, the Fed’s only remaining lever to stimulate the economy was the promise to keep rates low for a prolonged period. Abandoning this tool deprives the central bank of crucial ammunition during a severe downturn. A working paper from the Brookings Institution defends the dot plot, noting that while it is imperfect, it successfully lowers long-term bond yields during crises by anchoring public expectations.
Furthermore, critics of Warsh note that financial markets are vastly more complex and interconnected today than they were in the 1990s. The idea that markets will efficiently discover prices without central bank guidance ignores the reality of modern algorithmic trading, which can trigger cascading liquidity crises in the absence of clear institutional signals. From this perspective, the Fed’s verbose explanations are a necessary public utility, preventing systemic shocks by ensuring all market participants have equal access to the central bank’s baseline assumptions.
The debate over the Federal Reserve’s communication strategy is ultimately a debate about the limits of economic forecasting and institutional humility. Warsh’s critique cuts to the heart of a modern technocratic fallacy: the belief that if you simply explain a complex system in enough detail, you can control its outcome. The reality of the past few years—marked by transitory inflation narratives that proved dramatically wrong—suggests that excessive transparency can sometimes resemble institutional hubris.
By pre-committing to future actions, the Fed has traded long-term credibility for short-term market placation. Whether the institution will willingly surrender the microphone remains to be seen. But the argument for doing so is gaining traction among those who remember a time when central banks commanded respect not by forecasting the future, but by acting decisively when the future arrived. Silence, in the realm of central banking, may soon be a premium asset.
Discover more from The Economy
Subscribe to get the latest posts sent to your email.
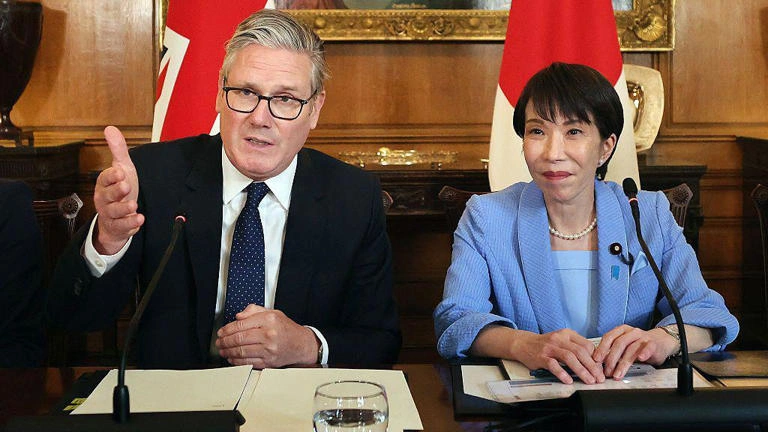
The financial architecture linking London and Tokyo just received its most significant structural reinforcement in a generation. With the formalization of the £18 billion UK Japan investment agreement, a massive influx of East Asian capital is officially bound for British soil, targeting critical sectors from offshore wind farms to next-generation semiconductor facilities. This capital deployment isn’t a sudden twist of diplomatic fortune. It represents the culmination of multi-year bilateral negotiations designed to insulate both island nations from shifting geopolitical alliances and volatile global energy supply lines. For the British economy, long starved of transformative capital expenditure, the scale of this commitment marks a decisive shift in how whitehall secures cross-border corporate commitments.
The macroeconomic backdrop framing this arrangement is one of mutual necessity. Britain is racing against its own ambitious net-zero deadlines while grappling with a tight domestic fiscal environment that limits direct public subsidies. Japan, conversely, possesses massive institutional liquidity and corporate balance sheets eager to find yield outside an ultra-low-interest domestic arena. By matching Japanese private liquidity with British green assets, the two nations are pioneering a model of co-dependent economic security.
Recent data from the Office for National Statistics shows that foreign direct investment UK inflows have faced structural headwinds over the past five years. This capital injection acts as an economic shock absorber. This agreement solidifies a trend where sovereign economic survival relies less on sweeping multilateral treaties and more on highly targeted, sector-specific investment pipelines between trusted democratic allies.
The operational reality of the UK Japan investment agreement centers on massive infrastructure commitments led by some of Japan’s largest trading conglomerates, or sogo shosha. Chief among these is the Marubeni Corporation, which has committed approximately £10 billion over the next decade to develop offshore wind and green hydrogen projects in Scotland and Wales. Simultaneously, Sumitomo Corporation intends to deploy £4 billion into the UK’s electrical grid infrastructure, targeting subsea cabling projects that are vital for connecting remote maritime energy generation to urban industrial centers.
+-----------------------------------------------------------------+
|               £18 Billion Total Capital Allocation              |
+-----------------------------------------------------------------+
| [===================] Marubeni Corp: £10bn (Wind & Hydrogen)    |
| [========] Sumitomo Corp: £4bn (Grid Infrastructure)            |
| [====] Mitsubishi Estate & Others: £4bn (Tech & Real Estate)    |
+-----------------------------------------------------------------+
These numbers represent a significant scale of capital commitment. According to an official press release from the UK Department for Business and Trade, this coordinated deployment will directly support thousands of supply chain jobs from the Humber estuary down to the tech clusters of Bristol. On June 11, 2026, corporate executives from Tokyo finalized the project timelines during a closed-door summit at Lancaster House, ensuring that initial capital drawdowns begin before the end of the current fiscal quarter.
What makes this development distinct from previous corporate expansions is its deep integration into domestic industrial planning. The funds won’t merely acquire existing portfolios; they are explicitly earmarked for greenfield engineering developments. This includes funding for the specialized manufacturing vessels required by the offshore wind supply chain, a bottleneck that has routinely slowed down British maritime energy expansion. By anchoring these investments in physical supply chains, the agreement creates a structural relationship that cannot easily be undone by future political transitions or shifting market cycles.
What is the UK Japan investment deal?
The UK-Japan investment deal is a formal economic pact securing £18 billion in private Japanese capital for the UK economy. It prioritizes clean energy infrastructure spending, offshore wind supply chains, and semiconductor technology, strengthening bilateral trade while reducing supply chain reliance on autocratic states.
Moving beyond the immediate numbers reveals how clean energy infrastructure spending reshapes bilateral alliances in an era dominated by economic de-risking. Historically, Anglo-Japanese trade relations focused heavily on the automotive sector, defined by Nissan’s massive manufacturing footprint in Sunderland or Toyota’s operations in Derbyshire. Yet, the transition to electric vehicles and the fragmentation of global microchip logistics have forced a pivot toward structural energy security and technological independence.
       [ Tokyo Liquid Capital ] -----------> [ London Energy Assets ]
                  |                                     |
                  v                                     v
       Insulation from East Asian             Diversified Power Grid &
         Geopolitical Volatility               Supply Chain Resilience
The corporate strategy driving Marubeni and Sumitomo reflects a desire to lock in long-term regulatory yields. The UK’s Contracts for Difference (CfD) framework provides a predictable revenue model that appeals to institutional investors seeking alternatives to volatile equity markets.
Still, the strategic benefit for Tokyo is as much geopolitical as it is financial. By positioning themselves at the center of the UK’s energy transition, Japanese firms secure a foundational role in Western European critical infrastructure. This reality was highlighted in an analytical briefing by Chatham House, which noted that mid-sized democratic economies are increasingly forming exclusive technological and energy corridors to insulate themselves from supply shocks originating in East Asia.
The emphasis on microelectronics within this pact further illustrates this trend. A portion of the £18 billion is directed toward joint R&D ventures between British chip designers and Japanese materials manufacturers. As global technology supply chains splinter along ideological lines, this bilateral channel ensures both nations retain access to proprietary lithography techniques and specialized chemical inputs, independent of broader global market disruptions.
The downstream consequences of this investment will be felt most acutely across the UK’s fractured energy transport system. For years, the slow pace of grid connections has hindered the commercial viability of renewable projects, leaving finished wind arrays waiting up to a decade to feed power into the national network. The £4 billion injection from Sumitomo targeting subsea cabling and high-voltage direct current (HVDC) systems changes this dynamic entirely, accelerating the decarbonisation of the National Grid.
Current Bottleneck:
[ Wind Generation ] ---> [ 10-Year Grid Connection Delay ] ---> [ Consumers ]

With Sumitomo Capital Deployment:
[ Wind Generation ] ---> [ Fast-Tracked Subsea HVDC Cables ] ---> [ Consumers ]
This development will fundamentally alter the competitive profile of the domestic energy sector. As foreign direct investment UK flows concentrate in specialized infrastructure, domestic developers will find themselves forced to scale up or risk being sidelined by well-capitalized international consortiums. Data from the International Energy Agency suggests that countries adopting this type of concentrated external infrastructure financing see a 30% acceleration in actual project delivery times, though it often results in long-term infrastructure profits leaving the host nation.
What follows, however, is a complex labor challenge. The engineering skill sets required to deploy deep-water offshore platforms and advanced HVDC converters are in short supply globally. The influx of capital will trigger immediate wage inflation within the British engineering sector as firms compete for a finite pool of technical talent.
Educational institutions in northern England and Scotland will face immediate pressure to produce specialized technicians. The success of this £18 billion deployment ultimately hinges on whether the domestic workforce can scale alongside the incoming capital, turning financial commitments into operational infrastructure before the end of the decade.
Critics of the agreement argue that celebrating an influx of foreign capital masks a deeper structural vulnerability within the British state. Relying so heavily on external corporate actors to build and own core national infrastructure can be viewed as a failure of domestic capital mobilization. Figures published by the London School of Economics indicate that the UK continues to lag behind its G7 peers in domestic corporate investment, leaving it perpetually dependent on foreign balance sheets to achieve basic state objectives like net-zero carbon generation.
There is also the real risk of execution friction driven by Britain’s restrictive planning laws. While Tokyo has promised the capital, the UK’s planning system has historically acted as a graveyard for large-scale infrastructure ambitions. Local opposition and lengthy judicial review processes can delay offshore grid connections for years.
If Marubeni’s capital becomes trapped in bureaucratic inertia, the reputational damage could chill future post-Brexit foreign direct investment UK trends. This would turn a celebrated diplomatic victory into a cautionary tale of institutional paralysis.
The £18 billion agreement between the United Kingdom and Japan represents more than a routine commercial arrangement. It is a calculated exercise in strategic economic alignment between two nations attempting to secure their futures in an unstable global environment. By linking British natural resources with Japanese financial assets, the deal offers a viable path toward infrastructure modernization and supply chain security.
The true test, however, will not be found in the signing of agreements at Lancaster House, but in the ground-breaking ceremonies and engineering deployments across Britain’s industrial landscape.
Discover more from The Economy
Subscribe to get the latest posts sent to your email.

The ledger books of Silicon Valley have rarely seen such aggressive arithmetic. In the last quarter alone, venture capital flowing into generative AI firms shattered previous benchmarks, with total commitments eclipsing $25 billion. For the architects of Wall Street, this is not merely a surge in venture activity; it is a fundamental recalibration of asset allocation. Institutional investors, once wary of the opaque valuations surrounding unproven LLMs, are now viewing the compute-heavy nature of this transition as a defensible moat. The race has moved beyond the prototype phase and into an industrial-scale battle for infrastructure.
The macro environment remains taut. With central banks maintaining higher-for-longer interest rate stances, the cost of capital should theoretically stifle speculative exuberance. Yet, AI has proven to be a notable exception to traditional fiscal gravity. According to data from the International Monetary Fund, the productivity potential of artificial intelligence is decoupling from broader tech-sector stagnation, drawing capital into a singular, high-velocity vortex. This shift is not incidental; it is systemic. When the Bank for International Settlements released its latest quarterly review, the focus rested heavily on the concentration risk inherent in these massive, multi-billion-dollar funding rounds. The money isn’t just seeking innovation; it’s funding the construction of a new digital grid.
The mechanics of current AI fundraising trends
The primary driver behind these AI fundraising trends is the sheer physical cost of the transition. We aren’t just building software; we are building data centers, cooling systems, and specialized semiconductor foundries. Each round is a down payment on a proprietary pipeline of GPU access. As reported by Bloomberg, the scale of investment in infrastructure-layer startups now rivals the R&D budgets of the entire mid-cap tech sector combined.
This capital is coming from a coalition of traditional venture firms and balance-sheet-heavy tech incumbents. The distinction between “venture” and “corporate strategy” is blurring. When a major cloud provider anchors a $5 billion round for a foundation model startup, it isn’t just an investment; it’s a customer acquisition strategy. This creates a feedback loop: investors provide the capital, the startup buys the hardware, and the hardware provider books the revenue. This circular flow of liquidity is what allows valuations to reach dizzying heights despite a lack of clear, recurring enterprise revenue. Still, the participants are not blind. They are betting that the first-mover advantage in compute volume will dictate the winners of the next decade of digital commerce.
Analytical layer: The search for enterprise ROI
The market is currently wrestling with a simple, brutal question: When does the speculative phase end, and the utility phase begin? Investors are increasingly prioritizing companies that demonstrate tangible enterprise ROI rather than those that simply offer impressive model benchmarks.
How much is being invested in AI startups? Global investment in AI-focused startups surged to over $25 billion in the most recent quarter, representing a 30% increase year-over-year. This concentration of capital is directed primarily toward foundational model builders and specialized semiconductor design firms, as investors look to secure a stake in the core infrastructure powering the next generation of enterprise software applications.
What follows, however, is the structural reality of adoption. Many firms have moved past the “pilot” phase, yet the integration of these tools into core business processes remains fragmented. The secondary keyword, venture capital deployment, is now shifting toward “agents”—autonomous software that performs tasks rather than just generating text. Wall Street is watching closely. The valuation of a model startup is now tethered to its ability to integrate with legacy ERP systems. If a firm cannot demonstrate that its LLM reduces headcount costs or accelerates sales cycles, its ability to secure a Series D or E round is effectively neutralized. The era of “growth at any cost” has been replaced by a rigorous, metric-driven demand for operational efficiency.
Implications for capital markets
The downstream consequences of this capital concentration are profound. For traditional equity markets, the influx of liquidity into private AI firms creates a “talent and capital drain” from public markets. Why go public when private capital is available at such scale and with fewer reporting requirements? This trend risks hollowing out the public equity pipeline, leaving retail investors with limited exposure to the true growth engines of the AI economy.
Furthermore, policymakers are beginning to weigh in. The OECD has recently flagged the potential for market monopolization, noting that the sheer cost of AI infrastructure creates an almost insurmountable barrier to entry. If only four or five entities control the compute backbone of the global economy, the competitive landscape narrows significantly. We are seeing a move toward a high-fixed-cost environment where only the largest, best-capitalized firms can compete. This is a departure from the “garage startup” ethos of the early internet era. That said, the velocity of innovation remains high, as open-source competitors continue to chip away at the moat established by the proprietary titans. The market is betting on a winner-take-most outcome, but history suggests that technological shifts are rarely that clean.
The counter-argument: The bubble hypothesis
Critics of the current trajectory suggest we are in a classic capital-expenditure bubble. They point to the disconnect between the billions spent on training runs and the actual subscription revenue generated by generative tools. The skeptic’s view, often echoed by The Financial Times, is that many of these startups are “compute-traps”—entities that burn through endless cash to maintain their place in the GPU queue without a sustainable path to profitability.
These dissenters argue that when the interest rate cycle eventually turns or the enthusiasm for LLM output plateaus, the market will face a significant correction. They highlight the danger of “zombie” models—firms that survive only on the anticipation of an exit or a strategic acquisition, rather than genuine market demand. It is a cautionary tale that echoes the dot-com era, yet with one critical difference: the infrastructure being built today has immediate utility for high-end enterprise clients. The physical capacity for compute is a real, tangible asset, even if the current valuations assigned to software layers are arguably inflated.
The tension between speculative fervour and structural necessity will define the next eighteen months. Capital is not fleeing the sector, but it is becoming more discerning, more transactional, and significantly more demanding of proof. We are witnessing the maturation of a technological revolution, moving from the chaotic excitement of the inception phase to the cold, hard reality of industrial integration. The winners won’t just be those who raise the most capital; they will be those who survive the inevitable pruning of the current landscape. As the dust settles, the focus will shift from the sheer volume of funds raised to the cold calculation of the balance sheet.
Discover more from The Economy
Subscribe to get the latest posts sent to your email.

Kevin Warsh Wants the Fed to Stop Explaining Everything

UK Japan Investment Agreement: Inside the £18bn Deal

AI Fundraising Trends: Wall Street’s Record Capital Influx

China Tungsten Export Curbs: Is Japan’s AI Chip Supply at Risk?

Pakistan Textile Body Welcomes FY27 Budget, Seeks FTR

US Economic Resilience: Why the Economy Keeps Defying the Odds

Global Strategic Oil Reserves Depletion: The Empty Vaults

Dubai Consumer Protection: 155,000+ Inspections Secure Price Stability

18% Shipping Sales Tax Abolition Sparks Maritime Economy Growth

Bank Indonesia Rate Hike 2026: New Mandate’s First Market Test

The Silicon Silk Road: How Memory Chips Rewrote the Retail Map

France opposes ‘anglicisation’ of EU trade talks

Anthropic Suspends Latest AI Models After US Blocks Foreign Access

Goldman and JPMorgan Ease Office Working Rules to Counter World Cup Disruption

China Overhauls the World’s Biggest Surveillance Network with Advanced AI

Kevin Warsh Takes the Fed’s Helm — and Walks Straight Into a Rate-Hike Storm

S&P 500 Slips Back to 7,408 as Oil Storms Past $109, Bond Yields Clock 19-Year Highs

SpaceX IPO: Inside the $2 Trillion Market Debut

SpaceX, OpenAI & Anthropic IPOs: Wall Street’s $200B AI Test

How AI Is Forcing McKinsey and Its Peers to Rethink Pricing

KPMG Australia CEO Resigns After Whistleblower Claims Exposed Investigation Failures

Pakistan Budget FY 2026-27: Relief, Prospects, and the Tightrope Walk

Broadcom Market Value Loss: Revenue Forecast Disappoints

The Guardrails Are Down: How Meta and Google’s AI Models Fold Under Pressure

Is AI Already Putting Graduates Out of Work? The Grim Reality Facing the Class of 2026

Stock Market Correction Risk Mounts as Bond Yields Defy the Bull Case

Five PSX Stocks Worth Owning Before the Second Quarter Ends

Benefitbay Raises $18M to Build the Plumbing for America’s ICHRA Shift
-

 Markets & Finance5 months ago
Top 15 Stocks for Investment in 2026 in PSX: Your Complete Guide to Pakistan’s Best Investment Opportunities
-

 Analysis4 months ago
Top 10 Stocks for Investment in PSX for Quick Returns in 2026
-

 Analysis4 months ago
Brazil’s Rare Earth Race: US, EU, and China Compete for Critical Minerals as Tensions Rise
-

 Banks5 months ago
Best Investments in Pakistan 2026: Top 10 Low-Price Shares and Long-Term Picks for the PSX
-

 Investment5 months ago
Top 10 Mutual Fund Managers in Pakistan for Investment in 2026: A Comprehensive Guide for Optimal Returns
-

 Analysis4 months ago
Johor’s Investment Boom: The Hidden Costs Behind Malaysia’s Most Ambitious Economic Surge
-

 Global Economy6 months ago
15 Most Lucrative Sectors for Investment in Pakistan: A 2025 Data-Driven Analysis
-

 Global Economy6 months ago
Pakistan’s Export Goldmine: 10 Game-Changing Markets Where Pakistani Businesses Are Winning Big in 2025