
Analysis
The Weird World of Work Perks: Companies Are Reining In Benefits — But Workers!

In January 2026, a mid-level product manager at a San Francisco tech firm received a company-wide memo. The free artisan cold brew taps were being removed. The on-site acupuncture sessions, gone. The monthly “Wellness Wednesdays” — those mandatory mid-afternoon meditation circles that required cancelling actual work meetings — quietly discontinued. The memo was written in the careful, mournful language of a eulogy. But when she told me about it, she laughed. “Honestly?” she said. “Best news I’d heard in months.”
She is not alone. Across the United States, United Kingdom, Germany, Japan, and beyond, companies facing a brutally changed economic reality are doing what they swore they never would: cutting the perks. Healthcare costs are projected to rise 9.5% in 2026, according to Aon’s Global Medical Trend Rates Report, the steepest increase since the post-pandemic shock years. Mercer’s 2026 National Survey of Employer-Sponsored Health Plans projects a more conservative but still alarming 6.5% average spike. Add AI-driven efficiency mandates, cooling venture funding, and an increasingly skeptical CFO class, and the era of the corporate perk — that glittering monument to Silicon Valley’s self-mythology — is entering a long, overdue reckoning.
Here is the uncomfortable truth that most HR consultants won’t put in their PowerPoints: many of these perks were never really for workers at all.
The Great Perk Retreat: What’s Actually Happening
The data is unambiguous. WorldatWork’s 2026 Total Rewards Survey found that 47% of large employers (5,000+ employees) have eliminated or significantly scaled back at least three non-healthcare discretionary benefits since 2024. MetLife’s 2026 Employee Benefit Trends Study — one of the most comprehensive annual reads on workforce sentiment — reports that employers’ top cost-cutting targets include on-site amenities, lifestyle benefits, and supplemental wellness programmes.
Google, famously the architect of the modern perk arms race, has reportedly reduced its legendary free food budget by an estimated 20–25% across several campuses since 2023, quietly removing some specialty stations while expanding cafeteria-style options. Meta has similarly consolidated office perks as part of its broader “Year of Efficiency” philosophy — a phrase that has since calcified into corporate gospel. The Wall Street Journal reported that dozens of mid-cap US firms have dropped gym subsidies and mental-health app subscriptions they added during the pandemic, citing low utilisation rates that were embarrassingly obvious in the data all along.
But here’s where it gets interesting. Worker surveys tell a surprisingly counter-intuitive story.
Gallup’s 2026 State of the Global Workplace Report found that when employees ranked what most influenced their daily job satisfaction, non-cash perks — the foosball tables, the on-site massages, the company-branded merchandise — ranked near the bottom, behind schedule flexibility, manager quality, meaningful work, and fair pay. In fact, 68% of respondents said they would prefer a $3,000–$5,000 increase in their annual flexible spending allowance over any combination of lifestyle perks.
The Dark Side of “Benefits”: When Perks Were Really Control
I’ve spoken with C-suite leaders — a CHRO at a Fortune 200 consumer goods company, two HR directors at UK financial services firms — who admit, usually off the record, what strategists have long whispered: many perks were designed not to enrich employees’ lives but to keep them in the building longer.
The most obvious example is free food. The myth of the Google cafeteria — gourmet, free, available at every hour — sounds like generosity. But a 2024 Harvard Business Review analysis found that the strategic logic of on-site dining has always been retention through friction reduction: if employees never have to leave for lunch, they don’t leave. They stay. They work. The “perk” is, in the cold light of labour economics, a very elegant subsidy for unpaid overtime.
On-site laundry, dry cleaning, car detailing, concierge services — the same logic applies, scaled to absurdity. These aren’t benefits; they are life management services that exist so employees can delegate their personal responsibilities to the employer and, in exchange, surrender their time.
The late-2010s corporate wellness industrial complex deserves its own indictment. Mandatory yoga, step-count competitions, nutrition coaching, and sleep tracking programmes — all presented as caring for worker wellbeing — frequently became surveillance architectures. A 2025 McKinsey Health Institute report on workplace wellness found that nearly 40% of employees felt that corporate wellness programmes made them feel more monitored, not healthier. Several studies found that workers who used employer health apps showed higher rates of reported health anxiety, not lower. The tracking, it turns out, was often the problem.
Then there’s the performative quality of it all. Ping-pong tables became so culturally synonymous with hollow corporate culture that they now function almost as a satirical shorthand. The Instagram-worthy slides at the Googleplex, the fireman’s pole at LinkedIn’s San Francisco office — these weren’t employee benefits. They were recruitment theatre: visual signals to 22-year-old candidates that this was a fun place to work. The workers who lived inside those offices year after year often found them patronising at best, infantilising at worst.
A Global Picture: The Perk Divergence
The corporate perk retreat is not uniform. Its shape reflects deep structural differences in how nations have always thought about work.
In the United States, where employer-provided healthcare remains the dominant model, the benefits conversation is existential in a way it simply isn’t elsewhere. With healthcare costs consuming an estimated 8.9% of total compensation costs for private industry employers (Bureau of Labor Statistics, 2026), every discretionary perk cut is, in effect, a subsidy reallocation toward the healthcare premium that employees genuinely cannot do without. American workers may lose kombucha on tap; they cannot afford to lose dental.
In Europe, the dynamic is profoundly different. Because statutory social protections — parental leave, healthcare, redundancy pay — are enshrined in law rather than left to employer generosity, the perk conversation has always been more honest. German firms, for example, never needed to use healthcare as a retention lever; they competed on job security and works council influence. Today, as the Financial Times has reported, European firms are instead debating hybrid work entitlements and four-day week pilots as their differentiation tool — perks with genuine structural value.
In Asia, and particularly in Japan and South Korea, the corporate loyalty model built around company housing, communal meals, and paternalistic social provision is under different but equally significant pressure. Japan’s labour reform agenda — driven by the government’s stated goal of dismantling karoshi (death from overwork) culture — is actively pushing firms away from “total life provision” models that blur work and personal time into an undifferentiated grey zone. The perk, in this context, was always part of a totalising corporate identity. Loosening it is, paradoxically, a form of liberation.
In emerging markets — particularly India’s booming tech sector — the perk race has been imported wholesale from Silicon Valley, with predictably mixed results. Bangalore-based firms offering imported cold brew and on-site creches in a country where the median worker earns a fraction of their US counterpart create striking inequalities both inside and outside the office walls.
The Perks Workers Actually Won’t Miss: A Ranked Assessment
Let’s be direct. Not all perks are equal, and the discourse often fails to distinguish between genuine worker welfare and performative corporate largesse.
Perks workers are quietly relieved to lose:
- Mandatory “fun” activities — Compulsory escape rooms, team karaoke nights, and enforced happy hours. These consistently score as the most resented pseudo-benefit in workforce surveys. A 2026 SHRM report found 54% of employees described mandatory social events as a source of stress, not relief. Introverts, caregivers, and non-drinkers disproportionately bear the cost of “inclusive” events designed around a very specific personality type.
- On-site dry cleaning and concierge services — The sincerest expression of the “total life capture” model. When your employer does your laundry, you are not being pampered; you are being made incapable of leaving the office.
- Wellness app subscriptions with employer visibility — When companies can see whether you’ve completed your mindfulness session or hit your step count, the therapy becomes the surveillance. The American Psychological Association’s 2025 Work and Well-Being Survey found that employees who used employer-provided mental health apps were significantly less likely to disclose genuine psychological distress.
- Free gourmet food with implicit expectations — The cafeteria that closes at 9pm because you were expected to eat dinner there was never a perk. It was an unwritten contract.
- Branded company merchandise — The fleece vest. The tote bag. The motivational desk calendar. This benefits the company’s brand, not the employee’s life.
- Gaming and recreation rooms — Used by a tiny proportion of employees. Glassdoor data from 2025 shows that mentions of on-site recreational facilities in employee reviews correlate negatively with overall satisfaction scores, suggesting they signal cultural dysfunction more than genuine investment.
- Employee recognition platforms — The gamified peer-to-peer praise tools that turned professional respect into a points economy. Widely reported as performative and sometimes deeply uncomfortable for recipients.
Perks workers genuinely value and must not be cut:
- Mental health days and genuine psychological support (access to real therapists, not apps)
- Robust parental leave — particularly for non-birthing parents and adoptive families
- Schedule flexibility and remote work autonomy
- Professional development budgets that employees control
- Caregiving support — elder care and childcare subsidies
- Transparent, equitable pay
The distinction is not complicated once you see it: perks that expand an employee’s real autonomy and financial security are genuinely valuable; perks that entangle the employee more deeply in corporate life are not.
The Inequality Engine Hidden in the Perks Cabinet
Here is the critique that is rarely made: many corporate perks are inequality amplifiers dressed as equalising benefits.
Free food benefits employees who eat in the office — disproportionately those without caregiving responsibilities, those who live nearby, those who are already the most captured by corporate culture. Remote workers, parents who leave at 5pm to collect children, employees with dietary restrictions navigating a kitchen designed by a 28-year-old chef — they receive less, or nothing at all.
Gym subsidies that require using a specific on-site facility benefit employees near headquarters. Mental health apps offered in English in a multilingual workforce are, functionally, available only to some. The on-site childcare that sounds transformative serves a fraction of the workforce and creates resentment among those without children who receive no equivalent benefit.
A 2025 Deloitte Insights analysis on benefits equity found that the top 20% of earners — those with the most schedule flexibility and physical proximity to headquarters — captured an estimated 3.4 times more value from discretionary perks than the bottom 40%. The free coffee is not distributed equally. It never was.
What Should Replace the Ping-Pong Table in 2026–2027?
The answer is not complicated. It is merely expensive — and requires companies to trust their employees with money rather than manage them with experiences.
The new employee value proposition looks like this:
Flexible benefits budgets. Give employees an annual allowance — $2,000 to $5,000 — to spend on approved categories of their own choosing: gym membership, therapy, childcare, home office equipment, student loan contributions, travel. This is already operating successfully at companies including Salesforce, Spotify, and several major European insurers. It treats employees as adults.
True location and schedule autonomy. The data from Stanford economist Nicholas Bloom’s ongoing remote work research is consistent and decisive: hybrid work, properly designed, increases productivity, reduces turnover, and improves reported wellbeing. The perk of “being allowed to work from home” is not a perk at all — it is a baseline of civilised employment in 2026.
Genuine pay transparency and equity. No amount of cold brew compensates for discovering that a colleague doing the same work earns 18% more. PwC’s 2026 Workforce Pulse Survey found that pay transparency, when implemented thoughtfully, increases trust faster than any benefits programme.
Meaningful mental health infrastructure — not apps, but access to licensed therapists, generous sick leave policies that do not require performance of wellness, and management cultures that do not punish time off.
Investment in career development. The World Economic Forum’s 2025 Future of Jobs Report found that access to reskilling and career growth is the second most important factor in employee retention, behind pay. A LinkedIn Learning subscription that no one uses is not this. A real education budget that an employee can spend on an MBA course, a coding bootcamp, or an industry conference is.
The Bottom Line
The great perk retreat of 2026 is, at its core, a correction. It is the slow unwinding of a decades-long confusion between employee capture and employee care — a conflation that served companies far better than it ever served the people working in them.
The ping-pong table was always a mirror: it reflected back what the company wanted you to see, not what you actually needed. Losing it, for many workers, feels less like deprivation and more like clarity.
The companies that will win the talent wars of the next decade are not those who grieve the demise of the kombucha tap. They are those who replace it with something workers have always actually wanted: the money, the time, and the autonomy to build a life worth showing up for.
That is not a perk. It is, merely, a decent deal.
FAQ: Work Perks in 2026
Q: Are companies legally required to provide perks beyond statutory benefits? In most jurisdictions, no. Statutory requirements vary — the UK mandates 28 days of paid leave, the EU Working Time Directive sets minimum rest requirements, and US federal law requires relatively little beyond FLSA and FMLA provisions. Discretionary perks are voluntary, which is precisely why cutting them reveals their true nature.
Q: Which corporate perks have the highest utilisation rates? According to MetLife’s 2026 Employee Benefit Trends Study, the highest utilisation benefits are: dental and vision coverage, mental health services (when genuinely confidential), flexible spending accounts, and hybrid work arrangements. On-site amenities consistently show sub-30% utilisation.
Q: Are companies cutting benefits or just shifting the mix? Mostly shifting. The total compensation envelope is often holding steady while its composition changes — away from lifestyle perks and toward healthcare contributions and cash-equivalent benefits. This is, on balance, better for workers who were never using the foosball table.
Q: How do European benefit cuts compare to US ones? European cuts are more constrained by regulation and stronger works councils. The locus of European benefit debates in 2026 is around hybrid work entitlements and four-day week pilots — structural flexibility rather than office amenities.
Q: Why did the perk arms race start in the first place? It originated in 1990s Silicon Valley as a recruiting tool for scarce engineering talent — a genuine competitive necessity. It was then cargo-culted across industries and geographies by companies that adopted the aesthetics without understanding the economics. The result was a multi-billion-dollar industry of performative workplace hospitality.
Q: Do younger workers (Millennials, Gen Z) value perks differently? Yes, substantially. Deloitte’s 2026 Global Millennial and Gen Z Survey found that Gen Z in particular ranks work-life balance, mental health support, and flexible location arrangements far above lifestyle perks. They are, as a generation, more sceptical of corporate culture performance than any cohort before them.
Q: What’s the single most valuable thing a company can offer in 2026? The data and the workers largely agree: genuine schedule and location flexibility, combined with fair pay. Everything else is negotiable.
Discover more from The Economy
Subscribe to get the latest posts sent to your email.


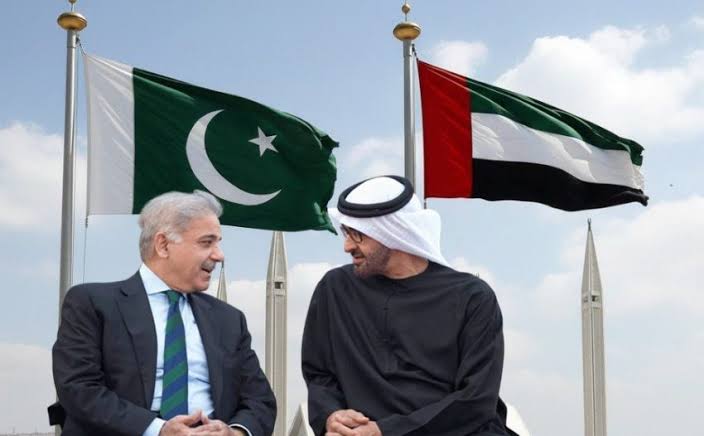
What happened: In early 2026, the United Arab Emirates declined to roll over a $3 billion loan to Pakistan — the first such refusal in seven years. The repayment equalled roughly 18% of Pakistan’s foreign currency reserves, arriving as Islamabad also faced a $1.3 billion bond payment and was waiting on the next IMF tranche.
Why it matters: It’s the clearest sign yet that Gulf sovereign patience with Pakistan’s balance-of-payments cycle is thinning, even as Gulf states simultaneously court China, Saudi Arabia, and each other for capital in a tightening regional liquidity environment.
The Story Nobody’s Connecting
Most coverage of Pakistan’s 2026 external account stress treats the UAE’s loan decision as an isolated liquidity event — a “routine financial transaction,” in the words of Pakistan’s own Ministry of Foreign Affairs. That framing misses the bigger pattern. The same weeks that Abu Dhabi called in its $3 billion, unusual delays began appearing in bank transfers from Saudi Arabia to the UAE itself — friction between the Gulf’s two largest economies, at a moment when both are also managing their own post-war oil price adjustment. (Pakistan & Gulf Economist)
Put those two data points together and a different story emerges: this isn’t just about Pakistan’s creditworthiness. It’s about Gulf capital becoming more selective, more transactional, and less willing to extend informal grace periods across the board — with Pakistan simply the most exposed borrower in the queue.
The Numbers Behind the Pressure
Pakistan’s State Bank held $16.4 billion in reserves as of late March 2026 — enough to cover roughly three months of imports, a threshold economists generally treat as a comfort floor, not a cushion. (Mettis Global News) The UAE’s declined rollover landed at the same time as a looming $1.3 billion international bond payment and dependence on the next $1.2 billion IMF disbursement — a convergence of obligations that left the State Bank with limited room to maneuver beyond import restrictions, rate hikes, or fresh commercial borrowing.
The backdrop matters too. The rupee had been trading in a comparatively narrow 278–282 band before the escalation of the Iran conflict pushed global oil prices higher, squeezing Pakistan’s import bill precisely when its Gulf safety net began to wobble. The KSE-100 benchmark, meanwhile, had already shed around 15% amid the broader pressure. (Mettis Global News)
This is not Pakistan’s first Gulf-dependency cycle. The IMF’s own record shows a now-familiar pattern: staff-level agreements reached in Dubai, UAE pledges of multibillion-dollar investment arriving alongside IMF tranches, and Gulf bridge financing used to stave off sovereign default in periods when reserves cover shrinks toward zero. (Business Standard) What’s different in 2026 is that the bridge itself is showing cracks.
Islamabad’s Official Line vs. the Structural Reality
Pakistan’s government has leaned into a “stability to sustainable growth” narrative around its FY2026–27 federal budget, with the finance minister framing the transition as export-driven rather than reserve-dependent. Business groups have broadly welcomed the budget, and the current account posted a $459 million surplus in May 2026, an improvement attributed to strong remittance inflows. (Business Recorder) The Monetary Policy Committee has held rates steady rather than reaching for emergency tightening, which is itself a signal that the central bank does not yet see the UAE episode as a systemic trigger.
But a current account surplus built substantially on remittances is different from one built on export competitiveness or durable FDI. Pakistan’s trade structure still leans heavily on a narrow set of partners: China supplies over a quarter of its imports and a meaningful share of its exports, the UAE is both a top export destination and its second-largest import source, and Gulf states collectively remain the primary channel for both remittances and emergency liquidity. (Wikipedia — Economy of Pakistan) That concentration is precisely what makes a single Gulf lender’s changed appetite so consequential.
Why the Oil Backdrop Compounds the Risk
None of this is happening in a vacuum. The IMF’s own July 2026 commentary noted that global oil markets “absorbed the war shock” from the Iran conflict, but cautioned that buffers — spare production capacity, strategic reserves, shipping insurance capacity — are running low. (IMF Blog) For an oil-importing, reserve-constrained economy like Pakistan, a second energy price shock without deeper buffers would land directly on the same reserves the UAE loan was meant to protect.
What to Watch Next
- Whether Saudi Arabia steps in as an alternative bridge lender, or whether the Riyadh–Abu Dhabi transfer friction signals a broader Gulf liquidity tightening that limits everyone’s appetite to backstop Pakistan.
- The pace and size of the next IMF tranche, and whether Fund conditionality shifts to demand deeper reserve buffers given the UAE precedent.
- Whether China increases its role as lender of last resort, deepening Pakistan’s dependency in exactly the direction Gulf financing was historically meant to offset.
Discover more from The Economy
Subscribe to get the latest posts sent to your email.
Introduction
The European Council formally extended its economic sanctions against Russia for another full year on 25 June 2026, keeping restrictive measures in place until 31 July 2027 (Council of the EU). More than four years into the war, the headline story of Russia’s economy has shifted from whether sanctions would work to a more nuanced question: how much longer can the Kremlin keep financing the war before the accumulated strain becomes impossible to hide behind favorable official statistics.
The Sanctions Architecture, Renewed Again
The EU’s economic measures against Russia, first introduced in 2014 and dramatically expanded after the February 2022 full-scale invasion, now span trade, finance, energy and dual-use technology restrictions, alongside asset freezes and travel bans on a broad range of individuals and entities (Council of the EU). Since February 2022, the EU has adopted 20 separate sanctions packages, and the European Council has explicitly stated it remains determined to keep weakening Russia’s war economy by further reducing its energy revenues, curbing shadow-fleet oil shipping operations and constraining its banking system (Council of the EU). Separately, on 3 July 2026 the EU sanctioned six individuals connected to the poisoning and death of opposition figure Alexei Navalny, underscoring that the sanctions regime continues to expand on human-rights grounds as well as economic ones (Council of the EU Sanctions Timeline).
The Headline Numbers Beijing-Style Optimism Can No Longer Explain Away
Russia’s GDP is now put at roughly $2.51 trillion, the world’s eleventh-largest economy — comparable in size to South Korea despite Russia’s vastly larger landmass and resource base — with 2026 growth projected at just 1.0% and inflation running at 5.2% (Statistics of the World). More pessimistic estimates put full-year 2026 growth even lower, at around 0.4%, which would be worse than 2025’s already-weak 1% expansion and would mark a sharp deceleration from the 4.1% growth Russia posted in 2023 as it forged new trading relationships to route around initial sanctions (Forbes).
Oil and gas revenues — historically around half of Russia’s state income — have fallen to roughly a quarter, a deliberate outcome of Western sanctions strategy that targets how much Russia earns from exports rather than blocking those exports outright (Stockholm School of Economics/SITE). Russia’s oil and gas budget revenues reportedly halved in January 2026 alone, with crude prices falling below $73 a barrel before the Middle East conflict briefly reversed the trend, sending Brent surging more than 55% to near $120 a barrel at its peak (Forbes).
The Middle East War: A Temporary Lifeline With Long-Term Costs
The spike in oil prices tied to the Iran conflict, combined with a period of eased US sanctions enforcement on Russian oil under President Trump, offered Moscow unexpected fiscal breathing room in mid-2026 (Forbes). But that same conflict has undermined Russia’s longer-term energy diversification ambitions in the region: two Russian-backed power plant projects in Iran have been put on hold, along with oil and gas exploration work and plans to build new transit routes linking Russia to India via Iran (Forbes).
The Gap Between Official Statistics and Underlying Reality
Perhaps the most important analytical point from recent research is not about any single data point but about the reliability of Russian statistics themselves. Torbjörn Becker of the Stockholm Institute of Transition Economics has argued the real test of sanctions is not whether they end the war overnight, but how much they erode the Kremlin’s capacity to finance it — and by that measure, the evidence points to deeper strain than headline GDP figures suggest (Stockholm School of Economics/SITE). Becker notes that Russia’s economy grew only modestly in 2022 despite oil prices rising sharply that year — a gap between expected and actual performance that implies a considerably larger hidden economic hit than the official contraction figures showed (Stockholm School of Economics/SITE). Compounding the problem, Russian authorities have stopped publishing several key statistics since 2022, making independent assessment of inflation, consumption and real economic conditions increasingly difficult — leading Becker to conclude that “statistics have become part of the narrative” rather than a neutral measure of economic reality (Stockholm School of Economics/SITE).
The Military-Civilian Economic Split
A recurring theme across recent analysis is the growing bifurcation between Russia’s overheating military-industrial sector and a stagnating civilian economy. This imbalance has pushed interest rates higher and forced the liquidation of a striking 71% of Russia’s gold reserves to help fund continued war spending (Forbes). Russia’s total fossil fuel export revenue is estimated at roughly €734 million per day, underscoring just how central hydrocarbon income remains to the entire war financing model even as that revenue stream shrinks (Forbes).
The Counter-Narrative: Wages Still Rising
It would be inaccurate to describe Russia’s economy as in freefall. CSIS research notes that Russian salaries rose 17.8% in nominal terms and 8.7% in real terms in 2024 compared to 2023, with disposable incomes up 6.1% in 2023 and 7.3% in 2024 — growth rates not seen in Russia in almost two decades (CSIS). Government budget projections still expect real salaries to rise, albeit at a decelerating pace: 7% in 2025, 5.7% in 2026 and 4.1% in 2027 — a marked slowdown from the 2024 peak but still roughly double the pre-invasion decade average (CSIS). This wage growth, driven substantially by wartime labor shortages and military-adjacent spending, is precisely the kind of headline-stabilizing data point that has allowed Putin to argue publicly that sanctions have failed to cripple his economy (Fortune) — even as think tanks describe the broader trajectory as pushing Russia toward what one report calls an “economic, political, and military abyss” (Fortune).
What Comes Next
Renewed legislative pressure in Washington — including the Sanctioning Russia Act introduced with strong bipartisan support — signals appetite in the US for tightening the screws further, even as the loss of a key congressional champion for that effort has complicated the political path forward (TIME). Whether the EU’s renewed sanctions regime, continued oil price pressure, and constrained reserves ultimately force a shift in Kremlin calculus toward negotiation remains the central open question for 2027.
Key Takeaways
- The EU has extended Russia sanctions for a further year, through 31 July 2027, continuing a regime built from 20 separate packages since 2022.
- Russia’s 2026 GDP growth is forecast between 0.4% and 1.0%, a sharp deceleration from 2023’s 4.1% post-shock rebound.
- Oil and gas revenue’s share of Russian state income has fallen from roughly half to about a quarter as Western sanctions target export earnings specifically.
- Russia has liquidated a large share of its gold reserves to sustain war financing amid a widening split between an overheating military sector and a stagnating civilian economy.
- Official Russian statistics likely understate the true economic strain, according to independent economists who cite a widening gap between reported and expected performance.
Sources: Council of the EU, Council of the EU Sanctions Timeline, Stockholm School of Economics/SITE, Forbes, Statistics of the World, CSIS, Fortune, TIME
Discover more from The Economy
Subscribe to get the latest posts sent to your email.
Analysis
Dubai’s Millionaire Magnet: How the UAE Turned Middle East Turmoil Into a Capital Safe-Haven Boom

Introduction
While much of the commentary on the 2026 Middle East conflict has focused on oil tankers and the Strait of Hormuz, a quieter and arguably more consequential story has been unfolding in Dubai and Abu Dhabi: capital is flowing in, not out. The UAE attracted roughly 9,800 net new millionaires in 2025 — the highest net millionaire inflow of any country globally, according to Henley & Partners — and 2026 data suggests the pattern is holding even as regional tensions have periodically spiked (Tap Fiscal). For a global content audience trying to understand why a country geographically adjacent to an active conflict zone is functioning as a safe haven rather than a risk zone, the answer lies in three decades of deliberate institutional design.
The Headline Numbers
Dubai’s economy grew 2.4% in the first quarter of 2026 alone, with GDP reaching AED 232 billion, according to figures reported via the official WAM news agency (Gateway Group UAE Weekly Business News). The UAE Central Bank’s own outlook projects national economic growth of 5.6% for 2026, outpacing the broader GCC average, with the hydrocarbon sector expected to grow 7.3% on higher oil production even as non-oil sectors — financial services, manufacturing, trade, tourism and transport — continue to carry the bulk of long-term momentum (Xinhua). Non-oil activity now accounts for roughly 75% of GDP, a diversification level that insulates the economy from oil-price shocks far more than headlines about the region typically convey (Tap Fiscal).
Why S&P and the Central Bank Both Say the UAE Can Absorb the Shock
A dedicated S&P Global Ratings assessment concluded the UAE’s banking sector has shown strong resilience and financial soundness through the recent period of regional volatility, and the agency expects solid loan growth to continue into 2027, supported by ample system liquidity amid expected monetary easing (Gulf News). S&P separately reaffirmed the UAE’s sovereign credit rating at AA/A-1+ with a stable outlook, citing strong fiscal buffers and one of the world’s largest sovereign wealth portfolios (Xinhua).
The scale of that buffer is difficult to overstate. S&P estimates the UAE’s consolidated net asset position will reach roughly 184% of GDP in 2026, with government liquid assets calculated at approximately 210% of GDP (Gulf News). That firepower sits across a small number of globally diversified institutions — the Abu Dhabi Investment Authority, Mubadala Investment Company, ADQ, the Investment Corporation of Dubai, and the Emirates Investment Authority — which generate income well beyond the oil sector and give the state fiscal flexibility that few conflict-adjacent economies possess (Gulf News).
The UAE Central Bank’s own Q1 2026 review points to the same conclusion from the market side: the Dubai Financial Market’s share price index rose 22.9% year-on-year in the fourth quarter of 2025, the Abu Dhabi Securities Market General Index gained 6.6%, and credit default swap spreads for both Abu Dhabi and Dubai narrowed further — a signal of sustained investor confidence rather than flight (Central Bank of the UAE Quarterly Economic Review).
The Short-Term Noise Was Real — But It Didn’t Stick
None of this means the conflict has been costless. In the early days of escalation, some expatriates left the UAE, private jet charter prices to exit Dubai briefly spiked to as much as $250,000, and hotel occupancy dipped alongside disrupted aviation routes (Tap Fiscal). But the institutional and long-term investor data tell a different story than the panic-driven headlines: the Dubai International Financial Centre has resumed normal operations and remains home to nearly 9,000 active firms spanning wealth management, banking and capital markets (Tap Fiscal). A UAE government minister framed the resilience explicitly, describing the economy as structurally sound and built over decades to adapt to crisis rather than be destabilized by it (Tap Fiscal).
What’s Driving the Millionaire Inflow Specifically
High-net-worth migration to the UAE is not a new phenomenon, but 2025’s record net inflow suggests the safe-haven thesis is strengthening rather than fading. The pattern is consistent with what analysts describe as a flight to stable, low-tax jurisdictions with strong rule of law during periods of global uncertainty (Tap Fiscal) — a category the UAE has spent two decades positioning itself to fit, through free zones, golden visa programs, and a deliberately diversified, sovereign-wealth-anchored economy that does not rise or fall with a single sector or a single regional headline.
Risks Worth Watching
- Banking system exposure to regional escalation: while S&P’s baseline case is resilience, further escalation involving direct disruption to Gulf shipping lanes or energy infrastructure would test the “limited and short-term” impact assumption analysts currently hold (Xinhua).
- Real estate cooling: separate reporting on new vehicle and property registrations suggests parts of the UAE’s consumer economy are cooling from exceptional prior-year growth rates, even if not contracting (Arabian Business).
- Global AI valuation correction spillover: as with other major financial centers, UAE sovereign funds carry meaningful exposure to global equity markets, including AI-related names that regulators elsewhere have flagged as a concentration risk.
Key Takeaways
- The UAE recorded the world’s highest net millionaire inflow in 2025 and Dubai’s economy grew 2.4% in Q1 2026 despite regional conflict.
- Sovereign wealth institutions (ADIA, Mubadala, ADQ, ICD) give the UAE a net asset position near 184% of GDP, its core buffer against geopolitical shocks.
- S&P has reaffirmed a stable AA/A-1+ sovereign rating, citing fiscal buffers and banking sector resilience.
- Early-conflict disruption (jet charter spikes, occupancy dips) proved short-lived; DIFC activity and equity indices have both strengthened.
- Non-oil GDP diversification, now at roughly 75%, is the structural reason the UAE decouples from pure oil-price and conflict-headline risk.
Sources: S&P/Gulf News UAE Resilience Analysis, Xinhua/UAE Central Bank, Tap Fiscal UAE Economic Outlook 2026, Central Bank of the UAE Quarterly Economic Review, March 2026, Gateway Group UAE Weekly Business News, Arabian Business
Discover more from The Economy
Subscribe to get the latest posts sent to your email.

Gulf Capital Retreat From Pakistan 2026: UAE Loan Freeze & What It Means

Pakistan’s Most Reliable Export Is Its People: Remittances Hit $41.6 Billion, Overtaking Total Exports

Indonesia’s Confidence Problem: Record Investment, a Sinking Rupiah, and a Widening Credibility Gap

Down But Not Out: Inside the Slow Sinking of Russia’s War Economy

China’s Growth Slips to a Four-Year Low: Why Beijing Still Won’t Pull the Stimulus Trigger

The Johor-Singapore Corridor: How Malaysia Became Southeast Asia’s AI Infrastructure Powerhouse

Canada’s Economy ‘On Pause’: Inside the CUSMA Deadline That Passed Without a Deal

Dubai’s Millionaire Magnet: How the UAE Turned Middle East Turmoil Into a Capital Safe-Haven Boom

Britain’s Sixth Prime Minister in a Decade: What Starmer’s Exit Means for Gilts, Sterling and Your Portfolio

Anthropic Offers Up to $600,000 Salary for Critical IPO Role as AI Giant Prepares for Wall Street Debut

EU Readies Crisis Team for Potential China Rare Earths Stand-Off as Supply Chain Risks Mount

Singapore Weighs Hedge Fund Tax Cuts to Counter Hong Kong’s Growing Financial Challenge

Facebook and Instagram Experience Global Outage

Inside the $1 Billion Tap-to-Pay Fraud Rings Targeting Banks and Retailers

Carry Trade Unwind 2026: How the Yen’s Snapback Triggered a Global Margin Call

AI Bubble Warning 2026: Why BIS, IMF and Bank of England Fear a Market Crash

Male Labor Force Participation Rate 2026: Why Men Are Leaving & Economic Impact

BRICS De‑Dollarization Strategy Takes Shape with $15 Billion Local‑Currency Push

Russia Bans Diesel Exports 2026: Global Fuel Market Impact Explained

The AI Super Bubble Is Ready to Burst

Strait of Hormuz Blockade 2026: Oil Prices Surge 9% as US-Iran Conflict Reignites

IMF Cuts Pakistan Growth Forecast, Raises Inflation to 8.4%

Private Credit Warning: Most BDCs Turn Unprofitable in 2026, Reuters Finds

India Economic Rise 2026: How the Subcontinent Toppled Japan
Gulf Capital Retreat From Pakistan 2026: UAE Loan Freeze & What It Means

Bitcoin $150k Milestone Achieved as US Sovereign Crypto Pivot Looms

Strait of Hormuz 2026: Why Markets Still Don’t Trust It’s Open

Chipmakers Just Lost 6.7% in Two Days: Inside the Great AI Trade Rotation
-

 Markets & Finance7 months ago
Top 15 Stocks for Investment in 2026 in PSX: Your Complete Guide to Pakistan’s Best Investment Opportunities
-

 Analysis5 months ago
Johor’s Investment Boom: The Hidden Costs Behind Malaysia’s Most Ambitious Economic Surge
-

 Analysis5 months ago
Top 10 Stocks for Investment in PSX for Quick Returns in 2026
-

 Analysis6 months ago
Brazil’s Rare Earth Race: US, EU, and China Compete for Critical Minerals as Tensions Rise
-

 Banks6 months ago
Best Investments in Pakistan 2026: Top 10 Low-Price Shares and Long-Term Picks for the PSX
-

 Investment7 months ago
Top 10 Mutual Fund Managers in Pakistan for Investment in 2026: A Comprehensive Guide for Optimal Returns
-

 Global Economy7 months ago
15 Most Lucrative Sectors for Investment in Pakistan: A 2025 Data-Driven Analysis
-

 Global Economy7 months ago
Pakistan’s Export Goldmine: 10 Game-Changing Markets Where Pakistani Businesses Are Winning Big in 2025