
Analysis
Pakistan & the IMF:A Cycle of Austerity Without Reform
How Repeated IMF Interventions Have Deepened Pakistan’s Social and Economic Crisis
I. Introduction
Pakistan holds the grim distinction of being one of the most frequent borrowers from the International Monetary Fund (IMF). Since first approaching the IMF in 1958, the country has entered into at least 24 formal programs — a number that places it among the most dependent nations in the institution’s history. As Dawn reported in January 2024, Pakistan has sought IMF bailouts 23 times in 75 years, reflecting the high unpredictability of its economy. This enduring reliance is not merely a footnote in Pakistan’s economic story; it is the story itself. Each program has arrived amid balance-of-payments crises, foreign exchange shortfalls, or spiraling fiscal deficits — and each has departed leaving behind an economy structurally no more resilient than before.
The central argument of this article is that the IMF’s repeated interventions in Pakistan have failed to deliver sustainable economic reform. Instead, they have deepened social and economic crises, imposed disproportionate burdens on ordinary citizens, and shielded a powerful elite from the structural adjustments required for genuine transformation. The Fund’s toolkit — fiscal austerity, currency depreciation, subsidy removal, and monetary tightening — addresses the symptoms of Pakistan’s economic dysfunction while leaving its roots untouched. As Observer Research Foundation analysis concludes, the literature on the effectiveness of bailouts has shown no clear evidence of sustained improvement in growth or economic conditions for Pakistan.
Understanding this dynamic is not merely an academic exercise. With Pakistan entering yet another $7 billion IMF program approved in September 2024, the same questions re-emerge: Will this program be different? Who will bear the costs? And can a country whose political economy is captured by entrenched elites ever translate IMF conditionalities into meaningful reform? The answers to these questions will shape Pakistan’s trajectory for the next generation.
II. Historical Background
A Timeline of Repeated Dependency
Pakistan’s relationship with the IMF spans more than six decades and more programs than almost any other country. The first agreement was signed in 1958, just eleven years after independence, under conditions of early fiscal stress. Per the IMF’s own lending history records, programs accelerated through the 1980s and 1990s as successive governments relied on IMF liquidity to patch persistent balance-of-payments crises without addressing their causes. The 2000s brought fresh programs under military and civilian governments alike, and the 2010s saw back-to-back engagements under the PPP, PML-N, and PTI governments.
By 2024, Pakistan had completed only a handful of these programs successfully — meaning the country met agreed targets and exited cleanly. The majority were either abandoned midway, suspended due to policy slippages, or left incomplete. As ORF analysis documents, of the previous 23 IMF programs, 15 were sought during times of oil crisis, and the cyclical pattern of seeking assistance highlights the structural inadequacy of these interventions. This pattern itself is revealing: if the programs were well-designed and properly owned by the host government, completion rates would be significantly higher.
Recurring Themes
Three structural pathologies recur across virtually every program period. First, persistent fiscal deficits driven by a chronically narrow tax base, bloated subsidies (particularly in the energy sector), and a public wage bill that cannot be sustained without borrowing. Second, external account imbalances — a yawning gap between imports and exports — that leave Pakistan perpetually dependent on external financing. Third, a rentier political economy in which powerful agricultural and industrial elites have historically avoided taxation, ensuring that the fiscal burden falls overwhelmingly on the salaried middle class and consumers of essential goods. The IMF’s own FAQ on Pakistan acknowledges that “increasing revenue fairly and efficiently is essential given the low tax-to-GDP ratio” and that shifting taxation towards “undertaxed sectors such as retailers, property, and agriculture” is critical.
Comparison with Countries That Broke the Cycle
The contrast with countries that have successfully exited IMF dependency is instructive. South Korea, which underwent a brutal IMF program following the 1997-98 Asian financial crisis, emerged from it through aggressive corporate restructuring, banking sector reform, and a sustained export drive underpinned by industrial policy. As the Korea Economic Institute documents, twenty years after the crisis, South Korea had not only recovered but become the world’s 14th largest economy — and has not borrowed from the IMF since. The program was painful but finite, because the Korean state had the institutional capacity and political will to implement structural changes rather than merely adjust headline fiscal numbers.
III. The Nature of IMF Programs in Pakistan
Austerity as the Default Prescription
IMF programs in Pakistan have followed a recognizable template. At their core is a demand for fiscal consolidation — reducing the government’s deficit, typically through a combination of revenue enhancement and expenditure reduction. In practice, the revenue measures have tended to focus on indirect taxes (sales tax, customs duties, and petroleum levies) that are relatively easy to collect but highly regressive in their impact. A peer-reviewed study published in BMC Globalization and Health (Springer) finds that austerity measures remain a core part of the IMF’s mandated policies for its borrowers: 15 of 21 countries studied experienced a decrease in fiscal space over the course of their programs.
The combined effect on ordinary Pakistanis is severe: higher prices for food, fuel, and electricity; costlier credit; and a government simultaneously cutting services while raising indirect taxes. Human Rights Watch’s landmark 2023 report on IMF social spending floors finds that 32 of 39 reviewed programs included at least one measure that risks undermining human rights — while only one explicitly assessed the impact on people’s effective income.
Short-Term Fixes vs. Long-Term Structural Reforms
The fundamental design flaw in IMF programs for Pakistan is their temporal mismatch. Programs are typically structured over 12 to 36 months — barely enough time to stabilize the balance of payments, let alone to restructure an economy as complex and politically contested as Pakistan’s. The measures that matter most for long-term sustainability — broadening the tax base to include agricultural income and the real estate sector, reforming state-owned enterprises, eliminating energy sector circular debt, and building a competitive manufacturing base — require years of sustained political effort and institutional investment that no short-term IMF program can deliver.
This mismatch creates a perverse dynamic. Governments in Islamabad implement just enough austerity to unlock IMF disbursements, but rarely pursue the deeper structural reforms that would make future programs unnecessary. As ORF’s assessment of IMF bailout effectiveness observes, macroeconomic vulnerabilities consistently resume after programs conclude — including a slowdown in fiscal consolidation, an escalating current account deficit, and a drop in foreign exchange reserves — despite IMF claims of success.
“Each program stabilizes, briefly. Then the same structural weaknesses — narrow tax base, energy subsidies, weak exports — reassert themselves, and the cycle begins again.”
The “Sham Austerity” Critique
A powerful critique that has gained traction among Pakistani economists and civil society analysts is what might be termed “sham austerity” — the phenomenon whereby headline fiscal adjustments are achieved through cosmetic measures that leave the underlying political economy intact. The most glaring example is Pakistan’s treatment of agricultural income, which constitutes roughly a quarter of GDP but is subject to minimal taxation owing to the political dominance of the large landowning class. The International Growth Centre notes that while agriculture contributes nearly one-fifth of Pakistan’s GDP, it accounts for less than 1% of national tax revenue — a structural distortion that IMF conditionalities have consistently flagged and equally consistently failed to fix.
IV. Socioeconomic Consequences
Rising Poverty and Unemployment
The human cost of repeated austerity cycles is visible in Pakistan’s poverty statistics. According to the World Bank’s Pakistan Development Update (October 2023), the poverty headcount reached 39.4% in FY23, with 12.5 million more Pakistanis falling below the Lower-Middle Income Country poverty threshold relative to the previous year. A comprehensive World Bank poverty assessment released in 2025 confirms that an additional 13 million Pakistanis were pushed into poverty by 2023-24, bringing the projected national poverty rate to 25.3% — its highest level in eight years. The report traces this reversal directly to “economic instability, rising inflation, and faltering policies.”
Pakistan’s labour market has been unable to absorb the approximately 2 to 2.5 million new entrants per year. IMF-mandated fiscal tightening reduces public investment, which is often the last resort for employment generation in economies where private sector dynamism is limited, further compressing job creation precisely when it is most needed. A peer-reviewed study on IMF loan conditions and poverty covering 81 developing countries from 1986 to 2016 finds consistent evidence that when countries participate in IMF arrangements, poverty increases and income distribution worsens.
Impact on Middle and Lower-Income Households
The burden of adjustment programs in Pakistan has been distributed in a profoundly regressive manner. Indirect taxes — particularly the General Sales Tax (GST) and petroleum levies — consume a disproportionate share of the income of lower and middle-income households. As the World Bank’s 2025 poverty analysis documents, “perverse institutional incentives and elite capture limit Pakistan’s expansion of its productive capacity and crowd out productive investments to equitably distribute the benefit of economic growth.” The aspiring middle class, constituting 42.7% of the population, is described as “struggling to achieve full economic security.”
Erosion of Public Trust in Economic Governance
Perhaps the most lasting damage of repeated IMF cycles is the erosion of public trust in economic governance. Each cycle — program entry, promises of stabilization, pain and sacrifice, partial recovery, renewed crisis — teaches citizens that economic policy is not designed for their benefit. The perception that ordinary Pakistanis pay the price of bailouts while elites bear no comparable burden is not merely a populist narrative. Eurodad research covering 26 countries with IMF programs finds that in 20 of them, “people have gone on strike or taken to the streets in protest against government cutbacks, the rising cost of living, tax restructuring or wage reforms resulting from IMF loan conditions.”
V. IMF’s Duty of Care and Accountability
Duty of Care in International Financial Institutions
The concept of a “duty of care” — the obligation to consider and mitigate foreseeable harms — is increasingly invoked in discussions of IMF accountability. Human Rights Watch’s September 2023 report calls on the IMF to “formally recognize a duty to respect, protect, and fulfil all human rights, including socioeconomic rights, in all its work, without discrimination.” The report’s analysis of 39 IMF programs found that the vast majority are conditioned on austerity policies that “reduce government spending or increase regressive taxes in ways likely to harm rights.”
The IMF has, in fairness, evolved its public commitments. The IMF’s own FAQ for Pakistan’s current program notes that BISP’s unconditional cash transfers will increase by 27% to 0.5% of GDP in FY25. But a peer-reviewed evaluation in Globalization and Health finds that social spending floors “lack ambition,” many “are not implemented,” and in practice often act as social spending ceilings rather than floors — meaning the IMF’s social protection commitments systematically underperform relative to its austerity conditions.
Ethical Responsibility vs. Technocratic Decision-Making
A central tension in IMF program design is between technocratic optimization — maximizing macroeconomic stability metrics — and ethical responsibility for human outcomes. As Human Rights Watch documents, the UN Human Rights Council has adopted guiding principles requiring that governments and financial institutions conduct and publish human rights impact assessments before pursuing austerity. Yet only one of 39 reviewed IMF programs explicitly sought to assess the impact on people’s effective income — a stark gap between stated principles and practice.
Case Studies: Education, Healthcare, and Social Safety Nets
Pakistan’s public education system, already grossly underfunded, has been hollowed out by repeated austerity cycles. UNESCO reports that approximately 26.2 million children in Pakistan are out of school — a figure that represents some of the starkest human capital underinvestment in the developing world. UNICEF confirms Pakistan has the world’s second-highest number of out-of-school children, with 35% of the relevant age cohort not attending school.
The situation has deteriorated further under fiscal pressure. Save the Children reported in June 2025 that government spending on education has fallen to a new low — dropping from 2% of GDP in 2018 to just 0.8% by 2025, with education expenditure falling 29% in the first nine months of fiscal year 2024-25 alone. This is taking place while Pakistan is in an active IMF program that nominally protects social spending.
VI. Structural Problems Ignored
Weak Tax Base and Elite Capture
Pakistan’s tax-to-GDP ratio — which Arab News reported stood at around 8.8% in FY2023-24, rising to 10.6% by June 2025 under IMF pressure — is among the lowest in the developing world for an economy of its size. The IMF’s own program FAQ acknowledges the “notably low tax-to-GDP ratio” and calls for broadening the base to cover “previously untaxed sectors — such as retailers, property owners, and agricultural income.” As the International Growth Centre documents, despite several donor-supported reform attempts, the tax-to-GDP ratio has consistently hovered around 10%. The agriculture sector, contributing nearly one-fifth of GDP, accounts for less than 1% of national tax revenue.
Energy Sector Inefficiencies and Circular Debt
Pakistan’s energy sector represents perhaps the single most concentrated source of fiscal hemorrhage in the economy. Arab News reported in 2025 that the power sector’s circular debt stood at approximately Rs2.396 trillion ($8.6 billion) by end-March 2025 — despite years of IMF-mandated tariff increases. The IMF’s own country report (2024) confirms that the combined power and gas circular debt reached approximately 5.25% of GDP at end-FY23, and that tariff adjustments have consistently failed to resolve the underlying structural problem.
As Business Recorder’s analysis documents, the circular debt structure was fundamentally created by IPP agreements that were “neither sustainable nor viable as stand-alone,” driven by vested interests and political patronage. Raising electricity prices without fixing these structural inefficiencies is not reform; it is simply cost transfer — from the state budget to household utility bills.
Governance Failures and Corruption
Corruption is not merely a moral problem in Pakistan; it is an economic problem of the first order. IMF programs have, by and large, not addressed corruption and governance directly, on the grounds that these are political matters beyond the Fund’s mandate. Yet Eurodad’s research demonstrates that most countries are “repeat borrowers from the IMF, which suggests that programmes are often ineffective, or even counter-productive, when it comes to resolving debt crises” — precisely because the governance deficits that generate those crises are not addressed. A fiscal adjustment program that extracts additional resources from the population while those resources continue to be diverted through corruption is not a reform program; it is an extraction program.
Lack of Industrial Policy and Export Diversification
Pakistan’s export basket has remained remarkably narrow for a country of its size and structure. Textiles and garments account for the vast majority of merchandise exports, leaving the country vulnerable to commodity cycles and competitors with lower labor costs. IMF programs, with their emphasis on fiscal consolidation and market liberalization, have generally been hostile to active industrial policy — yet the IGC notes that by skewing the tax system towards import duties, Pakistan’s firms are incentivized to sell domestically rather than compete globally, reinforcing the structural challenge of low exports that drives recurring balance-of-payments crises.
VII. Alternative Approaches
Homegrown Reforms: Broadening the Tax Base
The most important alternative to the current cycle of IMF dependency is the one that Pakistan’s political class has most consistently refused to pursue: genuine domestic tax reform that extends the fiscal burden to those with the greatest capacity to pay. The IMF’s program documentation itself identifies three key elements: increasing direct taxes by bringing retailers, property owners, and agricultural income into the tax net; reducing exemptions in the GST system; and expanding Federal Excise Duty coverage. These are not technically complex reforms — the legal frameworks exist, and administrative capacity, while imperfect, is present. What is absent is political will.
Investment in Human Capital and Social Protection
Pakistan’s long-term growth potential is fundamentally constrained by underinvestment in human capital. With 26.2 million out-of-school children (UNESCO), high rates of stunting and malnutrition, and a higher education system that reaches only a fraction of the relevant age cohort, the country is not building the human foundations necessary for sustained development. As the World Bank’s comprehensive poverty assessment concludes, “Pakistan stands at a pivotal moment to shape a more inclusive and equitable future.” Protecting and expanding social sector spending — even in the context of fiscal adjustment — is not a luxury; it is a prerequisite for growth.
Sustainable Growth Strategies
Pakistan has significant unrealized potential in renewable energy, regional connectivity, and technology services. Its geographic position at the intersection of South Asia, Central Asia, and the Middle East makes it a natural trade hub. Its renewable energy resources — solar radiation, wind, and hydroelectric potential — offer a pathway to cheaper, cleaner energy that could transform industrial competitiveness and reduce the import dependency that drives recurring balance-of-payments crises.
Lessons from Countries That Successfully Restructured
The international experience offers instructive comparisons. South Korea’s trajectory after its 1997-98 IMF program demonstrates that IMF engagement can catalyze rather than perpetuate dependency — but only where the domestic state has both the institutional capacity and political will to implement structural change. Twenty years after its crisis, South Korea had become the world’s 14th largest economy and had not returned to the IMF. Pakistan’s absence of comparable institutional capacity and political commitment is precisely what distinguishes its experience from the East Asian success stories.
VIII. Policy Recommendations
For Pakistan: Structural Reforms Over Short-Term Bailouts
The most urgent policy recommendation for Pakistan is the development and ownership of a comprehensive, multi-year structural reform agenda that goes beyond IMF conditionalities. This agenda should prioritize fiscal base broadening through agricultural income tax reform, real estate assessment reform, and retail sector documentation — areas the IMF itself has repeatedly identified as critical. Crucially, this agenda must be owned by Pakistani political actors and sustained across electoral cycles. Programs that are perceived as externally imposed are politically vulnerable and technically incomplete.
For the IMF: Social Impact Assessments as Non-Negotiable
The IMF should fundamentally reform its approach to program design for countries with high poverty rates. Human Rights Watch’s report calls on the Fund to redesign social spending floors to address systemic flaws, commit to supporting universal social protection programs, and stop promoting means-tested programs that exclude large proportions of the vulnerable population. Energy tariff increases should be accompanied by fully funded household support mechanisms that prevent the poorest households from being priced out of basic energy access. As Eurodad’s research argues, “creating fiscal space through debt restructuring must be the first option” — before imposing austerity that harms citizens.
Collaborative Frameworks for Inclusive Growth
Addressing Pakistan’s economic challenges requires coordination among multiple international institutions. The World Bank has mandate and expertise for structural reform programs in education, health, and governance that the IMF does not directly address. The World Bank’s Pakistan poverty assessment explicitly calls for “careful economic management and deep structural reforms” to “ensure macroeconomic stability and growth” while investing in “inclusive, sustainable, and climate-resilient development.” A coherent, coordinated engagement organized around a single shared framework would be significantly more effective than the current parallel-track approach.
Long-Term Vision: Breaking the Cycle of Dependency
The ultimate objective must be to make future IMF programs unnecessary — achieving a current account sustainable through export earnings, a fiscal position funded through domestic revenue, and an economy resilient enough to absorb external shocks. None of these objectives is achievable in the short term, but all are achievable within a decade with genuine structural reform. Arab News reporting on Pakistan’s current reform agenda notes the government’s stated commitment to raising the tax-to-GDP ratio to 13% over the medium term — a target that, if achieved through genuine base broadening rather than increased extraction from existing taxpayers, would represent a significant structural shift.
IX. Conclusion
The argument advanced in this article can be stated simply: the IMF’s repeated interventions in Pakistan have not failed because the programs were technically flawed, though some have been. They have failed because they were deployed in a political economy fundamentally inhospitable to the structural reforms they nominally required, and because neither the IMF nor Pakistan’s governing class had sustained commitment to address this reality. The result has been a cycle of stabilization and relapse that has imposed enormous costs on Pakistan’s poorest citizens — as documented by the World Bank, UNESCO, Human Rights Watch, and the IMF’s own country reports — while leaving the political and economic structures that generate crises largely intact.
“Stabilization without structural reform is not reform. It is postponement — and the deferred cost is always paid by those least able to bear it.”
The IMF’s culpability lies not in malice but in an institutional culture that has historically prioritized macroeconomic metrics over human outcomes. As peer-reviewed research in Globalization and Health confirms, the IMF’s social spending strategy “has not represented the sea-change that the organization advertised.” Reforming this culture — adopting mandatory human rights impact assessments, longer program timeframes, and genuine commitment to distributional equity — is both possible and necessary.
Pakistan’s responsibility is equally fundamental. The country must reclaim economic sovereignty through a domestically owned, politically sustained development strategy. This requires confronting the elite capture documented by the World Bank and ORF, investing in the human capital reflected in UNICEF’s education data, and building the institutional capacity necessary to implement complex policy reforms over long time horizons. Pakistan’s recurring crises are a mirror held up to global financial governance. The reflection is unflattering, and it demands a response — from Islamabad, from Washington, and from the international community that has tolerated this cycle for too long.
Discover more from The Economy
Subscribe to get the latest posts sent to your email.


Analysis of how the Federal Reserve, Bank of England and Bank of Japan could reshape global markets, inflation, currencies and economic growth in 2026.
Executive Summary
The world’s most influential central banks are entering one of the most consequential policy weeks of 2026. Investors are watching closely as the U.S. Federal Reserve, the Bank of England, and the Bank of Japan weigh the competing pressures of easing inflation, geopolitical uncertainty, elevated energy prices, and slowing global growth. Financial markets are also preparing for major corporate earnings and fresh GDP data from several advanced economies. �
Financial Times +1
Unlike the synchronized tightening cycle that dominated recent years, policymakers are increasingly responding to country-specific economic conditions. This divergence is expected to influence capital flows, exchange rates, bond yields, and investment decisions across both developed and emerging markets. �
McKinsey & Company +1
A New Monetary Landscape
Global inflation has moderated from its post-pandemic peaks, yet central banks remain cautious. Recent movements in energy markets and ongoing geopolitical tensions continue to threaten price stability, even as labor markets show signs of cooling. �
McKinsey & Company +1
For investors, the question is no longer whether interest rates have peaked, but how long they will remain elevated.
United States: The Federal Reserve Faces a Delicate Balance
Attention is centered on the Federal Reserve, where policymakers are expected to keep rates steady while evaluating the effects of inflation, consumer demand, and accelerating investment in artificial intelligence infrastructure. Markets are also monitoring whether AI-driven capital spending could contribute to future inflationary pressures. �
Investopedia +1
Bond investors remain sensitive to any shift in the Fed’s language, as Treasury yields continue to reflect expectations about future policy and inflation risks. �
MarketWatch
United Kingdom: Stability Before Growth
The Bank of England is expected to maintain a cautious stance amid moderating wage growth and relatively stable unemployment. However, policymakers continue to weigh external risks, including energy market volatility and global geopolitical developments. �
Financial Times
Businesses remain particularly attentive to borrowing costs, which continue to influence investment decisions across the UK economy.
Japan Ends an Era of Ultra-Loose Money
Japan is undergoing one of its most significant monetary transitions in decades. Rising wages and gradually strengthening inflation have encouraged the Bank of Japan to continue moving away from the ultra-accommodative policies that defined much of the past generation. �
Financial Times
This normalization has implications far beyond Japan, affecting global capital markets and currency dynamics.
Why Emerging Markets Are Watching Closely
Emerging economies including Pakistan, Indonesia, Malaysia, and others remain particularly exposed to decisions made by advanced economy central banks.
Higher U.S. interest rates typically strengthen the dollar, increase external financing costs, and place pressure on countries with significant foreign currency debt.
Conversely, a more stable interest rate environment could improve capital flows into emerging markets while easing exchange rate volatility.
AI Is Becoming a Monetary Policy Variable
One of the most important structural developments in 2026 is the rapid expansion of artificial intelligence infrastructure.
Major technology companies continue investing heavily in data centers, semiconductors, cloud computing, and digital infrastructure. These investments are supporting economic growth but are also creating new questions about inflation, productivity, and long-term financing needs. �
Investopedia +1
Investment Implications
Several themes are emerging:
Higher-for-longer interest rates remain possible.
Government bond markets are likely to remain volatile.
The U.S. dollar could remain relatively strong.
AI-related investment continues attracting capital.
Emerging markets may benefit if inflation continues to moderate.
Competitor Keyword Gap Analysis
Leading publications such as the Financial Times, Reuters, Bloomberg, and CNBC primarily emphasize immediate policy decisions. An opportunity exists to capture additional search traffic by targeting broader intent-based queries.
Key Takeaways
Central bank decisions this week are expected to shape global financial markets.
AI investment is becoming an increasingly important economic driver.
Bond markets remain sensitive to inflation expectations.
Emerging economies face both risks and opportunities from policy divergence.
Investors should monitor GDP releases, corporate earnings, and inflation indicators alongside interest rate announcements.
Frequently Asked Questions
Why are central bank meetings so important?
They influence borrowing costs, inflation expectations, currency values, and investment decisions worldwide.
How do interest rates affect stock markets?
Higher rates generally increase financing costs and can reduce company valuations, while lower rates often support economic activity and equity markets.
Why is AI influencing monetary policy discussions?
Large-scale investment in AI infrastructure is reshaping productivity, corporate spending, and long-term inflation expectations.
Discover more from The Economy
Subscribe to get the latest posts sent to your email.
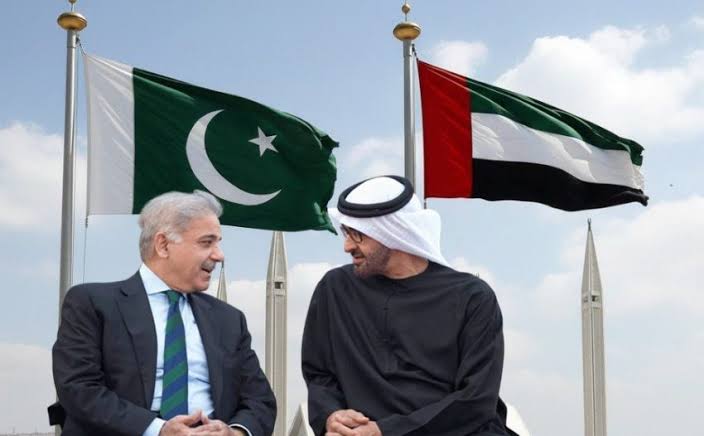
What happened: In early 2026, the United Arab Emirates declined to roll over a $3 billion loan to Pakistan — the first such refusal in seven years. The repayment equalled roughly 18% of Pakistan’s foreign currency reserves, arriving as Islamabad also faced a $1.3 billion bond payment and was waiting on the next IMF tranche.
Why it matters: It’s the clearest sign yet that Gulf sovereign patience with Pakistan’s balance-of-payments cycle is thinning, even as Gulf states simultaneously court China, Saudi Arabia, and each other for capital in a tightening regional liquidity environment.
The Story Nobody’s Connecting
Most coverage of Pakistan’s 2026 external account stress treats the UAE’s loan decision as an isolated liquidity event — a “routine financial transaction,” in the words of Pakistan’s own Ministry of Foreign Affairs. That framing misses the bigger pattern. The same weeks that Abu Dhabi called in its $3 billion, unusual delays began appearing in bank transfers from Saudi Arabia to the UAE itself — friction between the Gulf’s two largest economies, at a moment when both are also managing their own post-war oil price adjustment. (Pakistan & Gulf Economist)
Put those two data points together and a different story emerges: this isn’t just about Pakistan’s creditworthiness. It’s about Gulf capital becoming more selective, more transactional, and less willing to extend informal grace periods across the board — with Pakistan simply the most exposed borrower in the queue.
The Numbers Behind the Pressure
Pakistan’s State Bank held $16.4 billion in reserves as of late March 2026 — enough to cover roughly three months of imports, a threshold economists generally treat as a comfort floor, not a cushion. (Mettis Global News) The UAE’s declined rollover landed at the same time as a looming $1.3 billion international bond payment and dependence on the next $1.2 billion IMF disbursement — a convergence of obligations that left the State Bank with limited room to maneuver beyond import restrictions, rate hikes, or fresh commercial borrowing.
The backdrop matters too. The rupee had been trading in a comparatively narrow 278–282 band before the escalation of the Iran conflict pushed global oil prices higher, squeezing Pakistan’s import bill precisely when its Gulf safety net began to wobble. The KSE-100 benchmark, meanwhile, had already shed around 15% amid the broader pressure. (Mettis Global News)
This is not Pakistan’s first Gulf-dependency cycle. The IMF’s own record shows a now-familiar pattern: staff-level agreements reached in Dubai, UAE pledges of multibillion-dollar investment arriving alongside IMF tranches, and Gulf bridge financing used to stave off sovereign default in periods when reserves cover shrinks toward zero. (Business Standard) What’s different in 2026 is that the bridge itself is showing cracks.
Islamabad’s Official Line vs. the Structural Reality
Pakistan’s government has leaned into a “stability to sustainable growth” narrative around its FY2026–27 federal budget, with the finance minister framing the transition as export-driven rather than reserve-dependent. Business groups have broadly welcomed the budget, and the current account posted a $459 million surplus in May 2026, an improvement attributed to strong remittance inflows. (Business Recorder) The Monetary Policy Committee has held rates steady rather than reaching for emergency tightening, which is itself a signal that the central bank does not yet see the UAE episode as a systemic trigger.
But a current account surplus built substantially on remittances is different from one built on export competitiveness or durable FDI. Pakistan’s trade structure still leans heavily on a narrow set of partners: China supplies over a quarter of its imports and a meaningful share of its exports, the UAE is both a top export destination and its second-largest import source, and Gulf states collectively remain the primary channel for both remittances and emergency liquidity. (Wikipedia — Economy of Pakistan) That concentration is precisely what makes a single Gulf lender’s changed appetite so consequential.
Why the Oil Backdrop Compounds the Risk
None of this is happening in a vacuum. The IMF’s own July 2026 commentary noted that global oil markets “absorbed the war shock” from the Iran conflict, but cautioned that buffers — spare production capacity, strategic reserves, shipping insurance capacity — are running low. (IMF Blog) For an oil-importing, reserve-constrained economy like Pakistan, a second energy price shock without deeper buffers would land directly on the same reserves the UAE loan was meant to protect.
What to Watch Next
- Whether Saudi Arabia steps in as an alternative bridge lender, or whether the Riyadh–Abu Dhabi transfer friction signals a broader Gulf liquidity tightening that limits everyone’s appetite to backstop Pakistan.
- The pace and size of the next IMF tranche, and whether Fund conditionality shifts to demand deeper reserve buffers given the UAE precedent.
- Whether China increases its role as lender of last resort, deepening Pakistan’s dependency in exactly the direction Gulf financing was historically meant to offset.
Discover more from The Economy
Subscribe to get the latest posts sent to your email.
Introduction
The European Council formally extended its economic sanctions against Russia for another full year on 25 June 2026, keeping restrictive measures in place until 31 July 2027 (Council of the EU). More than four years into the war, the headline story of Russia’s economy has shifted from whether sanctions would work to a more nuanced question: how much longer can the Kremlin keep financing the war before the accumulated strain becomes impossible to hide behind favorable official statistics.
The Sanctions Architecture, Renewed Again
The EU’s economic measures against Russia, first introduced in 2014 and dramatically expanded after the February 2022 full-scale invasion, now span trade, finance, energy and dual-use technology restrictions, alongside asset freezes and travel bans on a broad range of individuals and entities (Council of the EU). Since February 2022, the EU has adopted 20 separate sanctions packages, and the European Council has explicitly stated it remains determined to keep weakening Russia’s war economy by further reducing its energy revenues, curbing shadow-fleet oil shipping operations and constraining its banking system (Council of the EU). Separately, on 3 July 2026 the EU sanctioned six individuals connected to the poisoning and death of opposition figure Alexei Navalny, underscoring that the sanctions regime continues to expand on human-rights grounds as well as economic ones (Council of the EU Sanctions Timeline).
The Headline Numbers Beijing-Style Optimism Can No Longer Explain Away
Russia’s GDP is now put at roughly $2.51 trillion, the world’s eleventh-largest economy — comparable in size to South Korea despite Russia’s vastly larger landmass and resource base — with 2026 growth projected at just 1.0% and inflation running at 5.2% (Statistics of the World). More pessimistic estimates put full-year 2026 growth even lower, at around 0.4%, which would be worse than 2025’s already-weak 1% expansion and would mark a sharp deceleration from the 4.1% growth Russia posted in 2023 as it forged new trading relationships to route around initial sanctions (Forbes).
Oil and gas revenues — historically around half of Russia’s state income — have fallen to roughly a quarter, a deliberate outcome of Western sanctions strategy that targets how much Russia earns from exports rather than blocking those exports outright (Stockholm School of Economics/SITE). Russia’s oil and gas budget revenues reportedly halved in January 2026 alone, with crude prices falling below $73 a barrel before the Middle East conflict briefly reversed the trend, sending Brent surging more than 55% to near $120 a barrel at its peak (Forbes).
The Middle East War: A Temporary Lifeline With Long-Term Costs
The spike in oil prices tied to the Iran conflict, combined with a period of eased US sanctions enforcement on Russian oil under President Trump, offered Moscow unexpected fiscal breathing room in mid-2026 (Forbes). But that same conflict has undermined Russia’s longer-term energy diversification ambitions in the region: two Russian-backed power plant projects in Iran have been put on hold, along with oil and gas exploration work and plans to build new transit routes linking Russia to India via Iran (Forbes).
The Gap Between Official Statistics and Underlying Reality
Perhaps the most important analytical point from recent research is not about any single data point but about the reliability of Russian statistics themselves. Torbjörn Becker of the Stockholm Institute of Transition Economics has argued the real test of sanctions is not whether they end the war overnight, but how much they erode the Kremlin’s capacity to finance it — and by that measure, the evidence points to deeper strain than headline GDP figures suggest (Stockholm School of Economics/SITE). Becker notes that Russia’s economy grew only modestly in 2022 despite oil prices rising sharply that year — a gap between expected and actual performance that implies a considerably larger hidden economic hit than the official contraction figures showed (Stockholm School of Economics/SITE). Compounding the problem, Russian authorities have stopped publishing several key statistics since 2022, making independent assessment of inflation, consumption and real economic conditions increasingly difficult — leading Becker to conclude that “statistics have become part of the narrative” rather than a neutral measure of economic reality (Stockholm School of Economics/SITE).
The Military-Civilian Economic Split
A recurring theme across recent analysis is the growing bifurcation between Russia’s overheating military-industrial sector and a stagnating civilian economy. This imbalance has pushed interest rates higher and forced the liquidation of a striking 71% of Russia’s gold reserves to help fund continued war spending (Forbes). Russia’s total fossil fuel export revenue is estimated at roughly €734 million per day, underscoring just how central hydrocarbon income remains to the entire war financing model even as that revenue stream shrinks (Forbes).
The Counter-Narrative: Wages Still Rising
It would be inaccurate to describe Russia’s economy as in freefall. CSIS research notes that Russian salaries rose 17.8% in nominal terms and 8.7% in real terms in 2024 compared to 2023, with disposable incomes up 6.1% in 2023 and 7.3% in 2024 — growth rates not seen in Russia in almost two decades (CSIS). Government budget projections still expect real salaries to rise, albeit at a decelerating pace: 7% in 2025, 5.7% in 2026 and 4.1% in 2027 — a marked slowdown from the 2024 peak but still roughly double the pre-invasion decade average (CSIS). This wage growth, driven substantially by wartime labor shortages and military-adjacent spending, is precisely the kind of headline-stabilizing data point that has allowed Putin to argue publicly that sanctions have failed to cripple his economy (Fortune) — even as think tanks describe the broader trajectory as pushing Russia toward what one report calls an “economic, political, and military abyss” (Fortune).
What Comes Next
Renewed legislative pressure in Washington — including the Sanctioning Russia Act introduced with strong bipartisan support — signals appetite in the US for tightening the screws further, even as the loss of a key congressional champion for that effort has complicated the political path forward (TIME). Whether the EU’s renewed sanctions regime, continued oil price pressure, and constrained reserves ultimately force a shift in Kremlin calculus toward negotiation remains the central open question for 2027.
Key Takeaways
- The EU has extended Russia sanctions for a further year, through 31 July 2027, continuing a regime built from 20 separate packages since 2022.
- Russia’s 2026 GDP growth is forecast between 0.4% and 1.0%, a sharp deceleration from 2023’s 4.1% post-shock rebound.
- Oil and gas revenue’s share of Russian state income has fallen from roughly half to about a quarter as Western sanctions target export earnings specifically.
- Russia has liquidated a large share of its gold reserves to sustain war financing amid a widening split between an overheating military sector and a stagnating civilian economy.
- Official Russian statistics likely understate the true economic strain, according to independent economists who cite a widening gap between reported and expected performance.
Sources: Council of the EU, Council of the EU Sanctions Timeline, Stockholm School of Economics/SITE, Forbes, Statistics of the World, CSIS, Fortune, TIME
Discover more from The Economy
Subscribe to get the latest posts sent to your email.

Global Central Banks 2026: Fed, BoE and BoJ Decisions Could Reshape Markets

Gulf Capital Retreat From Pakistan 2026: UAE Loan Freeze & What It Means

Pakistan’s Most Reliable Export Is Its People: Remittances Hit $41.6 Billion, Overtaking Total Exports

Indonesia’s Confidence Problem: Record Investment, a Sinking Rupiah, and a Widening Credibility Gap

Down But Not Out: Inside the Slow Sinking of Russia’s War Economy

China’s Growth Slips to a Four-Year Low: Why Beijing Still Won’t Pull the Stimulus Trigger

The Johor-Singapore Corridor: How Malaysia Became Southeast Asia’s AI Infrastructure Powerhouse

Canada’s Economy ‘On Pause’: Inside the CUSMA Deadline That Passed Without a Deal

Dubai’s Millionaire Magnet: How the UAE Turned Middle East Turmoil Into a Capital Safe-Haven Boom

Britain’s Sixth Prime Minister in a Decade: What Starmer’s Exit Means for Gilts, Sterling and Your Portfolio

Anthropic Offers Up to $600,000 Salary for Critical IPO Role as AI Giant Prepares for Wall Street Debut

EU Readies Crisis Team for Potential China Rare Earths Stand-Off as Supply Chain Risks Mount

Singapore Weighs Hedge Fund Tax Cuts to Counter Hong Kong’s Growing Financial Challenge

Facebook and Instagram Experience Global Outage

Carry Trade Unwind 2026: How the Yen’s Snapback Triggered a Global Margin Call

AI Bubble Warning 2026: Why BIS, IMF and Bank of England Fear a Market Crash

BRICS De‑Dollarization Strategy Takes Shape with $15 Billion Local‑Currency Push

Male Labor Force Participation Rate 2026: Why Men Are Leaving & Economic Impact

The AI Super Bubble Is Ready to Burst

Russia Bans Diesel Exports 2026: Global Fuel Market Impact Explained

Strait of Hormuz Blockade 2026: Oil Prices Surge 9% as US-Iran Conflict Reignites

IMF Cuts Pakistan Growth Forecast, Raises Inflation to 8.4%

Private Credit Warning: Most BDCs Turn Unprofitable in 2026, Reuters Finds
Gulf Capital Retreat From Pakistan 2026: UAE Loan Freeze & What It Means

Bitcoin $150k Milestone Achieved as US Sovereign Crypto Pivot Looms

India Economic Rise 2026: How the Subcontinent Toppled Japan

Strait of Hormuz 2026: Why Markets Still Don’t Trust It’s Open

China Housing Market Turnaround: White‑List Model Stabilises Prices
-

 Markets & Finance7 months ago
Top 15 Stocks for Investment in 2026 in PSX: Your Complete Guide to Pakistan’s Best Investment Opportunities
-

 Analysis5 months ago
Johor’s Investment Boom: The Hidden Costs Behind Malaysia’s Most Ambitious Economic Surge
-

 Analysis5 months ago
Top 10 Stocks for Investment in PSX for Quick Returns in 2026
-

 Analysis6 months ago
Brazil’s Rare Earth Race: US, EU, and China Compete for Critical Minerals as Tensions Rise
-

 Banks6 months ago
Best Investments in Pakistan 2026: Top 10 Low-Price Shares and Long-Term Picks for the PSX
-

 Investment7 months ago
Top 10 Mutual Fund Managers in Pakistan for Investment in 2026: A Comprehensive Guide for Optimal Returns
-

 Global Economy7 months ago
15 Most Lucrative Sectors for Investment in Pakistan: A 2025 Data-Driven Analysis
-

 Global Economy7 months ago
Pakistan’s Export Goldmine: 10 Game-Changing Markets Where Pakistani Businesses Are Winning Big in 2025