
Asia
Vladimir Putin’s Huge Windfall from the Iran War: Why the Sugar High May Not Last

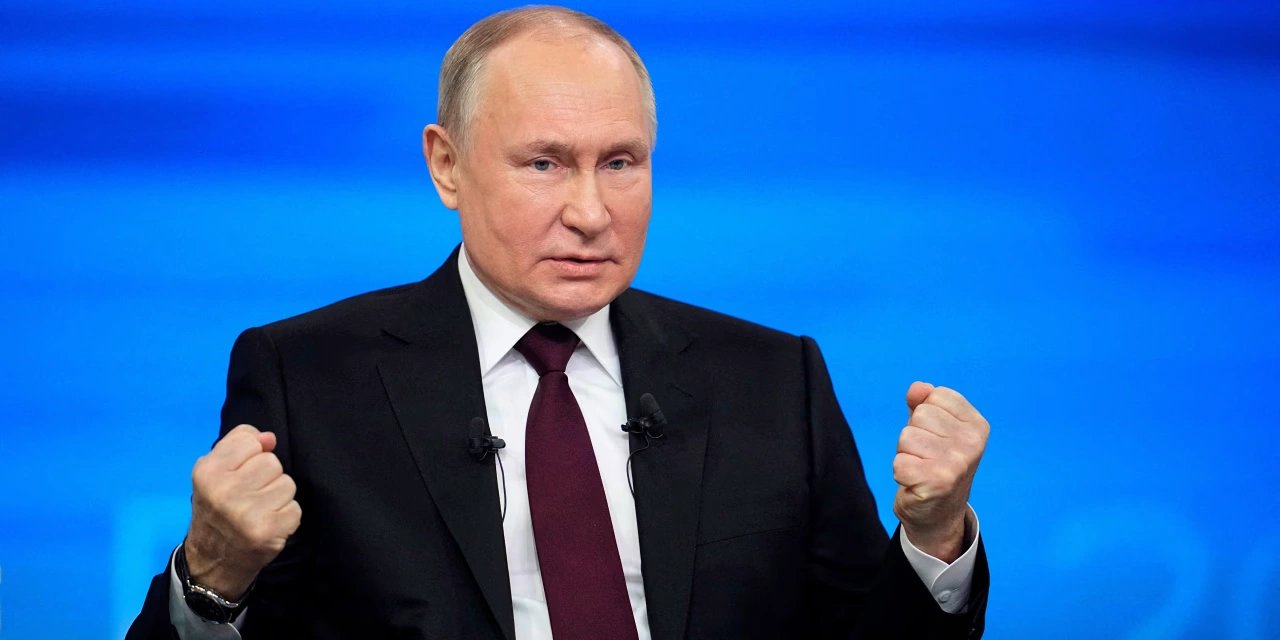
Russian oil prices have surged from $40 to over $100 a barrel in less than a fortnight. Vladimir Putin didn’t engineer this stroke of fortune — but he is quietly pocketing it. The question haunting energy desks from Houston to Mumbai is how long the party lasts.
The timing was almost cinematic. As missiles arced over the Strait of Hormuz in the opening days of March 2026 and Iranian crude abruptly vanished from global shipping lanes, the Kremlin’s oil accountants found themselves staring at spreadsheets they could scarcely believe. Urals crude price surge 2026 has become the phrase of the month in energy markets: in barely twelve days, Russia’s benchmark export blend climbed from a sanctions-depressed $40 per barrel to north of $100 — a trajectory that, as The Economist first reported, amounts to one of the most sudden revenue injections any petrostate has received since the invasion of Ukraine. Forbes calculates that every $10-per-barrel lift to Urals adds roughly $1.6 billion to Moscow’s monthly hydrocarbon revenues. Do the arithmetic on a $60 jump and the figure becomes staggering — and politically consequential in ways that extend far beyond the trading floor.
This is not a story Putin wrote. It is a story that was written for him.
The Sarah’s Midnight Pivot – How One Tanker Tells the Whole Story
On the evening of March 4, a Hong Kong-flagged vessel called the Sarah — twenty years old, unremarkable in every maritime register — completed a sharp course correction roughly 140 nautical miles southeast of Muscat. She had been loitering near the Omani coast for the better part of a week, waiting, as tanker-tracking analysts at Kpler and Vortexa now confirm, for a cargo assignment that kept shifting. When the assignment finally arrived, it was not the consignment of Middle Eastern crude her manifest had vaguely suggested. It was Russian Urals, loaded at Primorsk, bound for an Indian refinery on the west coast of Gujarat.
The Sarah is, in miniature, the entire geopolitical drama of this moment. She is part of what the industry calls the shadow fleet Russian crude network — a loose armada of ageing, often inadequately insured tankers assembled after Western majors abandoned Russian oil routes in 2022. Under normal conditions, this fleet operates at a discount, moving barrels that Western sanctions have rendered toxic to mainstream shipping and insurance markets. Under the conditions prevailing in early March 2026, it is operating at something close to a premium. With Iranian supply suddenly off the table and Brent lurching above $120, even the Sarah‘s unconventional provenance and patchy insurance history ceased to trouble her buyers. Beggars, as the saying goes, cannot be choosers — and India’s refining sector, with its voracious appetite for cheap feedstock, was not in a position to be precious.
The Sarah’s pivot is not an isolated data point. Bloomberg’s tanker-tracking desk reported that Indian refiners have snapped up approximately 30 million barrels of Russian crude in the first ten days of March alone — a volume that, spread across the country’s refining complex, represents a significant acceleration even by the elevated standards of the past three years. The Sarah and her sister vessels are not smugglers, exactly. They are the infrastructure of a sanctions regime that has been quietly, methodically hollowed out.
Three Tailwinds Handing Putin an Unexpected $1.6 Billion Windfall
Three forces have converged to produce what one senior European energy official, speaking privately, called “the sugar high Putin never asked for — and may not know how to manage.”
First: the price spike itself. The Urals-Brent spread, which had widened to an embarrassing $20–$25 discount through much of 2024 and early 2025, has collapsed dramatically. As of March 14, Urals was trading at a discount of barely $4 to Brent — a near-parity that would have been unthinkable eighteen months ago. The mechanism is straightforward: Iranian crude, which competes directly with Russian heavy-sour barrels in Asian refinery configurations, has essentially disappeared from the market. Refineries in India, China, and South Korea that had been blending Iranian and Russian feedstock are now bidding aggressively for whatever Russian supply is available. The Urals-Brent spread compression alone represents billions in additional monthly revenue for Rosneft, Lukoil, and Gazprom Neft.
Second: the extraordinary, if temporary, erosion of the sanctions architecture. Here the story takes a turn that has discomfited officials in Brussels and London considerably more than they publicly acknowledge. The Trump administration Russian oil waiver extension, formalised in a general license issued in mid-February and extended again on March 12 according to Reuters, was conceived as a pragmatic gesture to prevent a global price shock in the run-up to what Washington feared would be a disruptive Middle Eastern escalation. It has instead become, in the eyes of its critics, a subsidy to the Kremlin at the precise moment when the Kremlin is benefiting from that very escalation. The waiver permits certain categories of transaction — including, critically, Indian purchases of Russian crude above the G7 price cap — to proceed without triggering secondary sanctions. The result, as Forbes has noted, is that the price-cap mechanism, already severely strained, is now functioning as barely more than a paper constraint.
Third: China’s quiet desperation. Beijing’s role in this drama is less visible than India’s but arguably more structurally significant. Chinese independent refiners — the “teapots” of Shandong province — have been quietly rebuilding inventories of Russian ESPO blend and Urals at a pace not seen since the post-invasion purchasing surge of 2022. With Iranian barrels unavailable and Saudi Arabia managing production carefully, Chinese buyers find themselves with fewer alternatives than at any point in recent memory. This demand concentration gives Moscow unusual pricing leverage: for the first time since the sanctions regime was assembled, Russian oil exporters are, in certain grades and configurations, genuinely capacity-constrained rather than price-constrained.
Data Snapshot: Russia’s Oil Windfall in Numbers
- Urals price, March 14, 2026: ~$102/barrel (vs. ~$40 in late February)
- Urals-Brent spread: approx. –$4 (vs. –$22 in January 2026)
- Estimated monthly revenue uplift: $8–10 billion (based on ~130m barrels/month export volume)
- Indian Russian crude purchases, March 1–10: ~30 million barrels (Bloomberg)
- Shadow-fleet vessels active, Primorsk–Gujarat route: 47 (Kpler estimate, March 13)
- G7 price cap: $60/barrel — currently ~$42 below market
- US general-license waiver expiry (current extension): April 14, 2026
The Sugar High: Why This Boom Is Temporary
And yet. The history of petrostate windfalls is substantially a history of misallocated euphoria — of budget assumptions revised upward at precisely the moment when prudence counselled caution, and of fiscal structures reconfigured for a price environment that proved, in retrospect, to be an aberration rather than a new normal.
There are at least four reasons to believe that Putin’s present windfall is more confection than substance.
The most pressing is the US waiver expiry. The current general-license extension lapses on April 14. Renewing it has become politically toxic in Washington: critics on both sides of the aisle have framed it, with some justification, as a de facto subsidy to a country still prosecuting a war in Ukraine. The Treasury Department’s Office of Foreign Assets Control is under significant pressure not to issue a further extension, and several senior administration officials have privately indicated that the political calculus has shifted since February. If the waiver expires and is not renewed, the secondary-sanctions exposure for Indian and Chinese buyers increases materially — potentially enough to chill the purchasing volumes that are currently sustaining Urals prices.
The second constraint is European enforcement. The EU’s fourteenth sanctions package, adopted in late 2025, contains provisions targeting shadow-fleet operators that are only now beginning to be implemented. The Guardian has reported that three EU member states — Greece, Cyprus, and Malta, all major ship-registry and management jurisdictions — have begun issuing formal compliance notices to vessel owners suspected of shadow-fleet participation. The legal and insurance exposure for owners of vessels like the Sarah is rising in ways that have not yet been fully priced into freight markets.
Third: Indian payment hesitancy. The structural awkwardness of the India-Russia oil trade — routing payments through UAE-based intermediaries, using rupee-ruble conversion mechanisms that neither side finds entirely satisfactory — has not been resolved. Indian refiners have been willing to absorb this friction when Urals is trading at a significant discount. At near-parity with Brent, the calculation changes. IOC, HPCL, and BPCL are commercial enterprises with shareholder obligations; they will not pay a premium for Russian crude simply to accommodate Moscow’s revenue requirements. Several New Delhi-based energy executives have indicated, informally, that $95–100 Urals is approaching the threshold at which Middle Eastern or West African alternatives become genuinely competitive, logistical complications notwithstanding.
Fourth, and most structurally, there is the question of long-term demand destruction. The International Energy Agency’s March 2026 oil-market report (published the day before the Economist piece) contains a passage that has received insufficient attention: it projects that OECD oil demand will contract by 1.1 million barrels per day by end-2027, driven primarily by accelerating electric-vehicle penetration in Europe and the United States. Russia’s customer base — concentrated in Asia, where the energy transition is proceeding more slowly — provides a partial buffer. But China’s own EV market is the world’s largest, and Beijing’s long-term energy strategy explicitly targets reduced dependence on imported hydrocarbons. The demand floor beneath Russian crude is not collapsing, but it is demonstrably eroding.
What It Means for Global Energy Security and the Ukraine War
Set against the backdrop of the Ukraine conflict, now entering its fourth year, the revenue implications of this windfall are neither trivial nor transformative. Russia’s defence budget for 2026, as published by the Finance Ministry in December, assumes an average Urals price of $70 per barrel. Every dollar above that figure generates approximately $160 million annually in additional fiscal headroom. At $102 sustained through the year — an unlikely but not inconceivable scenario — the cumulative surplus above budget assumptions approaches $15 billion: meaningful, but not war-changing.
More significant, perhaps, is the political signal. Moscow has spent eighteen months managing a narrative of economic resilience under sanctions pressure — a narrative that required careful messaging precisely because the underlying data was, at points, genuinely uncomfortable. The windfall of March 2026 has handed Putin’s communications apparatus a gift: evidence, real and visible, that the Western sanctions architecture is porous, that Russia’s Asian market pivot was strategically correct, and that geopolitical chaos in one part of the world reliably generates revenue opportunities in another.
The New York Times and CNN have both noted, in recent days, the muted character of Western governments’ public response to the Urals surge. That muting is deliberate: calling attention to Putin’s windfall requires acknowledging the scale of sanctions erosion, which in turn raises uncomfortable questions about policy effectiveness that no Western capital is currently eager to answer in public.
Bloomberg’s energy desk put it with characteristic precision last week: “The price-cap was designed to constrain Russian revenues without starving global markets of supply. It is currently doing neither.”
For energy-security planners in Berlin, Tokyo, and Washington, the broader lesson of this episode may prove more durable than the episode itself. The Strait of Hormuz remains the world’s single most consequential chokepoint — a fact that the events of early March have re-dramatised with some force. Any disruption there creates immediate, cascading price effects that disproportionately benefit the alternative suppliers best positioned to absorb displaced demand. Russia, for all the damage inflicted by three years of sanctions, remains exactly such a supplier. That structural reality is not going to be wished away by policy declarations or price-cap communiqués.
The Sarah, her hull cutting south through the Arabian Sea toward Gujarat, is not carrying a political statement. She is carrying crude oil, loaded at a Russian Baltic terminal, bound for an Indian refinery that needs feedstock at a workable price. But the wake she leaves behind her traces the outline of a geopolitical problem that neither sanctions advocates nor their critics have fully resolved: how to constrain a major energy producer without either emptying your own consumers’ wallets or handing that producer a windfall every time the world’s other energy sources become unavailable.
Putin didn’t ask for this sugar high. But he is, for now, enjoying it — and spending the revenues in ways that will outlast the spike that generated them.
Discover more from The Economy
Subscribe to get the latest posts sent to your email.


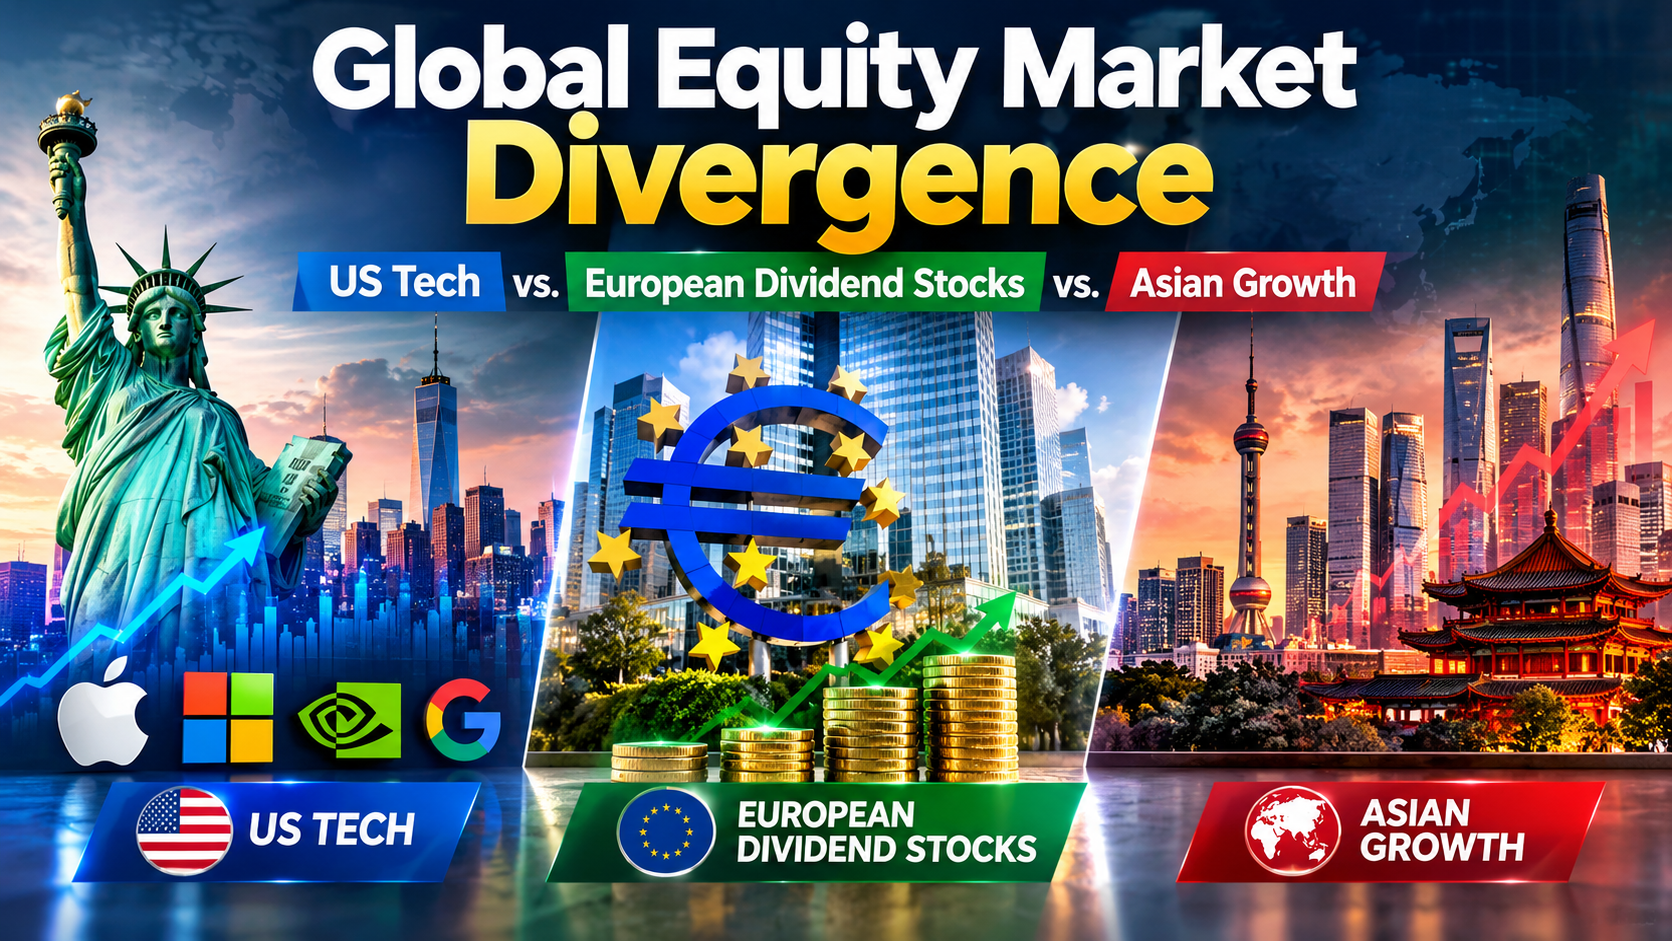
S&P 500 at 7,620, FTSE at 10,698, Nikkei at 64,136. Compare US tech, European dividends and Asian growth as three central banks split on rates.
Executive Summary / Key Takeaways
- The three major regions are now priced off three different monetary regimes: the Fed hiking into strength, the ECB hiking into weakness, and the Bank of Japan normalising from near zero.
- On the day of the Fed’s hike, the Dow fell more than 600 points while the Nasdaq finished close to flat — a clean demonstration that “US equities” is no longer a single exposure.
- European indices held up: the FTSE 100 sat at 10,697.57 (+0.44%) while the DAX at 25,440.81 and Euro Stoxx 50 at 6,260.38 slipped.
- Japan outperformed on currency mechanics, with the Nikkei at 64,136 and the Topix at 4,094.
- Yardeni Research cut its year-end S&P 500 target to 7,900 from 8,400, citing yield pressure from rising energy prices.
Regional equity allocation has spent a decade being a low-conviction decision. Global indices moved together, US technology led, and everything else was a funding source. September 2026 broke that pattern within a single trading week.
The trigger was monetary divergence. The Federal Reserve raised rates to 3.75%–4.00% on 16 September. The ECB had already lifted its deposit rate to 2.5% on 10 September. The Bank of England held at 3.75% on a 6-3 split on 17 September, and the Bank of Japan is expected to hike on 18 September.
Four decisions, four different directions of travel, four different equity responses. That is the environment retail investors and portfolio managers now have to allocate into.
2. Core Market Analysis
2.1 The comparison matrix
| Region / Index | Level | Move | Monetary regime | Primary source |
|---|---|---|---|---|
| S&P 500 (US) | 7,619.98 | -0.48% | Fed tightening; ≥1 more hike signalled | Yahoo Finance |
| Nasdaq Composite (US) | 26,186.41 | -0.56% | Duration-sensitive; held up on Fed day | Yahoo Finance |
| Dow Jones (US) | 52,421.20 | -0.29% | Fell 600+ pts on the hike itself | Yahoo Finance |
| FTSE 100 (UK) | 10,697.57 | +0.44% | BoE on hold at 3.75% | Yahoo Finance |
| DAX (Germany) | 25,440.81 | -0.50% | ECB at 2.5% deposit rate | Yahoo Finance |
| CAC 40 (France) | 8,117.78 | -0.76% | ECB at 2.5% deposit rate | Yahoo Finance |
| Euro Stoxx 50 | 6,260.38 | -1.02% | Weakest major European print | Yahoo Finance |
| Nikkei 225 (Japan) | 64,136 | +0.33% | BoJ normalising; weak yen tailwind | Trading Economics |
| Hang Seng (HK) | 24,713 | +0.2% | Pegged; HKMA hiked to 4.25% | Trading Economics |
| VIX | 17.10 | +7.95% | Volatility bid but not stressed | Yahoo Finance |
2.2 US: the index is not the market
The single most revealing datapoint of the week was the internal dispersion on Fed day. Stocks turned lower during Warsh’s press conference as markets read his remarks as hawkish, with the Dow leading losses down more than 700 points at one stage — over 1.6% — while the S&P 500 declined 0.4% and the Nasdaq slid just below flat, Yahoo Finance reported.
Conventional rate logic says long-duration growth should suffer most when yields rise. It did not. The cyclical, energy-exposed and rate-sensitive parts of the market took the damage instead: J.B. Hunt Transport fell 12.64% after warning on earnings and rising operating costs, Diamondback Energy dropped 8% amid concerns over inflation, rising Treasury yields and crude-market geopolitical risk, and APA Corp fell 5.2%, according to TheStreet’s market coverage. Optical and photonics names rebounded, with Coherent and Lumentum each up around 6%.
The forward view has been trimmed. Yardeni Research cut its year-end S&P 500 target to 7,900 from 8,400 — implying 4.1% upside from Tuesday’s close of 7,585.73 rather than the 11% its previous estimate implied — citing higher Treasury yields due to rising energy prices and increased downturn risk over the next three to six months, CNBC reported.
2.3 Europe: the dividend case
European equities are not outperforming on growth. Euro-area output is projected around 1.3% for 2026 by the IMF, with the region benefiting less than others from the technology-driven investment boost and lingering energy-price effects still dragging on manufacturing.
They are outperforming, where they are, on payout and valuation. With the ECB deposit rate at 2.5% — the loosest of the major blocs — the yield competition from cash and short-dated bonds is materially weaker in Europe than in the US, where the funds rate is now 3.75%–4.00% and the 10-year has topped 5%. That relative-yield arithmetic is the structural argument for European income equity in this cycle, and it holds regardless of European growth being mediocre.
The UK sits awkwardly between the two. The FTSE’s commodity and energy weighting makes it a partial beneficiary of the same oil shock hurting importers elsewhere, which explains its positive print against a broadly weaker European tape.
2.4 Asia: growth with a currency asterisk
Japan’s advance came from yen weakness after the Fed decision, which improved the earnings outlook for export-focused industries, Trading Economics noted. Hong Kong’s caution came from the HKMA following the Fed with a hike to 4.25%, pressuring property.
The regional growth case is real — East Asia and Pacific is projected at 4.2% for 2026 and South Asia at 6.3% by the World Bank — but a meaningful share of recent Japanese equity return has been a currency effect that BoJ normalisation will erode.
3. Structural Drivers and Competitor Gaps
The gap in most comparative coverage is treating this as a regional rotation call. It is better understood as three separate factor exposures that happen to have geographic labels:
- US large-cap technology is a duration and AI-capex exposure. It held up on Fed day because the AI investment cycle is currently a stronger driver than the discount rate. Both the IMF and World Bank cite broader AI adoption as the principal upside risk to global growth. If that capex cycle cools, the rate sensitivity reasserts itself immediately.
- European income equity is a relative-yield exposure. Its attractiveness is a function of the ECB-Fed policy gap, not of European fundamentals. Narrow the gap and the case weakens.
- Asian growth equity is partly a currency exposure. Particularly in Japan, where the return decomposition between earnings and FX is doing more work than most allocators acknowledge.
Correctly labelled, these are not substitutes for one another. The diversification benefit of holding all three is higher in 2026 than at any point in the past decade — which is the practical conclusion most aggregator coverage fails to reach.
4. Key Implications for Stakeholders
Retail investors. A global index fund currently buys you a heavy weighting to a single factor: US technology and its AI capital-expenditure cycle. If that is the intended exposure, fine. If not, deliberate regional allocation is required to get it.
Portfolio managers. Volatility is bid but not stressed, with the VIX at 17.10 — an unusually calm reading given four central bank decisions in eight days and crude above $100. That combination favours adding hedges while they remain inexpensive rather than after a repricing.
Income investors. The yield hurdle is regional now. In the US, equity income competes against a 10-year above 5%. In the euro area, it competes against a 2.5% deposit rate. The same dividend yield is a materially better proposition in one market than the other.
Risk teams. Cross-regional correlation assumptions built on the 2015–2021 regime are stale. Three distinct monetary cycles produce genuinely differentiated drawdown paths.
5. Frequently Asked Questions
Q1: Why did the Nasdaq hold up while the Dow fell after the Fed hike?
The damage concentrated in cyclical, transport and energy-exposed names rather than long-duration technology. Investors are currently treating the AI capital-expenditure cycle as a stronger earnings driver than the discount rate is a valuation headwind.
Q2: Are European dividend stocks more attractive than US equities now?
On relative yield, arguably. The ECB deposit rate is 2.5% against a US funds rate of 3.75%–4.00% and a 10-year Treasury above 5%, so European equity income faces far weaker competition from cash and bonds. European growth, however, remains around 1.3%.
Q3: What is the current S&P 500 level and forecast?
The S&P 500 was at 7,619.98. Yardeni Research cut its year-end target to 7,900 from 8,400, implying roughly 4% upside, citing higher Treasury yields driven by rising energy prices.
Q4: Which region offers the best equity growth in 2026?
Asia on headline growth — East Asia and Pacific at 4.2% and South Asia at 6.3% per World Bank forecasts. But a meaningful share of recent Japanese equity returns reflects yen weakness rather than earnings, and Bank of Japan normalisation erodes that tailwind.
Discover more from The Economy
Subscribe to get the latest posts sent to your email.
Markets & Finance
Asian Markets Analysis: Navigating Volatility in China, Japan, and Singapore Stocks
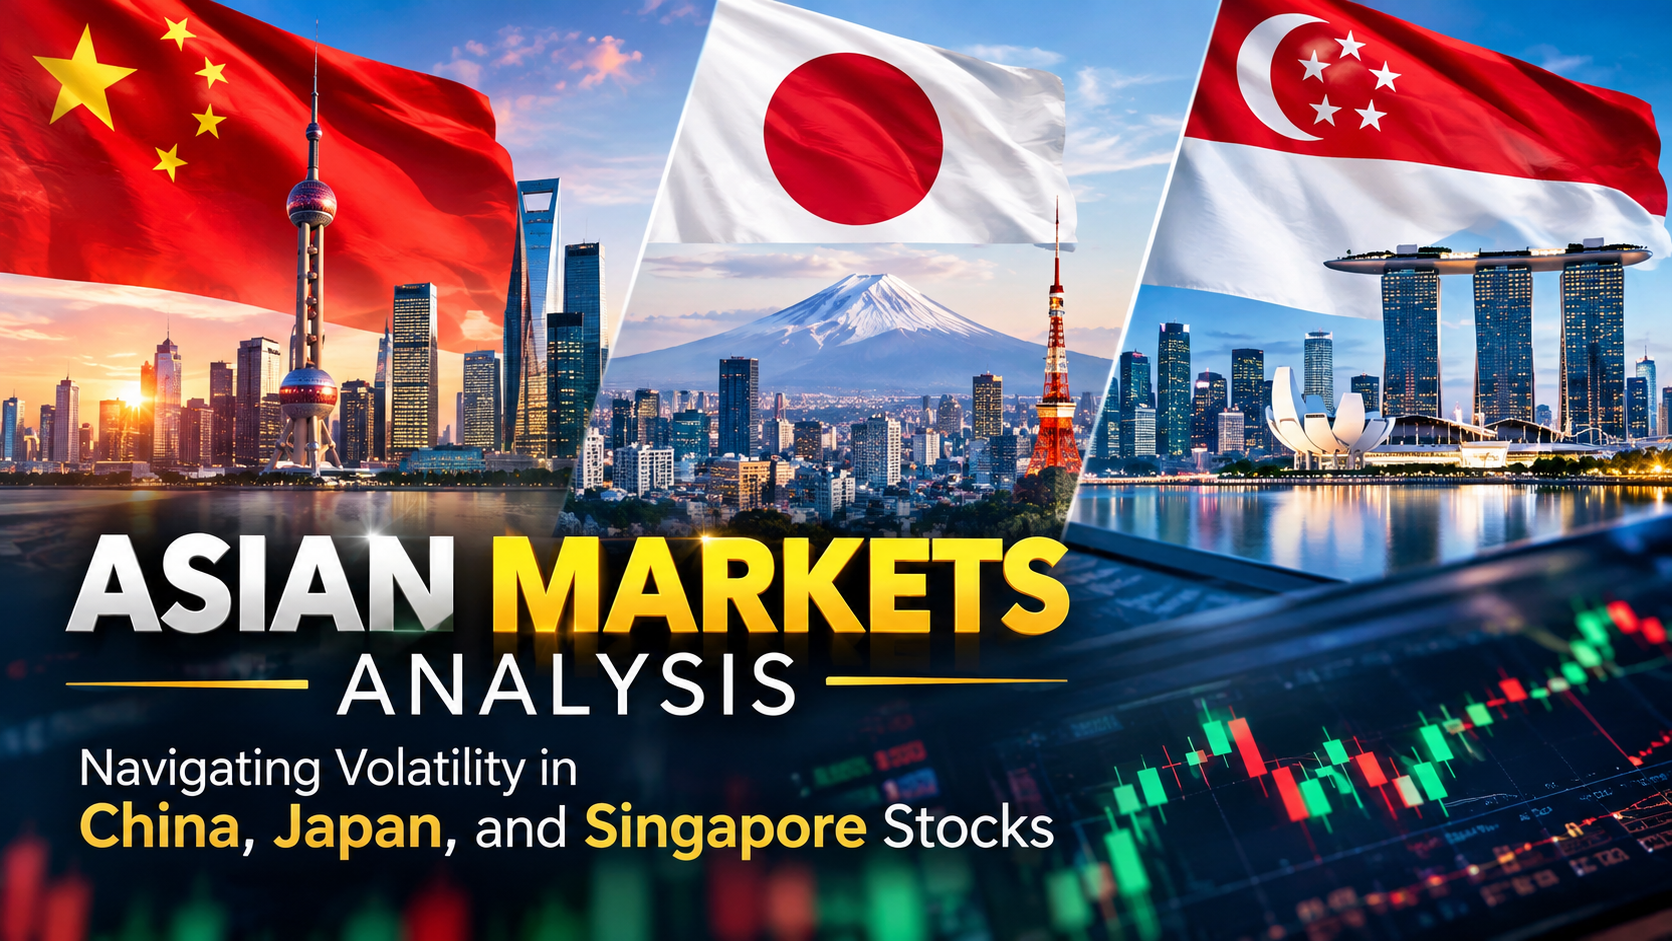
Nikkei at 64,136, Hang Seng at 24,713, HKMA hikes to 4.25%. Inside Asia’s split response to the Fed and where regional equity risk sits now.
Executive Summary / Key Takeaways
- The Nikkei 225 climbed 0.33% to 64,136 on Thursday 17 September, extending gains after the Fed’s hike, with the Topix up 0.8% to 4,094.
- Hong Kong’s Hang Seng closed at 24,713 on Wednesday, up 0.2%, but the Hong Kong Monetary Authority immediately followed the Fed by raising its base rate 25 basis points to 4.25%.
- The Shanghai Composite sits near 3,880 — a different market with a different driver, less exposed to US rate transmission than Hong Kong.
- Japan’s gain and Hong Kong’s caution come from the same event: a weaker yen helps Japanese exporters, while Hong Kong’s currency peg imports US tightening directly into property funding costs.
- The Bank of Japan’s decision on 18 September is the region’s next binary risk.
1. Introduction & Immediate Context
Asia did not react to the Federal Reserve as a bloc this week. It reacted as three distinct monetary regimes, and the dispersion is instructive for anyone running regional equity exposure.
Japanese equities rose. The Nikkei 225 climbed 0.33% to close at 64,136 while the broader Topix advanced 0.8% to 4,094 on Thursday, extending gains from the previous session after the US Federal Reserve delivered a widely expected rate hike, even as it signalled further tightening, Trading Economics reported. The mechanism was currency: the yen weakened against the dollar following the Fed’s decision, improving the earnings outlook for Japan’s export-focused industries.
Hong Kong was more cautious. The market remained wary after the Fed raised rates and signalled the possibility of another hike, strengthening the dollar and pushing Treasury yields higher, according to Trading Economics. The HKMA raised its base rate by 25 basis points to 4.25% following the Fed’s move, weighing on Hong Kong property stocks as higher borrowing costs threatened recovery.
Same catalyst. Opposite outcomes.
2. Core Market Analysis
2.1 Regional index snapshot
| Index | Level | Recent move | Key domestic driver | Source |
|---|---|---|---|---|
| Nikkei 225 (Japan) | 64,136 | +0.33% (17 Sep) | Weaker yen; BoJ decision 18 Sep | Trading Economics |
| Topix (Japan) | 4,094 | +0.8% (17 Sep) | Broad-based exporter strength | Trading Economics |
| Hang Seng (Hong Kong) | 24,713 | +0.2% (16 Sep close) | HKMA rate hike to 4.25% | Trading Economics |
| Shanghai Composite (China) | ~3,880 | -0.13% | Domestic policy, not Fed transmission | Yahoo Finance |
| Shenzhen Component | ~13,361 | -0.17% | Tech and manufacturing weighting | Yahoo Finance |
2.2 Japan: the carry-trade pivot
Japan’s rally has an expiry date attached to it. Japanese ultra-low rates helped finance trillions of dollars in global investments for more than a decade, making the yen one of the world’s cheapest sources of funding — and with the Bank of Japan expected to tighten again this week, that advantage may be entering a new phase, FXStreet noted. Markets widely expect a quarter-point increase to 1.25%.
The Nikkei’s strength this week is therefore borrowed against a currency effect that the BoJ may partially reverse within 24 hours. Gains on Thursday were broad-based, with notable performances from index heavyweights including SoftBank Group, Fujikura, Lasertec, Mitsubishi Heavy Industries and Nintendo. Wednesday’s session had already seen the index climb 0.69% to 63,923 as easing oil prices reduced pressure on equities — relevant for an economy that imports nearly all of its crude.
Japanese equities also benefited from declining oil prices amid expectations that crude flows through Saudi Arabia’s East-West pipeline could resume soon.
2.3 Hong Kong: the peg is the problem
Hong Kong’s dollar peg means the HKMA has no independent rate-setting discretion. When the Fed hikes, Hong Kong hikes — which transmits US monetary policy directly into a property market that has been trying to stabilise for several years.
The equity response was not uniform, however. Technology stocks provided support, with the Hang Seng Tech Index rising 0.9% by midday in the prior session. Zhipu AI surged more than 8%, ending an 11-session losing streak, while MiniMax, SMIC and Hua Hong Semiconductor gained between 5% and 7%. Against that, Xiaomi, Kuaishou and Akeso declined. On Thursday the pattern reversed for large caps: Tencent fell 1.7%, Kingboard Laminates 1.9% and HKEX 1.8%, while Z.AI Co. rose 2.9%, MiniMax 7.1% and Genscript Biotech 14.3%.
CICC has argued that Hong Kong stocks could face greater volatility from renewed US monetary tightening, though the impact should be short-lived unless the Fed begins a sustained rate-increase cycle. Given the dot plot now points to at least one more hike, that caveat is doing considerable work.
3. Structural Drivers and Competitor Gaps
Most regional market write-ups treat “Asian markets” as a single sentiment block. The 2026 reality is a three-regime structure that produces genuinely uncorrelated outcomes:
Regime one — pegged (Hong Kong). Zero monetary autonomy. US rates arrive unfiltered. Property and financials bear the adjustment; technology can decouple on idiosyncratic news flow, as the AI names did this week.
Regime two — normalising (Japan). The BoJ is tightening from a near-zero base for domestic reasons while the Fed tightens for inflation reasons. The interest-rate differential still favours a weak yen, which supports exporters — but each BoJ step narrows that support, and the carry-trade unwind exports volatility into global bond markets rather than into the Nikkei directly.
Regime three — domestically driven (mainland China). The Shanghai and Shenzhen indices moved marginally on the Fed decision. Beijing’s policy cycle, not Washington’s, sets the tone.
The competitor gap worth exploiting is the assumption that a stronger dollar is uniformly negative for Asian equities. It is negative for pegged and dollar-funded markets; it is currently positive for Japanese exporter earnings; and it is close to neutral for onshore China. Capital-flow data, not index correlation, is where the distinction shows.
There is also a structural investment story running underneath the rate noise. Reports highlighted potential financing of around US$2.6 billion for Hong Kong data-centre development, reflecting growing investment in the city’s digital infrastructure. Regional AI and data-centre capex remains the counterweight to monetary tightening across Singapore, Malaysia, Japan and Hong Kong alike.
4. Key Implications for Stakeholders
International equity traders. The Hang Seng’s sensitivity to Fed pricing makes it the cleanest regional expression of a US rate view. If the December hike is delivered, the HKMA follows mechanically and property funding costs rise again.
Wealth managers with Japan exposure. Decide whether your Japanese allocation is a currency trade or an equity trade. Much of the 2026 Nikkei performance has been the former. A BoJ normalisation path that narrows the differential changes the return profile even if Japanese corporate earnings hold.
Singapore-focused allocators. Singapore’s market has been supported through 2026 by AI-linked capital expenditure and semiconductor demand rather than by rate expectations. That makes it the region’s most attractive defensive-growth blend — but also the most exposed if the global technology capex cycle cools, which both the IMF and World Bank flag as the principal downside risk to their outlooks.
Risk managers. The three-regime structure argues for separate regional sleeves rather than a single Asia ex-Japan mandate. Correlation assumptions built on the 2015–2021 period no longer describe this market.
5. Frequently Asked Questions
Q1: How did Asian markets react to the September 2026 Fed rate hike?
Unevenly. Japan’s Nikkei rose 0.33% to 64,136 as a weaker yen helped exporters, while Hong Kong stayed cautious after the HKMA followed the Fed with a 25-basis-point rise to 4.25%, pressuring property stocks. Mainland Chinese indices moved only marginally.
Q2: Why did the Hong Kong Monetary Authority raise rates?
The Hong Kong dollar’s peg to the US dollar removes independent rate-setting discretion, so the HKMA moves in step with the Federal Reserve. Its base rate rose to 4.25% immediately after the Fed’s September decision.
Q3: What is the Nikkei 225 level now?
The Nikkei 225 closed at 64,136 on 17 September 2026, up 0.33%, with the Topix at 4,094. The index has been supported by yen weakness and easing oil prices.
Q4: What is the biggest near-term risk to Asian equities?
The Bank of Japan’s decision on 18 September and the potential unwinding of the yen carry trade, which has already contributed to higher long-dated yields in the US and Europe.
Discover more from The Economy
Subscribe to get the latest posts sent to your email.

Key Takeaways
- The KSE-100 Index gained roughly 44% in rupee terms (46–48% in U.S. dollar terms) in fiscal year 2026 — outperforming nearly every major asset class for a third consecutive year.
- The index touched an intraday high of 189,167 in January 2026 before a sharp correction to 146,480 in March amid the Iran-U.S./Israel conflict and a related oil-price spike, then recovered above 180,000 by mid-2026.
- Over FY24–FY26 combined, the KSE-100 has returned 335% in rupee terms (347% in USD terms) — a run analysts attribute to macroeconomic stability under Pakistan’s IMF program, policy continuity, and the country’s return to international debt markets.
- One heavyweight, United Bank Limited (UBL), became Pakistan’s largest listed company by market cap in early 2026, overtaking Oil & Gas Development Company (OGDC).
- Foreign investors were net sellers of roughly $895 million during FY26 even as the index rallied — the gains have been driven overwhelmingly by local institutional and retail buying.
The FY26 Numbers at a Glance
| Metric | FY26 Figure |
|---|---|
| KSE-100 return (PKR) | ~44% |
| KSE-100 return (USD) | ~46–48% |
| 3-year cumulative return (FY24–26, PKR) | 335% |
| 3-year cumulative return (FY24–26, USD) | 347% |
| Intraday high | 189,167 (Jan 23, 2026) |
| Intraday low | 146,480 (Mar 9, 2026) |
| Foreign investor flow | –$895 million (net selling) |
What Drove the Rally
- Macro stability under the IMF program. Rating upgrades, prudent monetary and fiscal policy, and Pakistan’s successful return to international capital markets have all been cited by brokerages (AKD Research, Topline Securities) as core drivers.
- Record monthly remittances. May 2026 remittances hit an all-time high of $4.3 billion, coinciding with the index pushing back above the 180,000 level.
- A geopolitical shock and recovery. The Iran-U.S./Israel conflict triggered a sharp petroleum-price surge and a 29% intra-year swing in the index, but a subsequent MoU on the conflict helped markets recover to pre-war levels by mid-April 2026.
- Sector rotation. Sugar, jute, and transport stocks outperformed the broader market in FY26, while vanaspati, synthetic rayon, and woollen sectors lagged.
Where the Market Stands Now
By mid-September 2026, the KSE-100 was trading in the high-160,000s to near-170,000 range, with brokerage forecasts split between roughly 203,000 (Topline) and a more bullish 263,800 (AKD Research) by December 2026 — a projection that, if realized, would push the index past a historic $100 billion market capitalization for the first time.
The Risk Side of the Ledger
- Foreign capital remains cautious. Nearly $900 million in net foreign selling during a rally this strong suggests international institutions are not yet convinced the move is durable.
- Geopolitical sensitivity. The March 2026 drawdown showed how quickly regional conflict risk (in this case, the Iran-Israel-U.S. situation) can hit the index given Pakistan’s exposure to oil-price shocks.
- Concentration risk. A handful of heavyweights — UBL, OGDC, Engro, HBL, Lucky Cement, Bank Alfalah — have driven a disproportionate share of index gains.
How did the Pakistan Stock Exchange perform in FY26?
The KSE-100 Index gained approximately 44% in rupee terms (46–48% in USD terms) in fiscal year 2026, marking a third consecutive year of outperformance versus other major asset classes, despite a sharp mid-year correction tied to the Iran-U.S./Israel conflict.
Discover more from The Economy
Subscribe to get the latest posts sent to your email.

VIX Index Explained: How to Trade Wall Street’s Fear Gauge Today

Commercial vs Residential Real Estate: Which Wins in 2026?

Presidential Stock Market Performance: How Trump’s Second Term Compares to History

2026 Real Estate Market News: Are We Heading for a Correction?

Bitcoin Price Forecast 2026–2027: Will the 4-Year Cycle Hold?

Fidelity Crypto vs. Traditional Brokerages: A Guide for Modern Investors

The 2026 Global Smartphone Market: AI Integration and Competitor Analysis

SpaceX IPO: How Aerospace Is Reshaping Tech Startup News

Fidelity Investments Review: Maximizing Returns in a Volatile Stock Market

How Crypto Transformed the Trump Fortune: A $1.4 Billion Financial Breakdown

Global Pension Systems Ranked: The World’s Best and Worst Retirement Frameworks

Global Supply Chain Vulnerabilities: From Eurasian Trade Corridors to Food Consumer Recalls

Why 5% U.S. Treasury Yields Signal a Global Market Regime Shift.

Federal Reserve Defies White House Pressure: Inside Trump’s Demand for Sub-1% Interest Rates After Historic 2026 Rate Hike

US-China Relations in Q3 2026: Trade Tariffs and Supply Chain Risks

Top 30 Stocks for Investment in PSX for Massive ROI in 2026

SpaceX Starship Flight 14: First Orbital Attempt & Starlink V3 Launch Explained

The 2026 Crypto Regulatory Shift: What It Means for Institutional Investors

AI Chip Stocks 2026: The Best Semiconductor Investments Beyond Marvell

Tween Back-to-School Trends 2026: What’s Driving the $85B Season

AI-Powered Training: The Next Multi-Billion Dollar Ecosystem in Fitness

Oil Prices Break $100 in 2026: Middle East Conflict & Energy Markets

10-Year Treasury Yield Hits 4.80%: What It Means for Rates & Portfolios

Fidelity Investments Review 2026: SPAXX Yields & Zero-Fee Funds

BRICS+ Cross-Border Payments 2026: Interoperability Explained

Shein Clothes Quality & Safety in 2026: What Lab Tests Show

MRVL Earnings 2026: Why Marvell Sank Despite Beating Estimates

China’s US$10.8 Billion Trade Shortcut: Why the Pinglu Canal Matters
-

 Markets & Finance9 months ago
Top 15 Stocks for Investment in 2026 in PSX: Your Complete Guide to Pakistan’s Best Investment Opportunities
-

 Analysis7 months ago
Johor’s Investment Boom: The Hidden Costs Behind Malaysia’s Most Ambitious Economic Surge
-

 Analysis7 months ago
Top 10 Stocks for Investment in PSX for Quick Returns in 2026
-

 Analysis8 months ago
Brazil’s Rare Earth Race: US, EU, and China Compete for Critical Minerals as Tensions Rise
-

 Banks8 months ago
Best Investments in Pakistan 2026: Top 10 Low-Price Shares and Long-Term Picks for the PSX
-

 Investment8 months ago
Top 10 Mutual Fund Managers in Pakistan for Investment in 2026: A Comprehensive Guide for Optimal Returns
-

 Global Economy9 months ago
15 Most Lucrative Sectors for Investment in Pakistan: A 2025 Data-Driven Analysis
-

 Global Economy9 months ago
Pakistan’s Export Goldmine: 10 Game-Changing Markets Where Pakistani Businesses Are Winning Big in 2025