
Business
US Inflation 4% May 2026: Is the Worst Over? Fed, Oil Prices
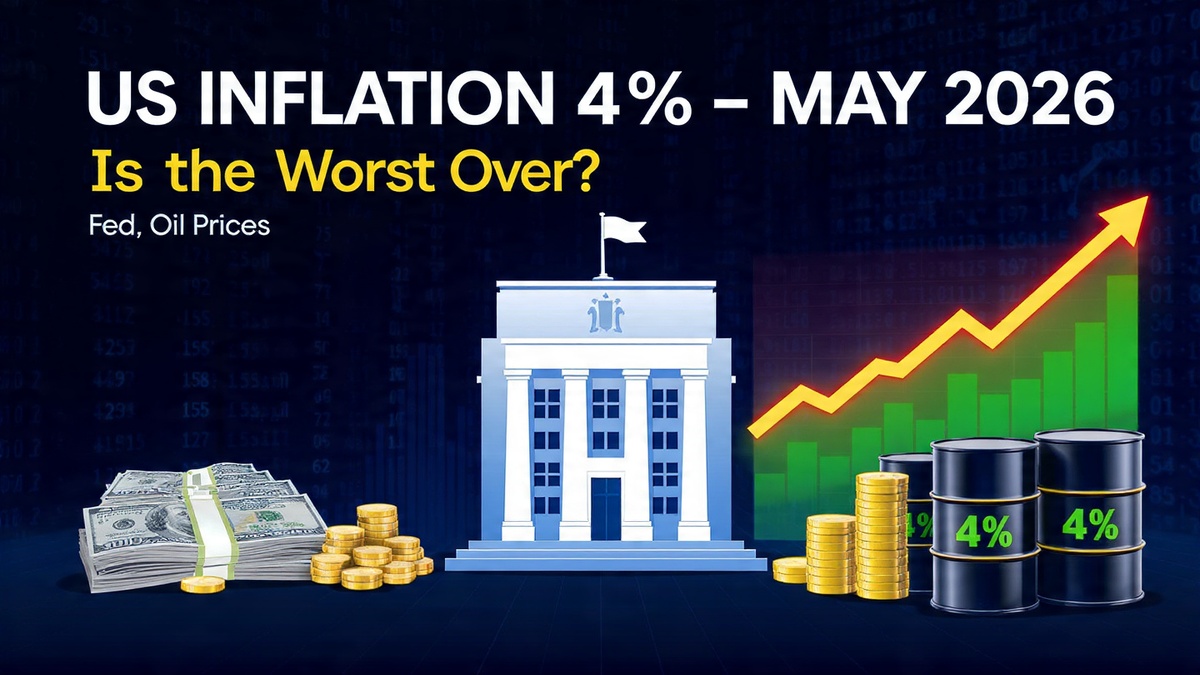
US inflation crossed 4% in May 2026, its highest in three years. But analysts see signs the peak may be in. Here’s what’s driving prices, what cools them, and what it means for your finances.
U.S. inflation topped 4% in May 2026—doubling the Federal Reserve’s target and hitting its highest level in three years—but a growing cohort of economists and market analysts believes the worst of the current price surge may be ending. The reasons for both the spike and the projected deceleration trace back to a single disruptive event: the military conflict in the Middle East and its consequences for global energy markets.
Annual inflation accelerated sharply from 2.4% at the start of the year to 3.8% in April and then crossed 4% in the May report, according to data cited across analysis from institutions including Deloitte and the Federal Reserve. Fuel oil prices alone increased 5.8% in April compared to March. The immediate cause was not hard to identify: the U.S.-led bombing campaign against Iran disrupted flows through the Strait of Hormuz, the 21-mile waterway through which roughly 20% of the world’s daily oil and gas supply transits.
A Supply Shock Layered on Structural Weakness
What made the energy shock particularly damaging was the macroeconomic surface it landed on. After five years of inflation running above the Fed’s 2% target—through pandemic-era supply chain disruption, the 2022 commodity shock following Russia’s invasion of Ukraine, and the persistent pricing power of service sector industries—the U.S. economy had limited cushion to absorb another commodity surge.
The Hormuz disruption took oil prices sharply higher almost overnight. But the price pressure extended well beyond crude. Over 20% of oil and gas, about 33% of global fertilizer shipments, and numerous other commodity inputs pass through the strait. Transportation costs surged. Agricultural commodity prices followed. Real wages—adjusted for inflation—declined across much of the developed world, squeezing household purchasing power at a moment when credit card debt was already at record levels.
Global headline inflation is projected to reach roughly 4.4% to 5.2% in developing economies and approximately 2.9% in developed ones for 2026, according to projections cited by Fair Observer. The divergence reflects the higher energy import dependence of poorer nations, which have fewer domestic energy resources and less fiscal capacity to subsidize consumer prices.
Why the Peak May Be In
The cautious optimism among some analysts rests on a set of connected assumptions. The ceasefire agreement that ended the immediate U.S.-Iran military confrontation should, over time, allow Hormuz traffic flows to recover. A UAE oil executive warned that even with swift resolution, returning to 80% of pre-conflict flows would take at least four months—with full normalization potentially not arriving until the first or second quarter of 2027. But the direction of travel, absent renewed hostilities, points toward gradual energy price relief.
Commodity futures markets had, by late June, already begun pricing a modest Brent crude decline on the assumption that the ceasefire holds. Base effects will also help: the May and June 2026 comparisons for year-on-year CPI will face the spike itself as a prior-period reference point, mechanically pulling the year-over-year number lower even if month-on-month price increases level out.
German wholesale prices, which serve as a leading indicator for broader European and global goods inflation, rose 5.9% year-over-year in May—down from 6.3% in April, suggesting the pace of industrial goods inflation in Europe is already moderating. The sharpest declines came from food items including coffee, tea, and milk. These tend to lead consumer goods prices by several months.
The Fed’s Dilemma Remains Acute
None of this resolves the Federal Reserve’s core problem: inflation is structurally above target, the labor market remains strong enough to sustain wage-driven price pressure, and Kevin Warsh’s first press conference made clear that the new Fed chair intends to prioritize price stability over growth support. Nine FOMC members signaled rate hikes by year-end in their June projections.
The question of whether the CPI peak has arrived—or whether inflation merely pauses before re-accelerating if oil prices rise again—is precisely the uncertainty that makes the September FOMC meeting the most consequential in years. Traders are pricing roughly a coin-flip chance of a September hike, and BofA now forecasts three quarter-point increases before year-end.
The household experience of the current inflation episode has been particularly concentrated at the bottom of the income distribution. Consumer sentiment fell to 48.9% in the final University of Michigan survey of June—near historic lows—reflecting the gap between the financial markets’ resilience and the lived reality of households where food, fuel, and shelter costs have risen significantly faster than wages.
What Cools Inflation From Here
The most plausible path to deceleration runs through four channels. First, energy price relief if Hormuz normalization proceeds. Second, base effects that mechanically reduce year-on-year comparisons. Third, a softening of consumer demand if the Fed tightens and borrowing costs rise. Fourth, a continued easing of goods price inflation as global supply chains—which have been rebuilding capacity since the pandemic—absorb excess demand.
The structural wildcard is AI-driven productivity. Kevin Warsh has publicly argued that the AI investment boom is “structurally disinflationary”—that productivity gains from automation will eventually hold down labor costs and goods prices at a pace that allows the Fed to maintain lower rates than the historical rule of thumb would suggest. That argument, which informs his broader monetary framework, is the contested terrain on which the inflation debate of 2026 and 2027 will ultimately be fought.
Discover more from The Economy
Subscribe to get the latest posts sent to your email.


Federal Reserve Chair Kevin Warsh held rates at 3.5–3.75% on June 17, 2026, but nine officials signalled a 2026 rate hike as inflation hit 4.2%. What the “regime change” means for markets.In his first press conference as Fed chair, Kevin Warsh announced that the Federal Open Market Committee had voted unanimously to keep the benchmark federal funds rate in a range of 3.5% to 3.75% — the fourth consecutive hold. But the accompanying Summary of Economic Projections told a different story: nine of 18 participating officials now favour at least one interest rate increase before the end of 2026, with six pencilling in two separate quarter-point hikes. That is a dramatic reversal from as recently as March, when the base case remained an easing bias.
A Debut Defined by What Was Removed
Warsh has long criticised the Federal Reserve’s communications machinery as cluttered, forward-looking to the point of being counterproductive, and prone to generating market noise rather than policy clarity. His first meeting delivered on that critique in practice.
The policy statement was substantially shortened. References to “additional rate adjustments” were stripped out entirely, removing the easing-leaning language that had guided market pricing through most of 2025 and early 2026. In place of forward guidance, the closing sentence read simply: “The committee will deliver price stability.” Warsh announced task forces in five areas — monetary policy frameworks, communications, data sourcing, productivity, and labour markets — and signalled that even the quarterly dot plot itself was under review.
“When you have one [press conference], you want to make sure you have something important to say,” Warsh told reporters, hinting that he would reduce the frequency of post-meeting media appearances. He also confirmed he had not submitted his own interest rate projections for the dot plot — leaving one dot conspicuously absent from the published chart and keeping his personal baseline ambiguous.
What 4.2% Inflation Means for the Rate Path
The June dot plot was produced against a backdrop in which consumer prices are running at 4.2% annually — the fastest pace since April 2023 — driven in large part by the energy shock associated with the US-Iran conflict that began in late February. The FOMC’s revised economic projections now see PCE inflation at 3.6% by year-end, sharply higher than the 2.7% projected in March, while GDP growth estimates for 2026 were trimmed to 2.2%.
Fox Business reported that Warsh was explicit in his assessment: “Persistently high prices are a burden for the American people, but the recent past need not be prologue.” He offered assurance that the FOMC is “unambiguous and unanimous” in its commitment to delivering price stability — language that reads as a direct rebuke of the prolonged inflation tolerance that defined the post-pandemic era.
The immediate market reaction was sharp. Two-year Treasury yields jumped 16 basis points to 4.21%, their highest level in over a year. The S&P 500 fell 1.21%, the Nasdaq dropped 1.34%, and the US dollar index surged approximately 1% — its best daily performance in almost a year. Gold, which typically performs poorly when rate expectations shift hawkish and the dollar strengthens, fell more than 2%.
The Trump Complication
President Trump had nominated Warsh in part with the expectation that he would press for lower borrowing costs. That assumption has been quietly tested by events. Trump acknowledged higher rates “keeps the country down,” according to CNN, but notably declined to publicly criticise Warsh’s first decision — a restraint that former chair Jerome Powell rarely received. Powell, who remains on the Fed’s Board of Governors and retains a voting seat on the FOMC, is still under a Justice Department inspector general review related to the Fed headquarters renovation.
The gap between political preference and monetary reality is already visible. Citadel Securities had warned of rising September hike risks, citing strong wages, resilient consumer demand, supply chain strains from the Iran conflict, and AI-driven investment crowding out rate-sensitive sectors. The July 28-29 FOMC meeting will be the next scheduled test, and markets are already recalibrating.
What It Means for Borrowers
The practical consequences are already filtering through household balance sheets. With the benchmark rate held at elevated levels and rate cut prospects for 2026 effectively removed from the base case, mortgage rates, credit card rates, and auto loan rates will remain at or near current highs. “On paper nothing changes,” Michael Ryan of MichaelRyanMoney.com told Newsweek. “In real life it signals the Fed is still watching inflation. It doesn’t give relief to borrowers and it doesn’t reward savers.”
The June dot plot’s median projection for rates in 2026 has shifted higher, and the longer-run dot — treated as a guidepost for the neutral rate — signals the committee sees no urgency to ease even into 2027. The Warsh era at the Federal Reserve has opened with a clear message: price stability is the governing priority, and the toolbox for achieving it may yet include rate hikes that as recently as six months ago seemed inconceivable.
Discover more from The Economy
Subscribe to get the latest posts sent to your email.
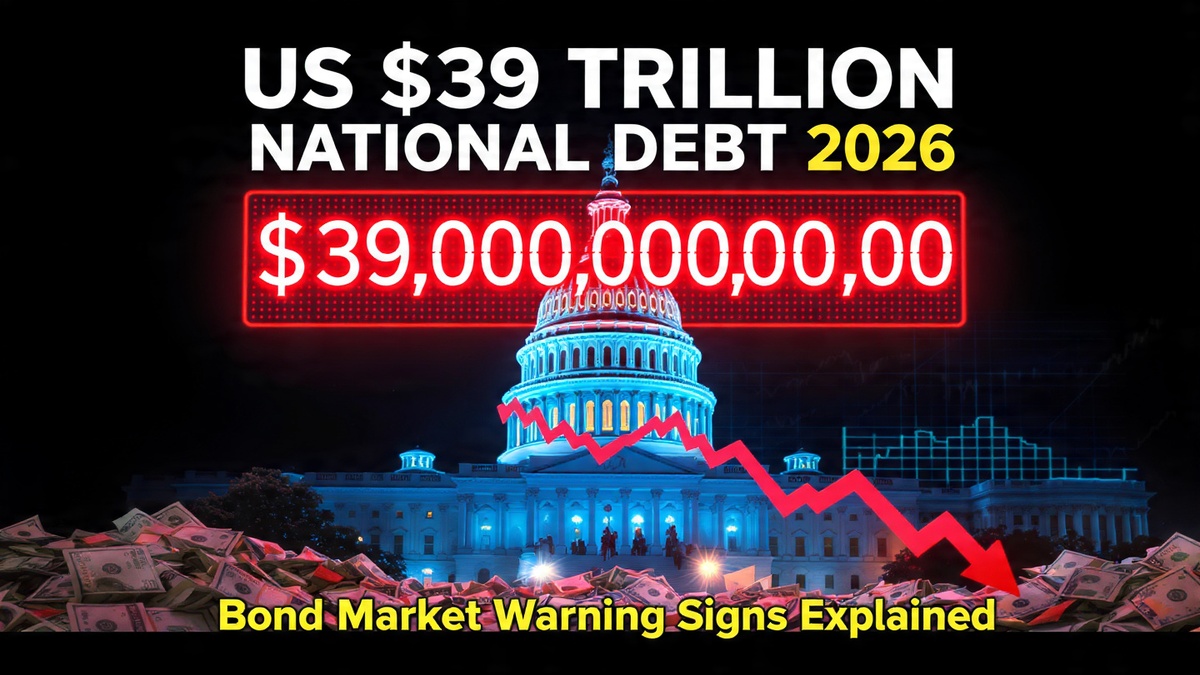
US national debt has crossed $39 trillion, bond yields are spiking, and Treasury auctions are showing soft demand. Here is what the bond market knows that Washington refuses to acknowledge.The United States crossed a number this year that no country in history has ever reached: $39 trillion in total federal debt. Not in inflation-adjusted terms. Not as a percentage of GDP. In raw dollars, the figure that sits on the public ledger of the world’s largest economy grew by $1 trillion in five months and $2 trillion in seven and a half months—and it is not slowing down.
What makes the velocity of that accumulation remarkable is the context in which it occurred. The Iran war added direct military expenditure at a pace that budget analysts said was accelerating. The 2025 tax cuts continued to erode revenue. And rising interest rates—the same rates the Federal Reserve is now signaling it may push higher still—are compounding the cost of servicing all that outstanding debt in a feedback loop that the bond market has quietly begun to price.
What the Auctions Are Saying
The most direct readout of market confidence in U.S. fiscal sustainability is the Treasury auction market, where the government sells new debt every week. Recent auctions have produced signals that bond investors usually describe in muted, technical language—but the direction is consistent.
A recent three-year Treasury auction cleared at 4.192%, well above the 3.965% at the prior auction. Yields rise when demand is soft. Soft demand at U.S. Treasury auctions is not a crisis signal—these are still among the most liquid securities in the world—but the trend line is one that fixed-income analysts at institutions ranging from J.P. Morgan to the Council on Foreign Relations have flagged as requiring close attention.
Foreign investors currently hold just above 30% of the Treasury market. Alarm bells rang briefly after April 2025’s Liberation Day tariffs—when U.S. bonds, equities, and the dollar all sold off together, the rarest of Wall Street trifectas—but subsequent data showed no dramatic reallocation away from Treasuries by foreign holders. That relative stability, however, depends on the continuation of conditions (a strong dollar, a functioning petrodollar system, geopolitical faith in U.S. institutions) that several of those conditions’ own architects now question.
The Interest Payment Problem
Of that $39 trillion, roughly $31.4 trillion is held by the public—the portion traded in financial markets globally. At current yields, the annual interest cost the U.S. government pays is on track to exceed $1 trillion for the first time in the country’s history. That figure is not a forecast. It is an arithmetic consequence of the debt level and the rate environment.
For context: U.S. defense spending in 2026 is approximately $900 billion. The federal government will spend more on interest payments than on the entire military. More than on Medicaid. More than on all discretionary non-defense programs combined. That structural reality constrains fiscal policy in ways that economists at the Deloitte Center for Financial Services have described as the most significant long-term challenge facing the U.S. economy.
“Higher bond yields affect U.S. fiscal dynamics in a number of ways,” analysts at the Council on Foreign Relations noted in their examination of tariff and Treasury interactions. “As interest payments on debt increase and use a greater share of available government funds, policymakers become more constrained around other fiscal priorities. They also can be more challenged when they need to respond to economic shocks.”
Three Credit Downgrades, Zero Course Correction
The United States has now been downgraded by all three major credit ratings agencies: S&P in 2011, Fitch in 2023, and Moody’s in May 2025. Each downgrade arrived with similar language—concerns about fiscal trajectory, political dysfunction over the debt ceiling, and a structural unwillingness to match revenues with spending. Each was followed by a brief market convulsion and then, effectively, nothing. Congress did not respond. The debt continued growing.
That pattern—of consequences being absorbed rather than heeded—is what makes the current moment structurally different from prior debt discussions, according to analysts who study sovereign fiscal crises. In those prior episodes, the U.S. still had room to maneuver: rates were low, the global appetite for dollar-denominated safe assets was rising, and alternative reserve currencies were even less credible than they are today. The margin for error has narrowed on all three dimensions.
The Political Ceiling on Solutions
The challenge is not primarily economic—it is political. Addressing a $39 trillion debt requires some combination of higher revenues, lower spending, or both. In the current Washington environment, tax increases are politically radioactive for one party and spending cuts face equivalent resistance from the other—particularly for the entitlement programs (Social Security, Medicare, Medicaid) that account for the largest share of mandatory outlays.
Markets have not yet priced the national debt as an immediate crisis, as analysts at U.S. Bank noted in their midyear market review: investors continue to watch whether rising debt eventually requires higher interest rates to attract enough Treasury buyers. The passive construction of that sentence—”continue to watch”—captures the market’s posture precisely. It is waiting. It is not yet acting.
The bond market’s message, in the language of Treasury yields and auction results, is being sent in increments rather than in a single shock. Washington is not listening. The question is not whether the message will eventually become impossible to ignore—it is how high rates must rise, and how much growth must slow, before the political system treats the ledger as a constraint rather than an abstraction.
Discover more from The Economy
Subscribe to get the latest posts sent to your email.

The US economy is expanding but sending mixed signals in mid-2026. Here are the four threats that could tip it into recession — and how investors and households can prepare.The US economy is, by most conventional measures, still growing. GDP expanded 1.6% in Q1 2026. The Federal Reserve Bank of Atlanta’s GDPNow model pointed to stronger second-quarter growth. The labour market has surprised three consecutive months to the upside. Goldman Sachs trimmed its recession probability estimate to just 15% following the US-Iran ceasefire agreement.
And yet something feels wrong.
Inflation sits at 4.2% year-over-year — its highest reading in three years. The Federal Reserve just delivered its most hawkish signal in years, with nine officials projecting rate hikes in 2026. Consumer spending rose just 0.1% in April, while the savings rate fell from 3.6% to 2.6%. Credit card delinquencies are rising. The AI bull market is running almost entirely on anticipation.
“The economy is literally moving at two speeds,” said David Schneider, a certified financial planner and president of Schneider Wealth Strategies. “Businesses and affluent households are stimulating growth, fuelled by AI spending and record asset prices, while the average person is increasingly anxious and financially exhausted.”
That bifurcation is not a sign of health. It is a sign of fragility.
The Four Threats That Could Tip the US Into Recession
Threat 1: Policy and Geopolitical Shocks
The Trump administration’s tariff regime — which lifted the effective tariff rate from 2.1% to an estimated 11.7% as of January 2026 — has created sustained uncertainty for businesses, consumers, and investors alike. Evidence suggests that more than 50% of these tariff costs have been passed through to consumers, adding a meaningful burden to household budgets that was not present two years ago. A 10% global baseline tariff remains in effect following the Supreme Court’s rejection of many of the more aggressive executive tariff actions.
The US-Iran war — which began on February 28 with airstrikes by the US and Israel — added an acute geopolitical shock on top of this chronic policy uncertainty. The Strait of Hormuz closure drove oil prices above $120 per barrel, fed directly into headline inflation, and complicated the Federal Reserve’s ability to normalise policy.
The 60-day ceasefire framework provides temporary relief, but a resumption of hostilities — or any new Middle East escalation — would rapidly reverse the oil price decline and reignite inflationary dynamics.
Threat 2: The Fed’s Inflation Dilemma
The Federal Reserve has tolerated inflation above its 2% target for five consecutive years. But Kevin Warsh’s debut as Fed chair in June 2026 signalled a clear shift: the Fed’s patience with above-target inflation appears to be ending.
The dilemma is acute. Raising rates aggressively to bring inflation from 4.2% to 2% risks choking off the economic growth that is sustaining employment and corporate earnings. Not raising rates risks allowing inflation expectations to become unanchored, which would ultimately require far more aggressive tightening later.
Bank of America now projects three quarter-point hikes by year-end, lifting the federal funds rate to 4.25%–4.50%. Each 25 basis point increase adds approximately $6–8 billion annually to US government debt servicing costs at current debt levels — a fiscal dynamic that compounds over time.
For households, the transmission is more direct: mortgage rates, credit card APRs, and auto loan costs all respond to the federal funds rate, directly squeezing discretionary spending.
Threat 3: Consumer Exhaustion
The American consumer has been the engine of post-pandemic growth. But that engine is increasingly sputtering.
Personal consumption expenditures rose just 0.1% in April 2026 — barely above zero. The personal savings rate fell to 2.6%, down from 3.6% the previous month — a level that implies consumers are drawing down savings to maintain spending levels. Rising delinquency rates on credit cards and auto loans suggest the pressure is not confined to lower-income households.
“Cracks beneath the surface — rising delinquencies and slowing job growth — could compound the effects on an already stressed consumer,” noted one investment strategist at a major asset manager.
High interest rates throughout 2024 and 2025 have eroded household balance sheets. Many consumers entered 2026 carrying record debt loads at elevated interest rates. Any additional shock — from higher energy costs, a job market softening, or rising borrowing costs — could trigger a spending contraction that is far harder to reverse than it was to initiate.
Threat 4: The AI Bubble
Artificial intelligence is simultaneously the most important driver of 2026 economic optimism and its most significant latent risk.
The Stanford Institute for Economic Policy Research identified AI as a central concern in its 2026 economic outlook, noting that “concerns about an artificial intelligence bubble” represent a material tail risk for the broader market. The Centre for Economic and Policy Research has gone further, launching an “AI Bubble Monitor” to track signs of speculative excess across AI-related valuations and capital deployment.
The SpaceX IPO at $2 trillion, OpenAI’s confidential S-1 filing at $1 trillion-plus, and Anthropic’s $965 billion pre-IPO valuation collectively represent approximately $3.8 trillion in market capitalisation targeting a public investor base. If AI companies prove unable to monetise their infrastructure investment at the pace their valuations require — a scenario that their current cash-flow realities make plausible — the resulting correction could cascade through technology equities, credit markets, and the broader economy in ways that are difficult to model.
The AI tail risk is not that the technology fails. It is that the business models required to justify current valuations take a decade longer to mature than current investor timelines anticipate.
What the IMF Is Saying
The International Monetary Fund revised its 2026 global growth forecast to 3.1%, down from 3.4% in 2025, in its April World Economic Outlook. The IMF framed the downgrade around three interlocking risks: the Middle East conflict, trade uncertainty, and inflationary pressure — the same factors defining the US domestic outlook.
Emerging market growth is expected to slow disproportionately, particularly in conflict-proximate economies and those with high external debt vulnerabilities. Advanced economies, including the US, are expected to see “more moderate, though still subdued” slowdowns.
Goldman Sachs, for its part, cut its US recession probability to 15% after the ceasefire agreement — a number that reflects genuine resilience in the data but leaves meaningful probability mass on the downside scenario.
Mixed Signals: Growth and Fragility Coexisting
The current US economic picture is genuinely unusual. Two opposing realities are simultaneously true:
Signs of Resilience:
- GDP grew 1.6% in Q1 2026
- Non-farm payrolls surprised to the upside for three consecutive months
- The three-month average of private payrolls reached 166,000 — its highest since June 2023
- Corporate earnings have generally remained resilient
- AI-related capital expenditure continues to support investment
Signs of Strain:
- Inflation at a three-year high of 4.2%
- Consumer spending barely above zero in April
- Savings rate falling to 2.6%
- Rising credit card and auto loan delinquencies
- A Fed now signalling tightening rather than relief
The outcome of 2026 will depend on whether the top-heavy spending — concentrated among businesses and affluent households — can continue to compensate for the exhaustion of median households. History suggests this divergence has limits.
How to Protect Your Portfolio and Finances
For Investors
Diversify away from concentrated AI exposure. The Magnificent Seven have outperformed for three consecutive years on AI enthusiasm. If AI valuations compress — whether from a bubble pop or simply from normalisation — concentrated positions in technology equities carry significant downside.
Increase fixed-income exposure cautiously. With rates potentially rising further, bond prices face near-term headwinds. But shorter-duration Treasuries and investment-grade corporate bonds offer yields that have not been available since 2007.
Consider defensive equity sectors. Healthcare, utilities, and consumer staples have historically outperformed in late-cycle environments and provide some protection against both inflation and a growth slowdown.
Maintain a gold allocation. As discussed, gold remains the most reliable hedge against the simultaneous risks of inflation, dollar weakness, and geopolitical shock.
For Households
Pay down floating-rate debt. If the Fed raises rates further, credit card APRs and home equity lines of credit will become more expensive. Every percentage point of variable-rate debt eliminated before tightening reduces exposure.
Build your emergency fund. A 2.6% savings rate implies the median American household has limited buffer for an income disruption. Three to six months of expenses in liquid savings provides the cushion that prevents a job loss or unexpected expense from becoming a financial crisis.
Lock in fixed-rate borrowing. If you are considering a mortgage or auto loan, a fixed-rate product eliminates the tightening risk that variable-rate instruments carry into an uncertain rate environment.
The Bottom Line
A US recession in 2026 is not the base case — Goldman’s 15% probability estimate captures the consensus. But the combination of elevated inflation, a hawkish Fed, exhausted consumers, geopolitical fragility, and an AI valuation premium built on unproven cash flows creates a risk profile that warrants genuine preparation rather than complacency.
The US economy is not heading off a cliff. But it is walking close enough to the edge that the positioning decisions made now — by investors, households, and policymakers — will materially determine how the second half of 2026 unfolds.
FAQs
Q: Will there be a recession in 2026?
A: As of late June 2026, a recession is not the base case. Goldman Sachs puts the probability at 15% following the US-Iran ceasefire. However, the combination of 4.2% inflation, a hawkish Fed, slowing consumer spending, and AI valuation risks creates a meaningful tail risk.
Q: What are the warning signs of a US recession in 2026?
A: Key indicators to watch include consumer spending growth slowing below zero, credit delinquency rates rising, the unemployment rate climbing, the yield curve inverting further, and any significant AI-related market correction.
Q: What is US GDP growth in 2026?
A: US GDP grew 1.6% in Q1 2026. The Federal Reserve Bank of Atlanta’s GDPNow model pointed to stronger Q2 growth, but the full-year outlook depends heavily on whether the Fed tightens further and how the consumer holds up.
Q: How do I protect my money in a potential recession?
A: Key steps include reducing floating-rate debt, building an emergency fund of 3–6 months of expenses, diversifying equity exposure away from concentrated AI positions, and maintaining a gold allocation as an inflation and safe-haven hedge.
Discover more from The Economy
Subscribe to get the latest posts sent to your email.

AI Infrastructure Debt Bubble 2026: $570 Billion in Global Debt Issuance Raises Systemic Risk Alarm

Argentina Economy 2026: Milei’s Fiscal Surplus, Inflation Drop to 29%, and What Comes Next

Global Economic Growth 2026: World Bank Cuts Forecast to 2.5%

Gold Price 2026: J.P. Morgan Forecasts $6,000/oz as Inflation, Iran War

US Section 301 Tariffs 2026: 60 Countries Face 12.5% Duties on Forced Labour Goods

China Economy 2026: 87% Semiconductor Surge, Property Crisis

Kevin Warsh Fed 2026: Rate Hold, Hawkish Dot Plot, and the End of Forward Guidance

SpaceX IPO 2026: $2 Trillion Valuation, Retail Frenzy, and the Risks

Oracle AI Debt Crisis 2026: $130 Billion Gamble Triggers Worst Stock Crash Since Dot-Com Bust

Male Labor Force Participation Rate 2026: Why Men Are Leaving & Economic Impact

Trump Tariffs 2026: Economic Impact, Household Costs & Trade War Outlook

China Economy 2026: Export Boom Masks Property Crisis & Investment Slump

US Inflation 4% May 2026: Is the Worst Over? Fed, Oil Prices

AI Memory Chip Shortage 2026: Nvidia, Apple & What Comes Next

PwC China Partner Payouts Cut Amid Evergrande Audit Fraud

Broadcom Market Value Loss: Revenue Forecast Disappoints

Investors Pile Into Bullish Dollar Bets as ‘US Exceptionalism’ Trade Returns

Here’s How Much It’ll Cost You to Be Part of SpaceX’s Record-Breaking $75 Billion IPO

Nasdaq Tumbles 4% as Chip and Memory Stocks Sink: A $1.2 Trillion Wipeout

How to Fix Pakistan’s Debt Economy: A Structural Blueprint

Smash Capital Leads $200M Funding for Allen Control Systems

Democrats Draw a Red Line Around Military AI — And the Pentagon Is Already Pushing Back

New Investment Super-Cycle: AI, Green Energy & Re-Shoring

Xponential Fitness Franchise Lawsuit: The $3.97M Judgment

Grinding the Already Ground: Pakistan’s Inflation Crisis

Middle East Conflict Oil Prices: The $4 Surge Explained

The End of the Chatbot: Why OpenAI is Tearing Up Its Most Successful Product

Musk’s SpaceX Lines Up Retail Investors for Record IPO Allocation
-

 Markets & Finance6 months ago
Top 15 Stocks for Investment in 2026 in PSX: Your Complete Guide to Pakistan’s Best Investment Opportunities
-

 Analysis4 months ago
Top 10 Stocks for Investment in PSX for Quick Returns in 2026
-

 Analysis5 months ago
Brazil’s Rare Earth Race: US, EU, and China Compete for Critical Minerals as Tensions Rise
-

 Analysis4 months ago
Johor’s Investment Boom: The Hidden Costs Behind Malaysia’s Most Ambitious Economic Surge
-

 Banks5 months ago
Best Investments in Pakistan 2026: Top 10 Low-Price Shares and Long-Term Picks for the PSX
-

 Investment6 months ago
Top 10 Mutual Fund Managers in Pakistan for Investment in 2026: A Comprehensive Guide for Optimal Returns
-

 Global Economy6 months ago
15 Most Lucrative Sectors for Investment in Pakistan: A 2025 Data-Driven Analysis
-

 Global Economy6 months ago
Pakistan’s Export Goldmine: 10 Game-Changing Markets Where Pakistani Businesses Are Winning Big in 2025