
Oil Markets
The US$100 Barrel: Oil Shockwaves Reach South-east Asia – And Could Hit $150

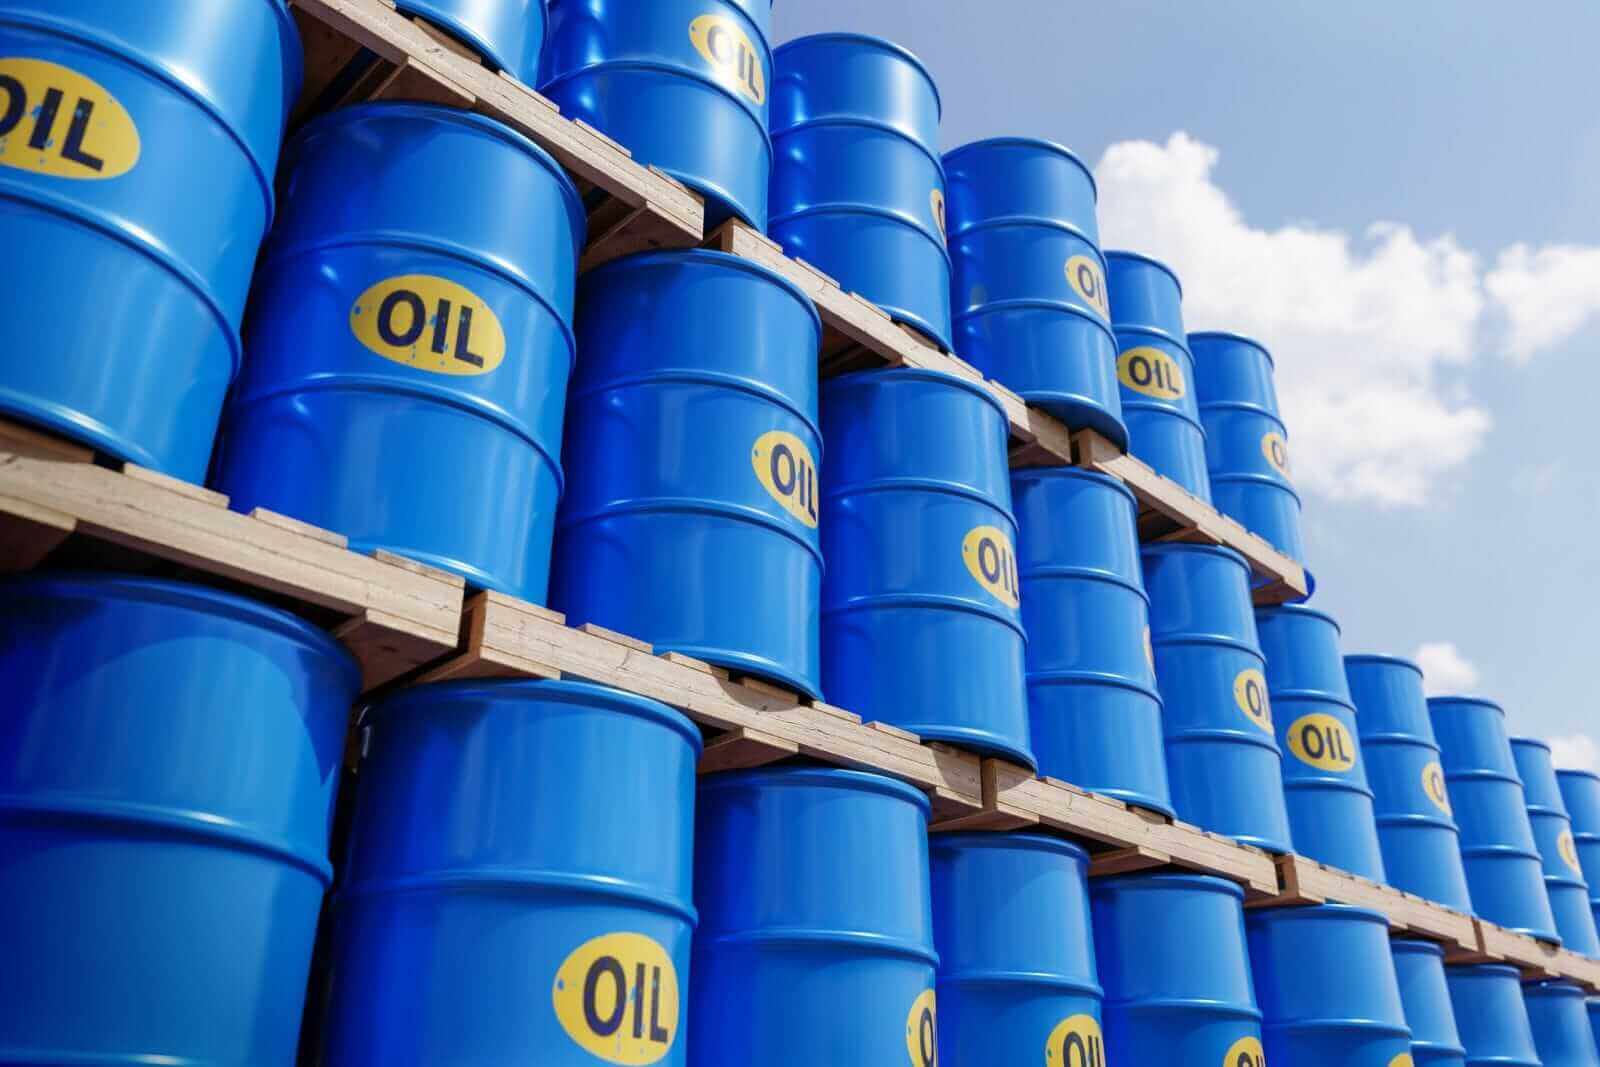
The ghost of 2022 is back to haunt the global economy, and its shadow looms darkest over Southeast Asia. As escalating conflict in the Middle East effectively shutters the Strait of Hormuz—the artery through which nearly 20% of the world’s oil flows—the price of Brent crude has violently surged past $114 a barrel, sending governments from Jakarta to Manila scrambling. This isn’t just a price spike; it’s a full-blown stagflationary shock threatening to derail the region’s fragile post-pandemic recovery, with some analysts now warning that $150 oil is no longer a distant fantasy.
The math is brutal. For every $10 increase in the price of oil, global GDP growth is trimmed by roughly 0.15 percentage points, while inflation gets a 0.4 percentage point boost. With oil jumping more than 25% in a matter of days, the impact is immediate and painful. From the Grab driver in Kuala Lumpur seeing his margins evaporate to the factory worker in Bangkok facing a higher cost of living, the US$100 barrel is a tax on everything. It’s a world of higher transport and food costs, ballooning fuel subsidy bills, and a gut-punch to consumer confidence.
From the Pump to the Plate: The Real-World Impact
The economic shockwave is radiating across the region, hitting each nation with unique force. The core issue is that most of Southeast Asia’s economies are massive net oil importers, leaving them dangerously exposed to global price swings.
- Philippines & Thailand: The Stagflation Crucible. These two nations are perhaps the most vulnerable. With a heavy reliance on imported energy, the pass-through to domestic inflation is rapid. The Thai baht and Philippine peso have weakened against a surging U.S. dollar, compounding the cost of imports. This leaves their central banks in an impossible position: raise rates to fight inflation and risk killing growth, or hold steady and watch purchasing power evaporate. Nomura has explicitly warned of a “stagflationary shock,” a toxic cocktail of stagnant growth and soaring prices that could lead to social and political instability.
- Malaysia & Indonesia: The Subsidy Black Hole. For years, these nations have used massive fuel subsidies to keep a lid on prices at the pump and maintain social harmony. But at over $100 a barrel, that strategy becomes fiscally ruinous. Indonesia’s Finance Minister has vowed to absorb the shock for now, but admits the state budget is under immense pressure. Malaysia, which was already planning to reform its subsidy program, now faces a monumental bill to shield its citizens. These subsidies, while politically popular, divert billions of dollars that could be spent on healthcare, education, and infrastructure.
- Singapore: A Crisis of Connectivity. As a global trade and finance hub with no natural resources, Singapore’s fate is tied to the free flow of goods and capital. While its direct energy consumption as a share of its economy is lower than its neighbors’, the island nation is hit by second-order effects. The effective closure of the Strait of Hormuz has thrown global shipping into chaos, with insurance premiums skyrocketing and vessels stranded. This spells higher costs for nearly everything Singapore imports and exports.
The Tourism Effect: Jet Fuel and Jittery Travelers
The oil shock extends beyond industry and into one of Southeast Asia’s most vital economic engines: tourism. The surge in crude prices directly translates to higher jet fuel costs, a major operating expense for airlines.
This pressure comes at a critical time for the region’s travel recovery. Destinations like Bali, Phuket, and Singapore, which have been banking on a strong 2026 travel season, now face the prospect of higher flight prices, which could deter long-haul visitors. Singapore has already moved to introduce a sustainable aviation fuel (SAF) levy for flights departing from Changi Airport starting this year, a necessary green step that will now be compounded by the oil price shock. The dream of an affordable tropical getaway is suddenly becoming more expensive, threatening to slow the flow of tourist dollars that support millions of jobs.
The Strait of Hormuz: A Geopolitical Powder Keg
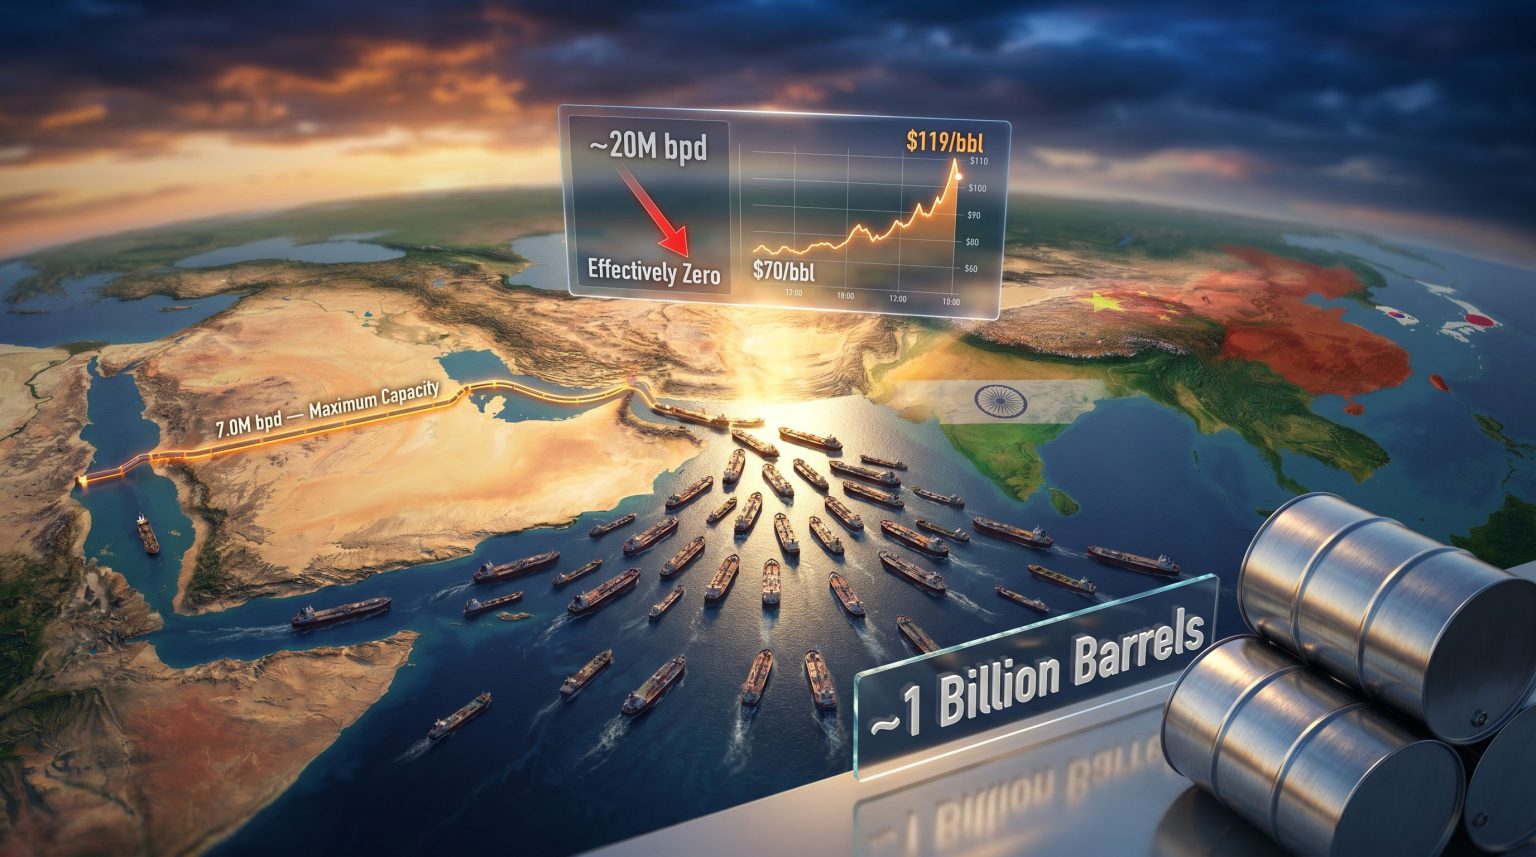
The source of this economic earthquake is the geopolitical standoff in the Middle East. The effective closure of the Strait of Hormuz, whether by direct military action or the refusal of insurers to cover vessels, has created a de facto blockade. With around 15-20 million barrels of oil per day suddenly at risk, the market has reacted with predictable panic.
Analysts at Goldman Sachs and the IMF have warned that a sustained disruption could be catastrophic. Goldman’s upside scenario sees oil hitting $100 per barrel and shaving 0.4 percentage points off global growth. More alarmist predictions, including from analysts at Bloomberg, suggest a prolonged closure could send oil hurtling toward $150 or even $200 a barrel, a level that would almost certainly trigger a global recession. The crisis is not just about oil; it’s also a fertilizer shock, as a significant portion of the world’s urea and other key agricultural inputs transit the strait, threatening global food security.
The Road Ahead: $150 Oil and Difficult Choices
Is $150 oil a real possibility? If the Strait of Hormuz remains effectively closed for more than a few weeks, the answer is a terrifying yes. The world simply does not have enough spare production capacity to cover a shortfall of this magnitude.
This leaves Southeast Asian policymakers with a menu of painful options:
- Let prices float: Pass the full cost to consumers and businesses, risking mass public anger and a sharp economic contraction.
- Subsidize: Continue to burn through fiscal reserves to cap prices, mortgaging the future for short-term stability.
- Accelerate the green transition: Use the crisis as a catalyst to double down on renewable energy, electric vehicles, and energy efficiency. This is the long-term solution, but it provides little relief in the short run.
The US$100 barrel is more than a headline; it’s a structural shock that exposes the deep vulnerabilities of our globalized, fossil-fuel-dependent economy. For Southeast Asia, the coming months will be a brutal test of economic resilience, political will, and social cohesion. The shockwaves are already here, and the tsunami may be yet to come.
FAQs(FREQUENTLY ASKED QUESTIONS)
1. How does the Strait of Hormuz disruption affect Southeast Asia?
The Strait of Hormuz is a critical chokepoint for global oil shipments. Its closure disrupts supply, causing prices to surge. Since most Southeast Asian nations are net oil importers, they are forced to pay significantly more for energy, which drives inflation, strains government budgets, and slows economic growth.
2. Which countries in Southeast Asia are most at risk from $100 oil?
The Philippines and Thailand are considered highly vulnerable due to their heavy dependence on imported energy and the potential for a “stagflationary shock” (high inflation and low growth). Malaysia and Indonesia face massive fiscal pressure from their large fuel subsidy programs.
3. Could oil prices really reach $150 a barrel?
Analysts believe that if the disruption in the Strait of Hormuz is prolonged, oil prices could indeed spike to $150 or higher. This is because there is not enough spare oil production capacity globally to make up for the millions of barrels per day that transit the strait.
Discover more from The Economy
Subscribe to get the latest posts sent to your email.


Pakistan’s petrol price hit Rs. 316.15 per litre by mid-July 2026 as global crude climbed toward $89 a barrel following disruption in the Strait of Hormuz. The IMF has held Pakistan’s FY2026 growth forecast at 3.5%, warning that a wider Middle East conflict could trigger further price volatility — squeezing a government already bound by strict Extended Fund Facility (EFF) spending limits.
The story underneath the pump-price headlines
Pakistani business media has covered the weekly petrol price revisions extensively. What’s been under-examined is the macro trap those revisions represent: Islamabad is caught between political pressure to subsidise fuel and an IMF programme that leaves almost no room to do so — a bind that has already produced one failed negotiation this year.
The numbers driving the squeeze
The IMF’s July update to its World Economic Outlook kept Pakistan’s growth forecast unchanged at 3.5% for the new fiscal year, even as it flagged the risk of renewed Middle East conflict fuelling further price volatility. The Fund’s average petroleum spot price index is now projected at $89 a barrel — 9% above its earlier reference forecast — after crude jumped roughly $8 a barrel within two trading days once the US withdrew Iran’s oil-export waivers and struck Iranian targets (Express Tribune).
That pass-through has been immediate at the pump. Petrol in Pakistan rose to Rs. 316.15 per litre and diesel to Rs. 354.35 per litre by July 18, with the Oil and Gas Regulatory Authority (OGRA) shifting from fortnightly to weekly price reviews to keep pace with global crude swings (PetrolPrice.com.pk; MashriqTV).
Why Islamabad can’t simply subsidise its way out
Pakistan remains under strict IMF supervision through its Extended Fund Facility, which sharply limits the government’s room to cushion consumers from global price shocks. Economist Kaiser Bengali, former adviser for planning and development to the Sindh chief minister, has described the arrangement bluntly: a single $1 billion IMF tranche — trivial by global fiscal standards — can be the difference between stability and crisis for Pakistan’s external accounts (Al Jazeera).
The government has already been burned attempting to work around this constraint. Earlier this year it sought IMF approval for higher fuel subsidies and was rebuffed, a negotiating misstep analysts have criticised as poorly handled given how little fiscal slack the programme allows (Al Jazeera).
The FY26-27 budget math
Pakistan’s FY2026-27 budget is explicitly framed as a pivot from “stabilization to growth” under the IMF programme, targeting 4% GDP growth, 8.2% inflation and a 3.6% fiscal deficit. But sector analysts at the Pakistan & Gulf Economist note the entire framework is contingent on oil prices behaving: if crude continues climbing, the fiscal deficit will widen, pressuring government borrowing and forcing tighter monetary policy in response (Pakistan & Gulf Economist). Separate estimates put the FY26 consolidated fiscal deficit in the 4.0-4.5% of GDP range — already above the IMF’s 4.0% target before accounting for the latest oil shock (Dawn).
The political cost
The squeeze has visible street-level consequences. Rickshaw drivers in Lahore staged protests against rising fuel costs during the earlier phase of the US-Iran conflict, a preview of the public frustration that further price hikes risk reigniting (Al Jazeera). With inflation forecast by the IMF to climb globally from 4.1% in 2025 to 4.7% in 2026 before easing to 3.9% in 2027, Pakistan’s own disinflation trend — which had been improving since early 2024 — now risks stalling in step with the wider global pattern (Express Tribune).
The one offsetting factor
Not every signal points downward. The IMF noted that part of the reduction in oil flows through Hormuz has been offset globally by inventory drawdowns, which has kept the overall price increase more muted than a pure supply-shock model would predict (Express Tribune). And Pakistan’s rupee has shown relative stability against the US dollar through 2026, which — if sustained — would partially cushion import costs regardless of what happens to global crude (PetrolPrice.com.pk).
The bottom line
Pakistan’s economic trajectory for FY27 now depends on a variable no domestic policymaker controls: how long the Strait of Hormuz disruption persists. With IMF conditionality removing the traditional subsidy lever and the rupee’s stability doing much of the defensive work, Islamabad’s fiscal room for manoeuvre this cycle is as narrow as it has been at any point in the current EFF programme.
Discover more from The Economy
Subscribe to get the latest posts sent to your email.
Gulf oil producers are fast-tracking at least seven new or expanded pipelines — from Iraq’s Kirkuk-Baniyas line through Syria to the UAE’s second Fujairah link — to move up to 14 million barrels a day around the Strait of Hormuz by 2028, after renewed Iranian tanker attacks halved Iraqi output and pushed Brent crude above $84 a barrel.
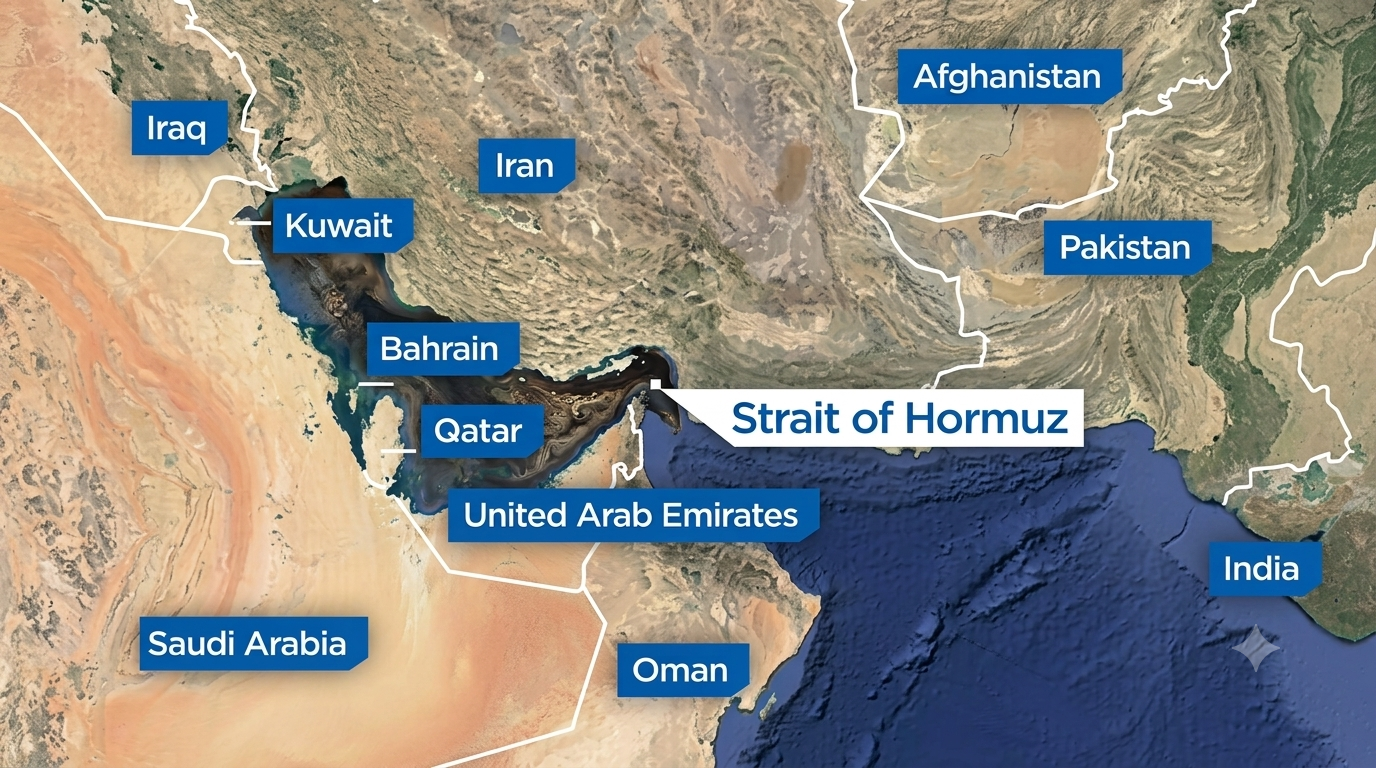
For decades, the Strait of Hormuz has been the single most consequential 33 kilometres of water in the global economy — the channel through which roughly a fifth of the world’s oil has passed on its way from the Gulf to refineries in Rotterdam, Singapore and Karachi. That geography is now being actively engineered away.
Why this is the story competitors are missing
Most coverage of the Hormuz crisis has focused narrowly on tanker attacks and day-to-day Brent price swings. The bigger, under-reported story is structural: a permanent reshaping of Middle East export infrastructure that will outlast the current conflict and change how nine-market economies — from Pakistan to Singapore to the UK — plan their energy security for the next decade.
What triggered the scramble
Iran’s attacks on commercial vessels this month forced a sharp slowdown in Hormuz shipping, prompting two days of US strikes on Iranian military targets and reinforcing what shipbrokers describe as a “stop-start” pattern of disruption likely to persist (AGBI). The damage to Iraq has been severe: OPEC’s second-largest producer saw output fall from roughly 4.2 million barrels per day in February to about 1.9 million bpd by June, since Baghdad depends almost entirely on its southern Basra terminals with few pipeline alternatives (CNBC).
Brent crude climbed to around $84 a barrel, up from $76 before the latest escalation, according to reporting from Abu Dhabi (The National). Analysts at Goldman Sachs warn prices could push toward $100 or higher if disruptions persist (Carra Globe).
The pipeline build-out, country by country
Iraq–Syria: Washington is backing efforts to revive the Kirkuk-to-Baniyas pipeline to Syria’s Mediterranean coast, dormant since it was damaged during the 2003 US invasion. US energy officials signed a formal agreement in Washington, with Chevron among the companies exploring involvement in construction (Marketplace; Bloomberg). Even fully restored, the line would carry only around 2 million bpd — a fraction of the roughly 20 million bpd that normally transits Hormuz when fully open, but a meaningful hedge nonetheless.
Iraq–Jordan: Baghdad and Amman have revived a 2013-era plan for a pipeline linking Basra to the Jordanian port of Aqaba, discussed at a trilateral meeting involving US special envoy Tom Barrack (The National).
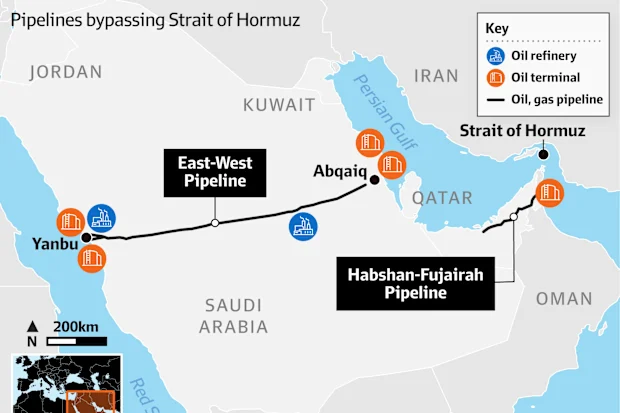
UAE: Abu Dhabi is doubling the capacity of its pipeline to the Port of Fujairah on the Gulf of Oman, which sits outside the strait entirely.
Saudi Arabia: Riyadh is weighing an expansion of its East-West pipeline to the Red Sea port of Yanbu by as much as 2 million bpd.
Taken together, Goldman Sachs analysts estimate the region’s Hormuz-bypass pipeline capacity could exceed 14 million bpd by the end of 2028 — more than 60% of the Gulf states’ pre-war export volume of roughly 23 million bpd (CNBC).
The catch: pipelines aren’t a shield
Analysts caution the infrastructure build-out will not eliminate Iran’s leverage. New pipelines remain just as exposed to the low-cost, asymmetric drone and missile attacks that have already targeted tankers inside the strait, according to shipping analysts quoted by CNBC. Lloyd’s List editor-in-chief Richard Meade notes the disruption has exposed the absence of any durable, long-term framework for managing the strait itself (AGBI).
The nine-market ripple effect
Pakistan is arguably the most exposed of the nine markets in this analysis outside the Gulf itself. Islamabad formally requested Saudi Arabia supply oil via the Red Sea Yanbu route in March, as Karachi refineries scrambled for alternatives to Hormuz-transiting cargo (Carra Globe). Pakistani pump prices have been revised weekly rather than fortnightly to keep pace with volatility, with petrol hitting Rs. 316.15 per litre by mid-July (PetrolPrice.com.pk).
The UAE and Dubai face the sharpest logistics squeeze on the container-shipping side: Jebel Ali, the world’s ninth-largest port and the primary transshipment hub for the Middle East, East Africa and South Asia, is experiencing mounting congestion as vessels reroute around the Cape of Good Hope, adding 10–14 days and materially higher fuel costs to Asia-Europe voyages (Carra Globe).
Singapore, as Asia’s dominant refining and bunkering hub, sits on the receiving end of both higher freight costs and longer transit times for Gulf crude — a dynamic compounding the cost pressures already facing the city-state’s trade-dependent economy.
The UK, as a net oil importer since North Sea output decline, is exposed through global benchmark pricing rather than direct route disruption, but Brent — priced internationally — flows straight into UK pump and industrial energy costs regardless of which pipeline barrels ultimately take.
The bottom line
This is no longer simply a story about tanker attacks — it is the early architecture of a post-Hormuz energy order that Gulf states, Washington and Asian importers alike are building in real time, barrel by barrel, pipeline by pipeline. For businesses and policymakers across the nine markets covered here, the operative question by 2027 will not be whether Hormuz reopens fully, but how much of the world’s oil no longer needs it to.
Discover more from The Economy
Subscribe to get the latest posts sent to your email.
Analysis
The Hidden Cost of the Hormuz Standoff: Why “Sea Gunk” Is the Shipping Industry’s Next Billion-Dollar Problem
Tankers stranded in the Persian Gulf during the US-Iran conflict have sat idle long enough for warm-water barnacles, algae and marine growth to colonize their hulls, a phenomenon known as biofouling. This is now forcing costly dry-dock cleaning, slowing vessel speeds, raising fuel burn and pushing up war-risk insurance premiums — a knock-on cost of the conflict that has received far less attention than headline oil prices.
An Underreported Consequence of the Standoff
Most coverage of the US-Iran conflict has focused on oil prices and the risk of a full closure of the Strait of Hormuz, through which roughly a fifth of the world’s seaborne crude normally passes. Less visible is a slower-moving, equally costly problem: ships that have been anchored or rerouted for weeks are now dealing with heavy hull fouling. Specialist “bottom cleaner” crews are being dispatched to scrape off marine growth that has attached itself to tankers stranded in the warm waters of the Persian Gulf, according to reporting on the scale of the buildup facing vessels caught in the standoff (CNN Business).
Biofouling is not a cosmetic issue. A fouled hull increases drag, which raises fuel consumption by as much as 20–40% depending on severity, according to maritime engineering estimates cited across shipping-industry literature. For an industry already absorbing higher war-risk premiums, the added fuel and dry-docking costs compound an already expensive standoff.
Where the Standoff Stands Now
By early July, daily oil flows through the Strait had recovered to more than 10 million barrels a day, with Saudi and UAE crude exports running at roughly 90% of pre-war levels, according to a review of shipping data by UK Finance. That recovery has helped push Brent crude down roughly 40% from its April peak. But the fact that flows are recovering doesn’t erase the weeks of disruption already priced into contracts, insurance renewals and vessel maintenance schedules.
Bank of England Governor Andrew Bailey has flagged this lag effect directly, noting that even as spot oil prices fall, “the higher energy prices of the past four months mean there’s already some inflationary pressure in the pipeline” for consumer economies (Hanbury Wealth Economic Review).
Why This Matters Beyond Shipping
The biofouling problem is a useful proxy for a broader truth about the Hormuz conflict: its costs are not confined to the headline price of a barrel of oil. They show up in:
- Insurance markets — War-risk premiums for Gulf transits have risen sharply and are only slowly normalizing as underwriters reassess vessel-specific risk.
- Fuel and emissions costs — Fouled hulls burn more bunker fuel, an expense that ultimately filters into freight rates and consumer goods prices.
- Dry-dock capacity — A surge in demand for emergency hull cleaning is straining specialist marine services capacity in Gulf ports.
- Second-round inflation — Central banks in energy-importing economies, including the UK, have explicitly built these lagged supply-chain effects into their inflation forecasts for the second half of 2026 (Bank of England, June 2026 Monetary Policy Summary).
The Bigger Picture for Trade-Dependent Economies
Economies with heavy exposure to Gulf shipping lanes — the UK, Singapore, and the broader Gulf states themselves — are watching this unwind carefully. Singapore’s own trade ministry has explicitly cited the conflict as a downside risk to its 2026 growth forecast even as second-quarter GDP beat expectations (CNBC). Dubai, meanwhile, has continued to post resilient non-oil growth, insulated somewhat by economic diversification away from hydrocarbons (Gulf Business).
For freight forwarders, insurers and importers, the lesson of the biofouling episode is that Gulf conflict risk doesn’t disappear the moment a ceasefire is announced — it lingers in maintenance backlogs, insurance renewal cycles and fuel cost pass-through for months afterward.
Key Takeaways
- Prolonged vessel idling in the Persian Gulf has created a costly biofouling problem now requiring emergency hull-cleaning operations.
- Oil flows through Hormuz have largely recovered, but the inflationary “pipeline effect” of the disruption is still working through import-dependent economies.
- Central banks, including the Bank of England, have explicitly incorporated lagged energy-shock effects into their 2026 inflation forecasts.
- Trade hubs like Singapore and Dubai are tracking the conflict’s tail risks even as headline growth figures remain strong.
Discover more from The Economy
Subscribe to get the latest posts sent to your email.

Canada Trade Diversification 2026: China, Indonesia, UAE Deals Explained

US Forced-Labour Tariffs on 60 Countries: The Hidden Trade Shock of 2026

Global Central Banks 2026: Fed, BoE and BoJ Decisions Could Reshape Markets

Gulf Capital Retreat From Pakistan 2026: UAE Loan Freeze & What It Means

Pakistan’s Most Reliable Export Is Its People: Remittances Hit $41.6 Billion, Overtaking Total Exports

Indonesia’s Confidence Problem: Record Investment, a Sinking Rupiah, and a Widening Credibility Gap

Down But Not Out: Inside the Slow Sinking of Russia’s War Economy

China’s Growth Slips to a Four-Year Low: Why Beijing Still Won’t Pull the Stimulus Trigger

The Johor-Singapore Corridor: How Malaysia Became Southeast Asia’s AI Infrastructure Powerhouse

Canada’s Economy ‘On Pause’: Inside the CUSMA Deadline That Passed Without a Deal

Dubai’s Millionaire Magnet: How the UAE Turned Middle East Turmoil Into a Capital Safe-Haven Boom

Britain’s Sixth Prime Minister in a Decade: What Starmer’s Exit Means for Gilts, Sterling and Your Portfolio

Anthropic Offers Up to $600,000 Salary for Critical IPO Role as AI Giant Prepares for Wall Street Debut

EU Readies Crisis Team for Potential China Rare Earths Stand-Off as Supply Chain Risks Mount

Carry Trade Unwind 2026: How the Yen’s Snapback Triggered a Global Margin Call

AI Bubble Warning 2026: Why BIS, IMF and Bank of England Fear a Market Crash

BRICS De‑Dollarization Strategy Takes Shape with $15 Billion Local‑Currency Push

The AI Super Bubble Is Ready to Burst

Russia Bans Diesel Exports 2026: Global Fuel Market Impact Explained

Strait of Hormuz Blockade 2026: Oil Prices Surge 9% as US-Iran Conflict Reignites

Private Credit Warning: Most BDCs Turn Unprofitable in 2026, Reuters Finds

IMF Cuts Pakistan Growth Forecast, Raises Inflation to 8.4%

Bitcoin $150k Milestone Achieved as US Sovereign Crypto Pivot Looms
Gulf Capital Retreat From Pakistan 2026: UAE Loan Freeze & What It Means

India Economic Rise 2026: How the Subcontinent Toppled Japan

Strait of Hormuz 2026: Why Markets Still Don’t Trust It’s Open

Argentina Economy 2026: Milei’s Fiscal Surplus, Inflation Drop to 29%, and What Comes Next

China Housing Market Turnaround: White‑List Model Stabilises Prices
-

 Markets & Finance7 months ago
Top 15 Stocks for Investment in 2026 in PSX: Your Complete Guide to Pakistan’s Best Investment Opportunities
-

 Analysis5 months ago
Johor’s Investment Boom: The Hidden Costs Behind Malaysia’s Most Ambitious Economic Surge
-

 Analysis5 months ago
Top 10 Stocks for Investment in PSX for Quick Returns in 2026
-

 Analysis6 months ago
Brazil’s Rare Earth Race: US, EU, and China Compete for Critical Minerals as Tensions Rise
-

 Banks6 months ago
Best Investments in Pakistan 2026: Top 10 Low-Price Shares and Long-Term Picks for the PSX
-

 Investment7 months ago
Top 10 Mutual Fund Managers in Pakistan for Investment in 2026: A Comprehensive Guide for Optimal Returns
-

 Global Economy7 months ago
15 Most Lucrative Sectors for Investment in Pakistan: A 2025 Data-Driven Analysis
-

 Global Economy7 months ago
Pakistan’s Export Goldmine: 10 Game-Changing Markets Where Pakistani Businesses Are Winning Big in 2025