
Business
State Farm Mails Record $5 Billion Dividend to Auto Policyholders: How to Claim Your Check

State Farm is distributing a historic $5 billion auto insurance dividend to 2025 policyholders, averaging $100 per vehicle—here’s who qualifies and how to maximize your savings.
State Farm Mutual Automobile Insurance Company has begun issuing the largest dividend payout in its 100-plus-year history, mailing $5 billion in cash-back checks to qualifying auto insurance customers across more than 49 million vehicles.
The one-time distribution, announced in February 2026 and now rolling out in waves, returns an average of $100 per vehicle to policyholders who maintained active coverage throughout 2025.
Payments vary by state—ranging from 4% to 10% of the premium paid in 2025—and are being delivered via paper check or direct deposit based on customer preference.
Qualifying policyholders will receive notification by email or postal mail, and funds can also be tracked through the State Farm mobile app or online account portal.
Who Qualifies for the State Farm Dividend?
Eligibility is straightforward but strictly defined:
- Auto policies must have been active between January 1, 2025, and December 31, 2025
- Only personal auto insurance policies underwritten by State Farm Mutual are included
- The dividend is retrospective and does not affect future premium calculations or auto rates
- Commercial auto policies, renters, and homeowners policies are excluded from this specific dividend
The distribution timeline spans several months due to the sheer volume of vehicles covered. Customers with questions can contact the dedicated Dividend Customer Contact Center at 1-888-808-9532 or visit sfdividend.com.
Why State Farm Is Returning $5 Billion Now
State Farm’s unprecedented dividend stems from stronger-than-expected underwriting performance in 2025, driven by lower auto repair costs and a reduced frequency of collisions industry-wide. As a mutual insurance company—owned by policyholders rather than shareholders—State Farm is uniquely positioned to return surplus capital directly to customers.
The dividend comes on top of recent auto insurance rate reductions in 40 states, which are already saving customers an estimated $4.6 billion annually.
How to Maximize Your Auto Insurance Savings in 2026
Receiving a dividend check is an ideal moment to audit your entire auto insurance portfolio. Here’s how to stretch those savings further:
- Compare car insurance rates from multiple carriers. Even if State Farm reduced your rates, market competition may offer lower premiums for the same coverage limits.
- Bundle your policies. Combining auto, home, and life insurance under one carrier often unlocks multi-policy discounts exceeding 20%.
- Ask about safe driver discounts. Telematics programs that monitor braking, acceleration, and mileage can reduce premiums by up to 30% for low-risk drivers.
- Raise your deductible cautiously. Increasing your collision deductible from $500 to $1,000 can lower monthly premiums, but ensure you have sufficient emergency savings to cover the gap.
- Review coverage annually. Dropping unnecessary add-ons like rental reimbursement or roadside assistance—if already covered elsewhere—can trim costs without exposing you to liability risks.
People Also Ask: State Farm Dividend 2026
How much is the State Farm dividend per vehicle? The average payout is approximately $100 per vehicle, though actual amounts range from 4% to 10% of 2025 premiums paid, varying by state.
When will I receive my State Farm dividend check? Distribution began in summer 2026 and will continue for several months due to the volume of 49 million vehicles. Check your State Farm app or mail for notification.
Does the State Farm dividend affect my future premiums? No. The dividend is retrospective and will not impact future auto insurance rates, which are based on expected future costs and individual risk profiles.
Discover more from The Economy
Subscribe to get the latest posts sent to your email.


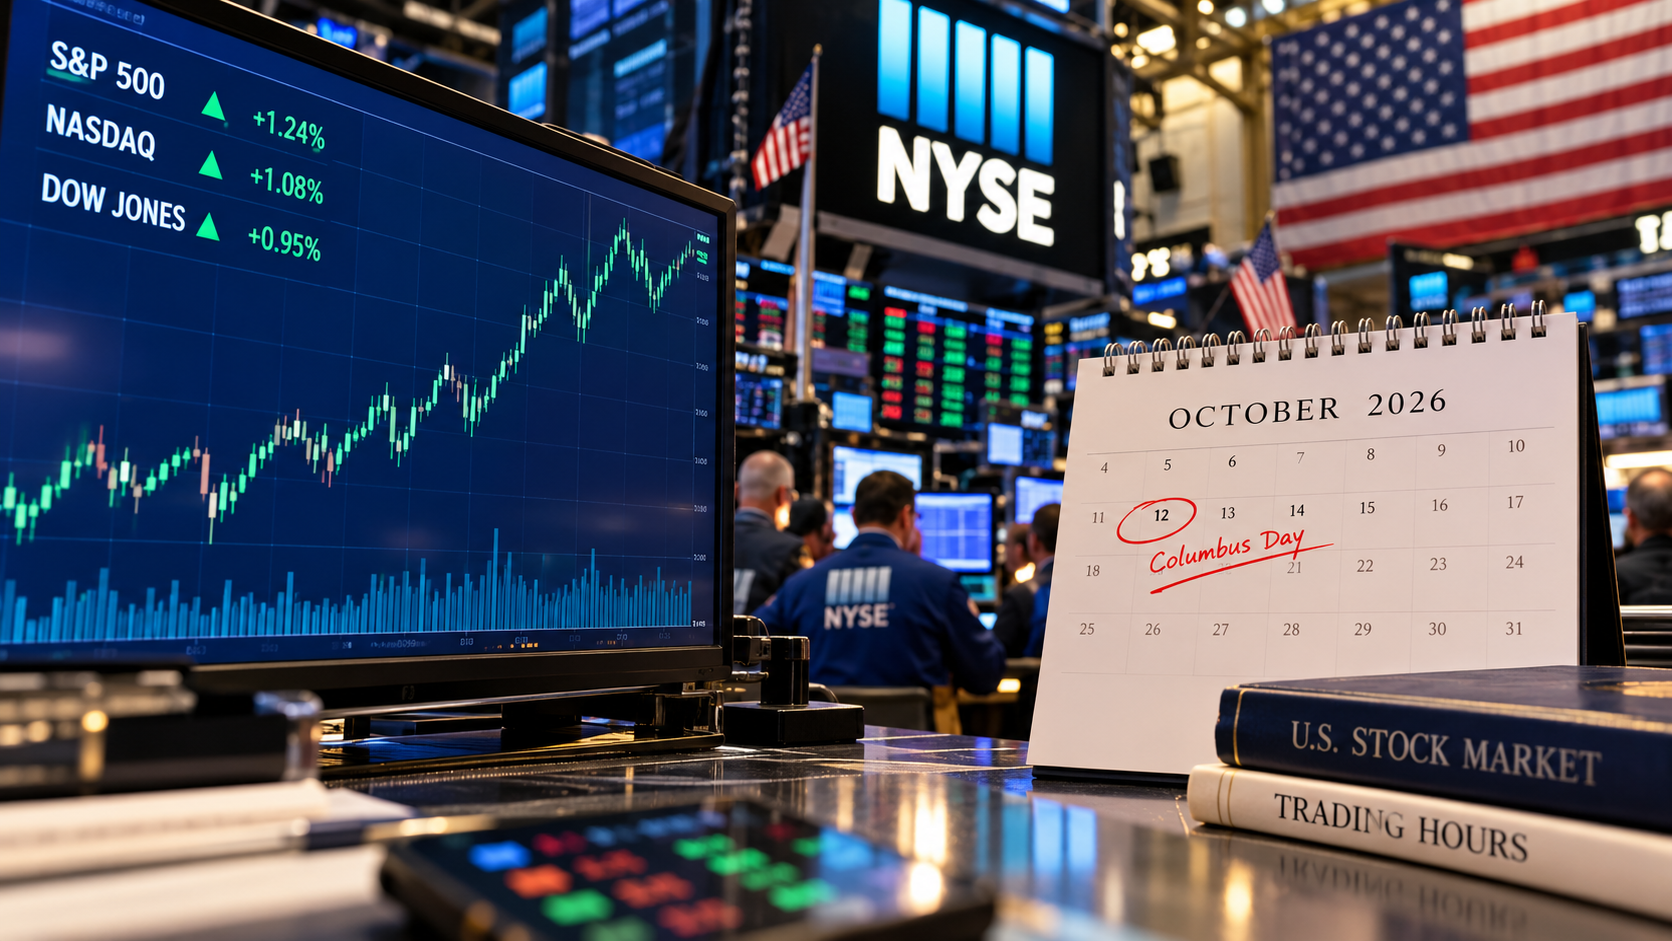
NYSE and Nasdaq are scheduled to trade their regular session on Monday, October 12, 2026, although the U.S. bond-market holiday schedule differs from that for stocks. Research cutoff: October 12, 2026; confirm developing facts before publication.
What is happening and why readers are searching
Yes. Monday, October 12, 2026 is Columbus Day, also observed by many as Indigenous Peoples’ Day, and the New York Stock Exchange and Nasdaq are scheduled to trade during their standard 9:30 a.m.–4 p.m. Eastern session. The bond market follows a different holiday schedule: SIFMA recommends a full closure in U.S. dollar fixed-income trading. Sources: NYSE and SIFMA holiday schedule.
The important context competitors can overlook
This distinction matters for more than trivia. A trader may see stocks move while some bond markets and banks are closed. Brokerage funding, transfer cutoffs and market data from less-liquid products can behave differently from a typical Monday. International exchanges observe their own holidays and may not follow the U.S. calendar. The federal holiday label alone does not tell a reader whether a particular financial instrument trades. For primary-source checks and current reporting, see NYSE and Kiplinger. The key distinction is separate equity, bond, bank and settlement schedules.
A practical way to use this information
Check your brokerage’s trading notice for options, mutual-fund cutoffs, fixed income and account funding. Avoid saying “the market is closed” without naming the asset class. Readers with urgent cash needs should confirm transfer and settlement arrangements directly with their institution. The next scheduled full U.S. stock-market holiday after October 12 is Thanksgiving Day, November 26, according to the exchange holiday calendars.
A holiday-hours comparison worth saving
| Market or service | October 12, 2026 | What to check |
|---|---|---|
| NYSE-listed shares | Regular session scheduled | Your broker and exchange notices |
| Nasdaq-listed shares | Regular session scheduled | Trading hours and order type |
| U.S. dollar bond market | SIFMA recommends closure | Fixed-income trading desk |
| Banks and transfers | Federal holiday may affect services | Your bank’s payment timetable |
NYSE exchange trading hours and the SIFMA holiday recommendation are different types of evidence. Neither establishes that every retail intermediary will offer normal transfer processing.
What to verify before making a decision
The right next step is to identify the source, timestamp and applicable market or jurisdiction. Check whether a number is a historical observation, official announcement, target, forecast or scenario. If you intend to act financially, legally or commercially, use the relevant provider’s current terms and obtain professional advice where appropriate. The sources cited here establish context; they are not a substitute for live prices, individual eligibility checks or binding agreements.
Reader questions
Can I buy U.S. stocks on Columbus Day?
Yes, the regular NYSE and Nasdaq session is scheduled.
Are Treasury bonds trading normally?
SIFMA recommends a U.S. bond-market holiday closure.
What “the market is open” actually means
The NYSE and Nasdaq trading session and the U.S. federal-holiday calendar are separate systems. On Monday, October 12, 2026, their standard core trading hours are scheduled to run from 9:30 a.m. to 4 p.m. Eastern Time. A share of a widely traded U.S. company can therefore change hands while many bank branches and government offices remain closed. But that statement does not tell you whether your brokerage’s customer-service desk is staffed normally, whether a fund values assets at its usual time, or whether a particular bond has a reliable two-sided quote. Those details depend on instrument, venue and broker.
For an investor outside the United States, convert Eastern Time carefully. Some countries move clocks on different dates, while others do not observe daylight saving time. A calendar showing “9:30” without a time zone is insufficient. Use the NYSE official market calendar as the first reference for exchange trading hours and your broker’s order preview for instrument-specific handling.
Stocks, Treasuries, funds and cryptocurrency are not interchangeable
A company’s listed common stock may trade normally even when the recommended U.S. bond-market session is closed. Treasury bonds, municipal bonds and corporate bonds do not operate in exactly the same way as exchange-listed shares. Fixed-income markets are fragmented, and a limited or irregular quoting environment can produce wider bid-ask spreads. Placing a market order in a thinly traded security can be more expensive than expected. Investors considering a bond trade should ask about dealer liquidity, execution timing and whether prices are executable rather than merely indicative.
Mutual funds, exchange-traded funds, stock-index futures and cryptocurrencies each have their own pricing mechanics. An ETF can trade on the stock exchange, but its underlying holdings could include instruments in markets observing a holiday. Mutual funds normally process orders according to their published prospectuses and cutoff policies. Futures venues publish product-specific schedules. Cryptocurrency markets trade around the clock, but uninterrupted availability does not guarantee tight spreads. Checking one “market open” headline is not enough to infer all these schedules.
Order types and settlement around a federal holiday
Imagine an investor who places an order for shares on Monday morning. The exchange may execute it during the ordinary equity session, but settlement and cash-transfer processing can be affected by banking holidays and applicable business-day conventions. A trade confirmation, settled-cash display and withdrawal availability are not the same event. The safest approach is to check the brokerage’s holiday operations notice rather than assuming that an executed trade instantly creates withdrawable cash. Different account types may impose additional restrictions.
For a volatile security, an investor can compare the displayed bid and ask before trading and consider a limit order rather than automatically accepting an uncertain market price. This does not guarantee execution. It does specify the least favorable purchase price or sale price the investor is willing to accept. Orders entered outside the core session may also have distinct participation, duration and execution rules, which a broker should disclose.
The practical Columbus Day checklist
A useful market-hours answer should cover more than the yes-or-no question. Check the exact date and year, the trading venue, the time zone, the security type, your brokerage’s processing calendar and any early-closing notice. For dollar-denominated fixed income, consult the SIFMA holiday schedule. For your specific bank, inspect its branch and electronic-transfer information. Do not assume a bank holiday means cards stop working or electronic trading becomes impossible; these are distinct operations.
Holiday headlines can also expire quickly. A search result from 2025 or 2027 might display the same Columbus Day keywords yet give the wrong weekday or market specifics. Editors should include “Monday, October 12, 2026” near the top and remove any blanket claim that all financial markets are open. If the story is reused next year, the date and all supporting calendars need new verification.
What to do if a trade or transfer is urgent
For an urgent payment, ask the receiving institution about cutoff times and whether it recognizes the holiday as a processing day. For an urgent investment order, verify the specific instrument’s status directly in the broker interface and review the quote rather than trusting a static article. Where timing is not essential, waiting for ordinary liquidity can be more sensible than accepting a large spread. These are general execution considerations, not recommendations to buy or sell any particular security.
The broader lesson is that exchange trading, dealer liquidity and banking settlement are three separate clocks. Columbus Day demonstrates why a short market-hours answer is useful as a starting point but inadequate for every investor’s operational decision.
Discover more from The Economy
Subscribe to get the latest posts sent to your email.

Conagra Brands has stopped producing Celeste frozen pizza, bringing an end to the familiar budget-friendly product line. The company disclosed its decision as part of a wider simplification of its food portfolio during its fiscal first-quarter 2027 earnings cycle. A Conagra representative subsequently confirmed that existing retail inventory can continue to sell, but the company is no longer manufacturing new Celeste pizzas. That means a shopper may still spot a box in a freezer, even though production has ceased. Conagra’s quarterly results and Fox Business’s confirmation from the company establish the basic facts.
Key takeaways:
- The decision is a confirmed discontinuation, not a social-media rumor or temporary nationwide recall.
- Existing products may remain on shelves until inventories run out; availability is local and cannot be guaranteed.
- Conagra’s management presented Celeste as part of a broader effort to simplify underperforming brands and individual product lines.
- A brand’s devoted following does not necessarily make it profitable to produce and distribute nationally.
Did Celeste frozen pizza really stop production?
Yes. During the September 30, 2026 earnings discussion, management identified the exit from Celeste as one example of simplifying Conagra’s assortment. In a statement reported by Fox Business, the company said it had stopped making Celeste and would sell remaining inventory. The same report said Conagra viewed the exit as positive for future margins, despite a small negative contribution to reported quarterly sales.
Two distinctions matter. Production means manufacturing fresh units for shipment. Distribution and retail availability depend on the inventory already in warehouses, on trucks, or in stores. Stopping production does not instantly remove all existing boxes from sale. Nor is there evidence in the reviewed statements of a restart date or replacement product under the same brand.
Shoppers seeking an answer to “Is Celeste discontinued?” should therefore treat the answer as yes, while recognizing that a few locations may continue selling stock for a limited period. Store-listing pages can lag real inventory. Checking a retailer’s stock status or contacting the store is more useful than relying on an old product listing.
Why Conagra made the decision
Conagra is pursuing a leaner mix of products. The company said its fiscal first-quarter reported net sales fell 1.4%, while reported diluted earnings per share rose 5.9% from the year-earlier period. Its earnings announcement also reaffirmed fiscal-year guidance for an organic sales decline of 1% to 3%. Conagra’s September 30 release provides the financial context.
The takeaway is not simply that one pizza sold poorly. Large packaged-food companies face costs across manufacturing capacity, ingredients, packaging, transportation, shelf space and promotional activity. Each different size or variety adds complexity. A low-volume item can consume factory time and distribution attention that might otherwise support a larger brand or faster-growing category.
Industry publication Food Dive described Celeste’s removal as an early sign of a larger portfolio review. Food Processing similarly framed the move as SKU rationalization—industry shorthand for trimming individual products or assortments.
What SKU rationalization means to shoppers
A stock-keeping unit, or SKU, is a specific retail product variation. Cutting SKUs can mean eliminating a flavor, size or entire line. It may improve the manufacturer’s operating efficiency, but it also reduces choice. In Celeste’s case, the reported decision is broader than dropping one variety: the brand’s frozen pizzas are no longer being produced.
This is a trade-off for retailers too. Shelf space is limited; grocers favor products that sell consistently, generate acceptable margins and are easy to replenish. A long-established label can therefore disappear even if a loyal group of customers still buys it.
Celeste’s history explains the reaction
The nostalgic response is not difficult to understand. According to People’s history of the brand, Celeste grew out of the Lizio family’s frozen-pizza business in Illinois in the early 1960s, then gained wider national distribution after its sale to Quaker Oats in 1969. Its single-serving format became part of ordinary freezer routines for generations of customers.
That history has value, but sentimental recognition differs from today’s unit economics. A brand’s cultural footprint captures decades of purchases and memories. A modern annual business review measures recent sales velocity, production costs, distribution economics and likely future performance. Both can be true: consumers can love a product while its owner concludes the business does not justify further investment.
It would be misleading, however, to assign a definitive financial loss to Celeste alone. The public earnings figures reviewed here describe Conagra as a whole and management’s portfolio strategy, not an audited standalone Celeste profit-and-loss statement.
Can customers still buy Celeste pizza?
Possibly, for a limited time. Conagra’s confirmation leaves open the sale of units already produced. Grocery availability can vary across chains, individual stores and locations; stock may disappear at different speeds.
| What a customer sees | What it means |
|---|---|
| Celeste box still in a freezer | Likely remaining inventory; it does not prove production restarted |
| Product displayed on a retailer website | A listing is not a stock guarantee; verify store availability |
| Product shown as out of stock | Could indicate local sell-through; not necessarily a separate recall |
| Social post promising a return | Do not rely on it without a new manufacturer announcement |
| Old coupon or promotion | Terms and actual retailer supply still control |
For any remaining frozen product, follow the labeled storage and preparation instructions. Avoid stockpiling food if storage quality cannot be maintained. Price surges by third-party sellers should not be mistaken for an official recommended retail price.
Does this signal trouble for the wider frozen-pizza market?
Not necessarily. One company’s decision about one brand cannot establish a decline across the entire frozen-pizza category. Portfolio simplification can happen even in categories with viable demand, particularly when individual products fail to justify operational complexity. Conversely, a popular category does not guarantee that every brand or price point performs well.
Conagra’s wider fiscal results show a company navigating sales pressure while trying to maintain profitability. The decision makes sense as part of management’s stated plan. To establish a wider market decline would require independently sourced industry unit sales, dollar sales, pricing and retailer data—none of which should be invented to make a broader headline.
What happens next for Conagra?
Management has signaled a continuing review of its assortment. Investors will watch subsequent quarterly disclosures for signs that lower complexity improves profit margins without causing excessive loss of sales. Customers will watch for further product exits and which remaining brands receive greater shelf presence.
A successful simplification program would ideally improve factory utilization, inventory efficiency and brand investment. But there are risks: removing too many niche products may push loyal customers toward competitors. The outcome is measurable only over future reporting periods.
Frequently asked questions
Is Celeste frozen pizza permanently discontinued?
Conagra has confirmed production stopped and provided no restart plan in the statements reviewed as of October 10, 2026. It is appropriate to describe the product as discontinued; any future return would require a new announcement.
Why did Conagra stop making Celeste?
Conagra presented the exit as part of a strategy to remove smaller, lower-return businesses and simplify its product portfolio. Its earnings materials provide context.
Can I still find Celeste at Walmart or Kroger?
A retailer could still have previously manufactured stock, but availability varies. Check a specific store rather than assuming the product remains nationally stocked.
Was Celeste pizza recalled?
The reporting reviewed here describes a business discontinuation, not a safety recall. If concerned about a specific package, consult the official recall notices and the package details.
Will another company buy or relaunch Celeste?
There is no verified agreement or relaunch timetable in the material reviewed. Speculation about a buyer should not be published as fact.
Who owned Celeste at the end?
Conagra Brands was the manufacturer and brand owner responsible for the discontinuation announcement.
Bottom line
Celeste’s removal illustrates how an iconic grocery brand can be commercially vulnerable in a modern food portfolio. The key consumer fact is straightforward: the manufacturing run has ended, but existing inventory may remain for sale. The larger business story is Conagra’s effort to put resources behind products with stronger expected returns. Readers should look for verified new company disclosures rather than assume the label will return.
Discover more from The Economy
Subscribe to get the latest posts sent to your email.

The central business question about artificial intelligence has changed. Access to a capable tool is no longer enough to demonstrate an advantage. The harder test is whether the organisation produces better results after accounting for review, integration, training and operating costs.
McKinsey’s 2026 State of AI survey captures this tension. Eighty percent of respondents reported improved individual productivity, while 37% attributed some enterprise-level earnings impact to AI. Those findings describe the survey sample; they do not prove that every company sees the same pattern.
Nevertheless, the distinction is commercially important. An employee can finish a draft faster while the organisation remains constrained by approvals, unreliable data or a lack of customer demand. Businesses need to measure the complete process rather than celebrate speed at one stage.
Task improvement and business improvement are different
Imagine a customer-service team using AI to draft replies. Drafting time falls, but every response still passes through the same review queue. If that queue is the main source of delay, customers may notice little improvement.
Alternatively, the tool may let the team handle more requests with the same staffing. That could improve service even if no job is removed and no immediate payroll saving appears. The value would show up in capacity, response times or customer retention rather than a simple reduction in wages.
These are illustrative cases, but they expose a common measurement problem. Time saved is an intermediate result. The business still has to convert that time into additional output, better quality, reduced costs or another outcome it actually values.
The strongest pilot starts with a baseline
Before introducing a tool, record how the process currently performs. Useful measures might include turnaround time, error frequency, rework, customer complaints and cost per completed case. A baseline prevents ordinary variation from being mistaken for an AI benefit.
The unit of measurement should match the business objective. Counting generated documents says little about whether the documents were useful. Counting chatbot interactions does not show whether customers resolved their problems. High usage can even indicate confusion if people repeatedly retry unsuccessful tasks.
A pilot should also identify what success would justify expansion. For example, a team might require faster completion without an increase in material errors. Deciding that threshold in advance makes it harder to redefine success after seeing disappointing results.
Calculate the full cost, including human review
Subscription fees are only one part of AI expenditure. Integration work, access controls, evaluation, staff training and ongoing supervision can be substantial. Consumption-based charges may also increase as a pilot moves into routine use.
McKinsey’s survey reports that roughly one-fifth of respondents encountered AI operating costs that constrained usage. That is a reminder to model expenditure under realistic volumes rather than assume that the price of a small experiment represents the cost of a production system.
Consider a hypothetical team saving 100 hours a month. If review and correction consume 40 additional hours elsewhere, the net time benefit is 60 hours before other costs. If the saved time cannot be redeployed, its financial value may be smaller than multiplying those hours by an employee’s salary would suggest.
Redesign the workflow around the actual bottleneck
Adding AI to an inefficient process can accelerate one step while preserving the underlying problem. A sales team might generate more proposals while approvals remain slow. A finance department might classify invoices faster while unresolved supplier records continue to block payment.
The practical response is to map the whole process. Identify where work waits, where mistakes originate and which decisions require human judgment. Then determine whether AI addresses that constraint or merely produces more material for someone else to review.
This approach can lead to smaller, more useful deployments. A reliable extraction tool tied to a clear review procedure may deliver more value than an ambitious agent with broad permissions. The right scope depends on the task’s consequences, available data and the organisation’s ability to detect errors.
Quality has to be measured alongside speed
AI output can sound persuasive while containing mistakes. Businesses therefore need evaluation methods that reflect the consequences of failure. A minor tone problem in an internal draft differs from an incorrect price, contractual statement or customer instruction.
The NIST AI Risk Management Framework provides an official reference for thinking about AI risks and governance. Applied operationally, the relevant question is simple: which failures matter, how will they be detected, and who is responsible for responding?
Testing should include difficult and unusual cases, not just representative easy ones. A system that performs well on routine requests can still fail where a policy has exceptions or the underlying information is incomplete. The cost of those failures belongs in the business case.
Data access can matter more than model choice
A model cannot reliably answer organisation-specific questions if the relevant information is missing, outdated or contradictory. Businesses may discover that the most valuable preparatory work is cleaning records, assigning ownership and resolving conflicting policies.
Permissions matter too. Connecting an assistant to more information can improve usefulness while increasing the consequences of an access mistake. The deployment needs a clear account of who may see which material and what actions the system is permitted to take.
This creates an important procurement distinction. A compelling demonstration with carefully selected data does not establish readiness for the company’s actual environment. Buyers should ask how updates are handled, how errors are investigated and whether the product can be evaluated on realistic internal cases before a broad commitment.
Infrastructure growth is a separate investment story
The AI economy includes chip suppliers, data centres, power systems, software companies and businesses adopting applications. They do not all earn returns in the same way or on the same schedule.
The International Energy Agency’s Energy and AI report examines the relationship between AI and energy systems. For business analysis, the distinction matters because demand for computing infrastructure can grow even while some end users struggle to demonstrate profitable applications.
An investor or executive should therefore separate spending growth from return on that spending. A supplier can benefit from a construction cycle before the customer achieves a satisfactory payoff. Over time, however, customer economics matter to the durability of demand. Strong capital expenditure is evidence of commitment, not conclusive proof of eventual value.
What smaller businesses can do differently
A smaller company may lack the budget for extensive custom infrastructure, but it can still choose a narrow problem with a measurable outcome. Repetitive internal documentation, information retrieval or draft preparation may offer a manageable starting point when data and review requirements are clear.
The business should assign an owner who understands the process rather than treating the project as a tool purchase alone. That person can gather feedback, identify recurring failures and decide whether the deployment is helping employees complete useful work.
Expansion should follow evidence. If a pilot creates little value, the next step might be redesign, a different tool or stopping the experiment. A willingness to stop is part of competent investment management. Continuing simply because AI is strategically fashionable can turn a limited test into an expensive routine.
A practical scorecard for the next quarter
Track five things together: outcome quality, total completion time, cost per completed task, user adoption and the frequency of significant failures. The combination provides a more balanced view than any single headline metric.
Review how much of the benefit is repeatable. A one-time backlog reduction may be valuable without supporting the same ongoing return. Similarly, enthusiastic early users may not represent employees who encounter the system later with less training or motivation.
AI’s commercial promise in 2026 is substantial, but the route to value runs through ordinary operational discipline. Businesses need clear objectives, dependable information, realistic cost accounting and responsibility for the final result. The most useful question is not how much AI the organisation uses. It is what customers, employees and owners receive in return.
Discover more from The Economy
Subscribe to get the latest posts sent to your email.

Oil and Diesel Prices in October 2026: How Supply Shocks Can Reach Inflation

AI Chip Demand in 2026: What TSMC, Nvidia and Data-Center Spending Reveal

Q3 2026 Earnings Season: The Bank, AI and Consumer Signals That Really Matter

Treasury Yields in 2026: Why Higher Bond Rates Matter for Stocks, Mortgages and Savings

KOSPI 2026: Why South Korean Stocks Turned Volatile and What AI Investors Should Watch

IREN Stock in 2026: AI Cloud Growth, Bitcoin Transition and the Risks Investors Miss

Stock Market Crash in 2026? Warning Signs, Scenarios and a Calm Investor Checklist

Peso Mexicano vs Dólar Estadounidense: A Practical USD/MXN Guide for October 2026

Is the Stock Market Open on Columbus Day 2026? NYSE, Nasdaq and Bonds Explained

Concert Ticket Prices in 2026: Dynamic Pricing, Fees and How to Buy Safely

High-Yield Savings Accounts in 2026: How to Compare APY Without Chasing a Headline

EU-China Trade Deal 2026: How Beijing and Brussels Avoided a Trade War—and Who Wins

Social Security 2027 COLA Announcement: Date, Formula and What Retirees Should Check

China’s AI Microdrama Boom: How Beijing Is Reshaping Global Media

China Stocks Today: Are Big Economies in Asia Nearing a Market Bottom?

World’s Largest Economies: Ranking the Top Global Powers

Global Pension Systems Ranked: The World’s Best and Worst Retirement Frameworks

Elon Musk’s Next Moves: Disrupting the 2026 Global Economy

Pakistan Economy 2026: Inside the SBP’s Balancing Act

Crude Oil & Petroleum Market Analysis: OPEC+ Decisions and Price Forecasts

GasBuddy Market Insights: How Crude Price Shifts Impact Local Fuel Cost Averages

Global Equity Market Divergence: US Tech vs. European Dividend Stocks vs. Asian Growth

IMF & World Bank Global Economic Outlook: Growth Forecasts Across Europe and Asia

Silver Price Today: Why the Xi-Trump AI Standoff Is Fueling a Safe-Haven Rally

Bitcoin Price Forecast 2026–2027: Will the 4-Year Cycle Hold?

The Future of Silicon: Supply Chain Vulnerabilities in the 2026 Tech Sector

Asian Stock Markets 2026: Japan, China, Pakistan & More

Stagflation vs. Soft Landing: How Central Bank Rates Are Reshaping European and Asian Economies
-

 Markets & Finance9 months ago
Top 15 Stocks for Investment in 2026 in PSX: Your Complete Guide to Pakistan’s Best Investment Opportunities
-

 Analysis8 months ago
Johor’s Investment Boom: The Hidden Costs Behind Malaysia’s Most Ambitious Economic Surge
-

 Analysis8 months ago
Top 10 Stocks for Investment in PSX for Quick Returns in 2026
-

 Banks9 months ago
Best Investments in Pakistan 2026: Top 10 Low-Price Shares and Long-Term Picks for the PSX
-

 Analysis8 months ago
Brazil’s Rare Earth Race: US, EU, and China Compete for Critical Minerals as Tensions Rise
-

 Investment9 months ago
Top 10 Mutual Fund Managers in Pakistan for Investment in 2026: A Comprehensive Guide for Optimal Returns
-

 Global Economy10 months ago
15 Most Lucrative Sectors for Investment in Pakistan: A 2025 Data-Driven Analysis
-

 Global Economy10 months ago
Pakistan’s Export Goldmine: 10 Game-Changing Markets Where Pakistani Businesses Are Winning Big in 2025