
Markets & Finance
Oil Drops 5%: US-Iran Peace Deal Shocks Global Markets (2026)

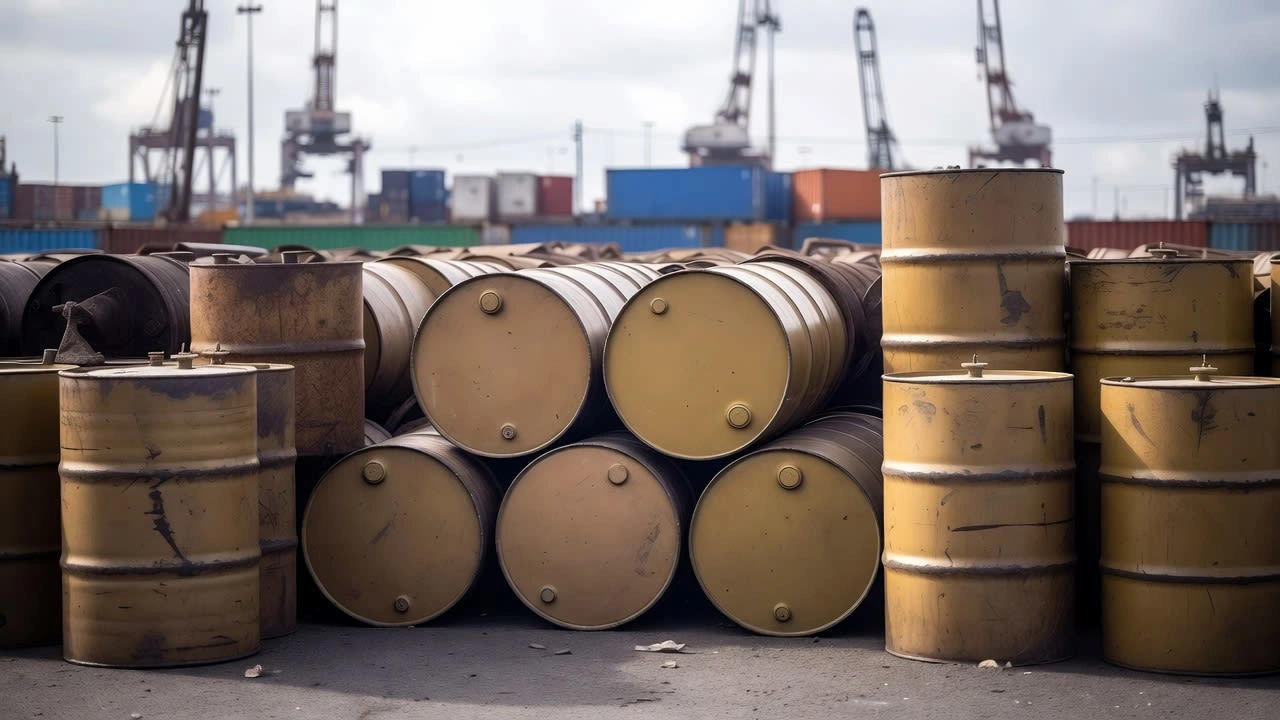
Global energy markets experienced a violent recalibration Tuesday morning. The long-anticipated US-Iran peace deal impact on oil prices materialized instantly across trading desks in London and New York, sending global benchmarks tumbling. Brent crude futures plummeted 5% in early trading, breaking a psychological floor to hit a three-month low of $74.30 a barrel.
This diplomatic breakthrough, brokered over fourteen grueling months of secret negotiations in Oman, guarantees the unhindered reopening of the Strait of Hormuz. For a global economy battling persistent inflation, the sudden evaporation of this Middle Eastern war premium acts as an immediate, unpriced stimulus package. Markets are now hastily repricing the entire macroeconomic outlook for the fourth quarter.
The Macroeconomic Relief Valve
To understand the severity of the market’s reaction, one must look at the structural fragility of maritime oil transit. The Strait of Hormuz serves as the central artery for global energy. According to the US Energy Information Administration (EIA), roughly 21 million barrels of oil flow through this narrow 21-mile-wide channel daily. This represents over a fifth of global petroleum liquids consumption.
For the past two years, escalating hostilities between Washington and Tehran kept a persistent $5-to-$7 geopolitical fear premium baked into every barrel. Traders continuously priced in the tail-risk of a sudden blockade. The sudden announcement by the US State Department that a comprehensive maritime security and sanctions-relief accord has been signed fundamentally rewrites this supply-side equation.
Central banks have watched these developments closely. The Bank of England and the US Federal Reserve have repeatedly cited energy-driven supply shocks as a primary hurdle to achieving their 2% inflation targets. A sustained drop in crude effectively does the heavy lifting for monetary policymakers, instantly easing input costs across the industrialised world.
The Anatomy of the Sanctions Reversal
The core development hinges on the immediate lifting of secondary sanctions targeting Iran’s energy sector. In exchange for verifiable nuclear compliance and guaranteed safe passage for commercial shipping through the Strait, Iranian crude is officially coming in from the cold.
- Immediate Supply Injection: Analysts expect an initial flush of 500,000 barrels per day from floating storage facilities in the Persian Gulf.
- Medium-Term Production: Iranian production facilities could scale up to add an additional 1.5 million barrels per day over the next eight months.
- Maritime Insurance Plunge: Lloyd’s of London syndicates are already slashing war-risk premiums for tankers transiting the region by up to 60%.
The International Energy Agency (IEA) recently noted that global spare capacity was becoming alarmingly thin. The return of Iranian barrels provides a much-needed buffer against unexpected outages elsewhere. Asian refiners, traditionally the largest buyers of Iranian sour crude, are already adjusting their procurement schedules for the coming month, canceling spot cargoes from West Africa and the US Gulf Coast in anticipation of cheaper Middle Eastern supply.
That said, reintegrating a major petro-state into the global financial system is administratively complex. Clearing houses and shipping registries will require weeks to fully untangle the web of compliance restrictions that have bound Iranian exports for half a decade.
Decoding the Geopolitical Risk Premium Drop
The immediate 5% price drop is less about the physical barrels hitting the market today and entirely about the structural shift in forward expectations. The market is pricing out fear.
How does the Strait of Hormuz affect oil prices?
The Strait of Hormuz affects oil prices by acting as a critical bottleneck for global energy distribution. When geopolitical tensions threaten this 21-mile-wide channel, markets immediately price in a risk premium, anticipating supply disruptions that could remove 21 million barrels from daily circulation.
This evaporation of risk alters the calculus for West Texas Intermediate (WTI) producers in the Permian Basin. US shale operators have benefited immensely from elevated global prices, using the windfall to pay down debt and issue special dividends. With the structural floor now lowered, capital expenditure budgets for the upcoming fiscal year will face intense scrutiny. The era of easy margins for North American producers may be closing.
Downstream Consequences for the Global Economy
The second-order effects of a sustained $70 oil environment will ripple through every layer of the global economy. For heavy industries in Europe, particularly the German manufacturing base, the drop in energy inputs offers a lifeline after two years of margin compression.
The picture is more complicated for emerging market commodity exporters. Nations reliant on crude revenues to balance domestic budgets will feel an immediate squeeze. The World Bank has consistently warned that a rapid deceleration in energy prices could trigger sovereign debt distress in highly leveraged African and Latin American petro-states.
Yet, for the average consumer, the effects are unambiguously positive. Lower crude translates directly to the petrol pump within four to six weeks. This discretionary income boost arrives precisely as household savings rates across the OECD reach post-pandemic lows. Retailers and consumer goods companies are likely to see a corresponding uptick in fourth-quarter earnings as households repurpose fuel savings into broader consumption.
The OPEC+ Retaliation Scenario
It is highly unlikely that traditional market heavyweights will absorb this price shock passively. Riyadh and Moscow, the de facto leaders of the OPEC+ cartel, now face a severe revenue shortfall.
Dissenting voices in the commodities trading space argue that the current market sell-off is a massive overreaction. Pierre Andurand, a prominent energy hedge fund manager, recently argued via client note that any influx of Iranian crude will simply trigger an equivalent, reactionary production cut from Saudi Arabia. If OPEC+ convenes an emergency meeting to withdraw 1 million barrels per day from the market, the current supply glut will vanish before the first Iranian supertanker reaches a Chinese port.
Furthermore, decades of underinvestment in Iran’s aging oil infrastructure mean that sustaining peak production targets will require billions in foreign direct investment. Western supermajors remain legally hesitant and politically wary of committing capital to Tehran, fearing a future reversal of US foreign policy.
Synthesis and Market Horizon
The US-Iran diplomatic breakthrough fundamentally reshapes the global energy landscape, replacing a prolonged period of artificial supply scarcity with unexpected abundance. While bureaucratic hurdles and potential OPEC+ interventions loom on the horizon, the immediate unblocking of the world’s most critical maritime chokepoint provides undeniable relief to an inflation-weary global economy.
The sudden re-entry of a major producer guarantees that the geopolitical risk premium, which has inflated energy costs for years, is finally dead. Markets are no longer pricing for war; they must now learn to price for peace.
Discover more from The Economy
Subscribe to get the latest posts sent to your email.



Key Takeaways
- The benchmark 10-year US Treasury yield briefly touched 5.014% on Monday, September 14, 2026 — its first move above the psychologically important 5% threshold since October 2023, and only its second time above that level since the 2007-2008 financial crisis.
- The move came just two days before the Federal Reserve’s September policy meeting, with markets now pricing roughly a 90% probability of a rate hike rather than a cut, according to CME Group’s FedWatch tool.
- The catalyst combines several forces at once: Brent crude topping $109/barrel, a hotter-than-expected August CPI report, swelling government and corporate borrowing needs, and a possible unwinding of the Japanese yen carry trade as Japanese rates climb.
- The 30-year Treasury yield reached 5.386%, directly affecting mortgage pricing, while 10-year yields in the UK and Australia have also climbed above 5% — signaling this is a global, not purely American, bond-market phenomenon.
- Veteran market strategist Ed Yardeni notes that neither the yield spike nor the global bond selloff has “broken” the stock market’s bull run so far, crediting continued strength in corporate earnings.
For the first time in nearly three years, the interest rate that anchors global borrowing costs — the US 10-year Treasury yield — has crossed the symbolically important 5% threshold. The move, which arrived just 48 hours before the Federal Reserve’s September policy decision, is rippling through mortgage markets, equity valuations, and central bank calculations from Washington to Tokyo. Here’s what actually happened, why, and what it means for anyone watching the stock market today.
What Happened
The 10-year Treasury yield climbed as high as 5.014% intraday on Monday, September 14, 2026, before paring the move back to around 4.94–4.99% by afternoon trading. It marked the first time the yield had crossed 5% during a trading session since October 23, 2023, and — as several outlets noted — only the second time it has traded this high since July 2007, just before the global financial crisis. A close above 5.02% would represent the highest level since that pre-crisis period.
The move wasn’t isolated to the 10-year note. The 2-year Treasury yield, which is more directly sensitive to near-term Fed policy, climbed to 4.679%, surpassing its previous July 2024 high. The 30-year yield — the benchmark most directly tied to fixed mortgage rates — touched 5.386% before paring some of its gains.
Why Yields Are Spiking: Four Forces Converging
1. Oil-driven inflation fears. Brent crude climbed to a session high past $109 a barrel as fighting between the US and Iran escalated, directly feeding into bond investors’ inflation expectations. Rising energy costs erode the fixed returns bondholders receive, pushing yields higher to compensate.
2. A hotter-than-expected inflation print. Friday’s August CPI report showed inflation running hotter than markets had anticipated. Goldman Sachs’ chief economist David Mericle wrote that while the report didn’t change the bank’s underlying inflation view, it pushed market pricing of a Fed rate hike this week to nearly 90% — a striking reversal from earlier-year expectations of continued rate cuts.
3. Swelling government and corporate borrowing. The yield spike is also being driven by basic supply-and-demand dynamics in the bond market: both the federal government and major corporations are issuing substantial new debt to fund spending, adding to the overall supply of bonds competing for investor capital.
4. A potential yen carry-trade unwind. Yardeni Research has floated a more technical explanation with global implications: as Japanese interest rates rise and the yen strengthens (partly on Japan’s own defense-spending and monetary-policy shifts), the long-popular “carry trade” — in which investors borrow cheaply in yen and invest in higher-yielding assets elsewhere — becomes less attractive. Unwinding those positions could be contributing to selling pressure across global bond markets, not just US Treasuries.
Global Context: This Isn’t Just an American Story
The yield surge isn’t confined to the US. Ten-year yields in both Australia and the UK have also climbed above 5%, reinforcing that this is a broader global bond-market repricing rather than a US-specific event. Yardeni’s assessment captures the moment’s tension well: a global yield spike of this magnitude “would normally be enough to break a global bull market in stocks. Neither has so far” — crediting resilient corporate earnings for equities’ relative calm despite the bond turmoil.
Rate Decision Timing: Why This Matters So Much Right Now
The timing amplifies the significance considerably. The yield spike landed just two days ahead of the Federal Reserve’s September policy meeting, transforming what might otherwise be a notable but contained bond-market move into a live variable in the Fed’s own deliberations. According to CME Group’s FedWatch tool, the probability of a rate hike this week has climbed above 90%, while Polymarket bettors have priced the same outcome at around 80%. Some market watchers are also monitoring rising tension between President Trump and Fed Chair Kevin Warsh as a wildcard factor in how the central bank navigates the decision.
Yield Snapshot
| Maturity | Peak Yield (Sept 14, 2026) | Significance |
|---|---|---|
| 2-year Treasury | 4.679% | Highest since July 2024; most Fed-sensitive |
| 10-year Treasury | 5.014% | First above 5% since October 2023 |
| 20-year Treasury | 5.426% | Sensitive to geopolitical risk |
| 30-year Treasury | 5.386% | Benchmark for mortgage rates |
Why This Matters: Mortgages, Portfolios, and the Fed’s Next Move
For everyday borrowers, the 30-year yield’s climb toward 5.4% translates fairly directly into higher fixed mortgage rates, making home purchases and refinancing meaningfully more expensive than earlier in 2026. For equity investors, the key question is whether corporate earnings can continue outrunning the drag from higher borrowing costs — the dynamic Yardeni credits for the stock market’s calm so far. And for the Fed, Wednesday’s decision now carries outsized weight: a hike would validate the bond market’s current pricing, while a hold could trigger further yield volatility if investors interpret it as the central bank falling behind an inflation trend that oil prices and geopolitical tension are actively worsening.
Frequently Asked Questions
Why did the 10-year Treasury yield cross 5% in September 2026?
The move was driven by a combination of surging oil prices tied to the escalating US-Iran conflict, a hotter-than-expected August CPI report, heavy government and corporate bond issuance, and a possible unwinding of the yen carry trade as Japanese rates rise.
How does a 5% Treasury yield affect mortgage rates?
The 30-year Treasury yield, which climbed to 5.386% alongside the 10-year’s move, is the most direct benchmark for 30-year fixed mortgage rates, meaning this yield spike is likely pushing mortgage borrowing costs higher for US homebuyers.
Will the Federal Reserve raise interest rates this week?
As of the yield spike, markets were pricing roughly a 90% probability of a rate hike at the Fed’s September meeting, according to CME Group’s FedWatch tool — a sharp reversal from earlier expectations of rate cuts.
Discover more from The Economy
Subscribe to get the latest posts sent to your email.
Economic Costs of Wars
Ceasefire Negotiations in 2026: Predicting the Rebound of European and Asian Economies

Key Takeaways
- The European Commission has already cut its 2026 eurozone growth forecast to 0.9% (from 1.2%) and raised inflation projections to 3.0%, directly citing the Middle East war’s energy shock — with a full rebound contingent on how quickly, and how durably, any ceasefire holds.
- The ECB has laid out an explicit scenario split: its June 2026 baseline assumes gradual de-escalation and sees growth reaching 1.3% in 2027, while an adverse scenario with oil peaking near $180/barrel would roughly halve projected 2026 growth and push inflation 1.1 percentage points higher in 2027.
- Historical ceasefire episodes from earlier in 2026 show Asian markets — Japan’s Nikkei, South Korea’s Kospi — rallying 5%+ in single sessions on de-escalation headlines, only to reverse sharply when agreements broke down within days to weeks.
- As of mid-September 2026, no ceasefire is currently in place — the conflict has escalated rather than eased this month — meaning both the EU’s baseline and adverse scenarios remain live possibilities rather than settled outcomes.
- The World Bank’s April 2026 regional outlook shows the MENAAP region absorbing the sharpest growth downgrade of any global region, while South Asia remains comparatively resilient — illustrating how unevenly any eventual rebound would likely be distributed.
Every economic forecasting body tracking the global economy in 2026 — the European Commission, the ECB, the World Bank — has built its projections around the same fundamental uncertainty: nobody knows exactly when, or how durably, the US-Iran war will end. This piece works through what the major institutions’ own published scenarios say about how European and Asian economies would actually rebound once a ceasefire holds, and how sharply those forecasts diverge from what’s likely if the conflict instead drags on.
Europe’s Baseline vs. Adverse Scenario
The European Commission’s most recent forecast, published in May 2026, cut its eurozone 2026 growth projection to 0.9%, down from an earlier 1.2% estimate, while raising expected inflation to 3.0% — well above the ECB’s 2% target. EU economy chief Valdis Dombrovskis attributed the downgrade directly to the Middle East conflict, which he said “triggered a major energy shock, further testing Europe as it navigates an already volatile geopolitical and trade environment.”
Critically, the Commission built its forecast around two explicit scenarios. The baseline assumes energy prices gradually normalize as the conflict eases — even accounting for a “fragile ceasefire” that was in place at the time of the forecast’s cutoff date (though the Strait of Hormuz remained effectively closed even under that truce). The adverse scenario assumes oil prices continue climbing toward $180 per barrel by year-end; under that path, the Commission estimated inflation would run 0.3 percentage points higher in 2026 and a full 1.1 percentage points higher in 2027, while growth would come in at roughly half the baseline forecast.
The ECB has published its own parallel scenario work. Its June 2026 projections put baseline euro-area growth at 0.9% in 2026, improving to 1.3% in 2027 and 1.4% in 2028 — a “downward revision, especially for 2026,” reflecting what the ECB explicitly called “the global effects of the war on commodity markets, real incomes and confidence.” By September, more recent ECB commentary noted the euro area economy was proving “more resilient than expected” to the shock, supported by domestic demand, a robust labour market, and AI-related investment — suggesting some of the earlier worst-case assumptions may not be fully materializing, even without a durable ceasefire yet in place.
Asia’s Pattern: Sharp Rallies, Sharper Reversals
Asian equity markets have shown a far more volatile, headline-driven relationship with ceasefire news than Europe’s more gradual, forecast-revision-based response. When the US and Iran announced a framework agreement to end hostilities in June 2026, Japan’s Nikkei 225 surged 5.5% in a single morning session, South Korea’s Kospi jumped as much as 5.7%, and Taiwan’s Taiex climbed 2.7%. A separate ceasefire announcement in April 2026 produced a similar pattern: the Nasdaq 100 rose nearly 3% while Japan and Korea posted comparable Asia-Pacific gains.
In both cases, the rallies proved short-lived. The April ceasefire unraveled within roughly two weeks amid mutual accusations of violations, and by early September 2026, fighting had resumed in earnest, with oil prices climbing back above $107 per barrel and diesel approaching a record $6 per gallon in the US. This pattern — sharp, headline-driven Asian equity rallies followed by reversal once agreements prove unstable — has now repeated at least three times in 2026, a track record worth weighing heavily against any future ceasefire headline.
Scenario Comparison Table
| Scenario | Eurozone 2026 Growth | Eurozone Inflation | Asian Equity Pattern |
|---|---|---|---|
| EU baseline (gradual de-escalation) | 0.9% | 3.0% | Gradual stabilization |
| EU adverse (oil to $180/bbl, prolonged conflict) | ~0.4-0.5% (roughly half baseline) | +1.1pp above baseline by 2027 | Continued volatility, no durable rally |
| Historical pattern: ceasefire announcement | N/A (US/Euro-specific) | N/A | Nikkei/Kospi +5%+ single session |
| Historical pattern: ceasefire collapse | N/A | N/A | Reversal within 1-3 weeks |
The Uneven Regional Picture
Not every region would rebound equally even in the optimistic baseline scenario. The World Bank’s April 2026 regional economic update found that, excluding Iran itself, the broader MENAAP region’s growth is expected to slow from 4.0% in 2025 to just 1.8% in 2026 — the sharpest downgrade of any region the Bank tracks. By contrast, the Bank’s July 2026 Global Economic Prospects report identifies South Asia as remaining the fastest-growing region globally despite the conflict, with the Bank explicitly noting that regional impacts differ based on each economy’s energy exposure, strategic reserves, and available policy buffers — meaning net energy importers without deep reserves face a structurally slower rebound path than better-insulated economies even after any ceasefire takes hold.
Why This Matters: Treat Ceasefire Headlines as Scenario Triggers, Not Resolutions
For investors and businesses trying to plan around the global economy’s trajectory, the most useful framework isn’t predicting exactly when a ceasefire arrives — it’s understanding which of the major institutions’ published scenarios that ceasefire would activate. A durable, Hormuz-reopening ceasefire would plausibly validate the EU Commission and ECB’s baseline growth and inflation paths, alongside a genuine (rather than headline-driven) Asian equity rebound. A fragile, easily-reversed truce — the pattern seen three times already in 2026 — would instead simply reset the clock on the adverse scenario, with markets likely repeating the same rally-then-reversal cycle that has defined 2026 so far. Given that no ceasefire is currently in place as of mid-September, and given the specific track record of the last three attempts, the adverse-scenario framework remains the more probable near-term base case.
Frequently Asked Questions
How would a Middle East ceasefire affect European economic growth?
Under the European Commission’s baseline scenario, a durable de-escalation would support eurozone growth around 0.9% in 2026, improving further in 2027. A prolonged conflict instead risks roughly halving that growth figure, per the Commission’s own adverse scenario.
Do Asian stock markets typically rally on ceasefire news?
Yes, historically sharply — Japan’s Nikkei and South Korea’s Kospi have both surged 5%+ in single sessions following prior 2026 ceasefire announcements, but those rallies have reversed within one to three weeks each time the agreements subsequently broke down.
Which regions would benefit most from a durable ceasefire?
The World Bank identifies the MENAAP region (Middle East, North Africa, Afghanistan, Pakistan) as having absorbed the sharpest 2026 growth downgrade, meaning it stands to see the largest relative rebound from a durable ceasefire, while South Asia has remained comparatively resilient throughout the conflict.
Discover more from The Economy
Subscribe to get the latest posts sent to your email.
Key Takeaways
- The World Bank’s most recent Pakistan Development Update projects FY26 GDP growth of just 3.0%, held back by catastrophic 2025 flood damage that cut agricultural output by nearly 10%, before growth picks up to 3.4% in FY27.
- The World Bank’s April 2026 regional update shows the wider Middle East, North Africa, Afghanistan, and Pakistan (MENAAP) region — excluding Iran — slowing sharply from 4.0% growth in 2025 to just 1.8% in 2026, a 2.4-percentage-point downgrade from January projections, driven by the Iran war’s regional spillover.
- Pakistan’s poverty data in the same reports is sobering: the share of the population living below the international $3-per-day poverty line surged from 16.5% to 46% between 2018 and 2023, with nearly nine in ten Pakistanis now below the $4.20-per-day threshold.
- The Bank credits Pakistan’s National Tariff Policy (2025–2030), which aims to halve tariffs over five years, as a potential long-term competitiveness driver — but cautions benefits depend on complementary reforms in logistics, taxation, and energy pricing that will take years to materialize.
- Despite the sobering structural picture, the KSE-100 has still outperformed dramatically on a market basis — closing FY26 up 44% — showing a persistent disconnect between equity-market sentiment and the World Bank’s underlying growth and poverty data.
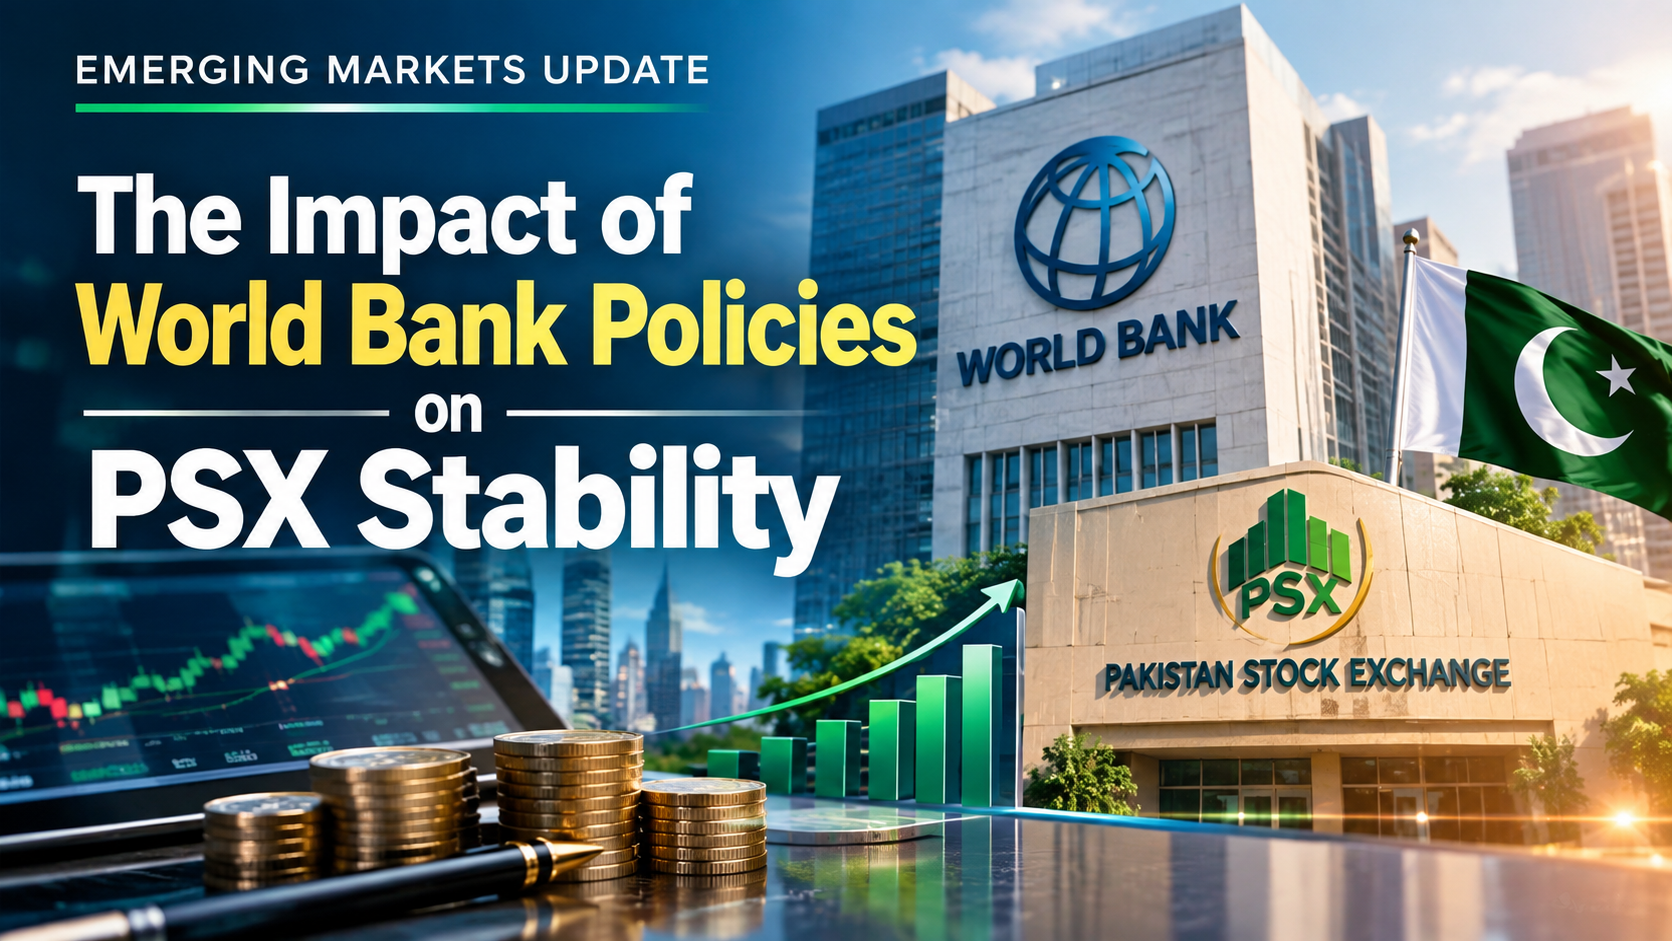
While the IMF’s disbursing Extended Fund Facility gets most of the market-moving headlines for Pakistan, the World Bank’s parallel analytical work — through its biannual Pakistan Development Update and its MENAAP regional economic updates — provides a very different, and arguably more sobering, lens on the structural forces shaping PSX stability. This piece works through what the Bank’s own data actually says, and why it sits somewhat uneasily alongside the KSE-100’s blockbuster 2026 performance.
The World Bank’s Pakistan Growth Forecast
The World Bank’s Pakistan Development Update, titled Staying the Course for Growth and Jobs, projects Pakistan’s real GDP growth to remain at 3.0% for FY26 (the fiscal year ending June 2026) — unchanged from the 3.0% Pakistan actually achieved in FY25, itself an improvement from 2.6% the year before. The Bank attributes the flat FY26 forecast primarily to the devastating impact of the 2025 floods across Punjab and Sindh, which reduced agricultural output by nearly 10% and damaged major crops including rice, sugarcane, wheat, cotton, and maize.
Agriculture is not a marginal sector in this context — it supports nearly 40% of Pakistan’s labour force and contributes roughly one-fifth of GDP, meaning flood-related disruption there ripples through the broader economy well beyond the farm sector itself. The Bank projects growth picking up to 3.4% in FY27, contingent on continued macroeconomic stability and successful implementation of ongoing reforms — but explicitly notes that tight fiscal policy aimed at rebuilding economic buffers will continue to constrain the pace of any rebound.
The Regional Picture: MENAAP Under Pressure
Pakistan doesn’t sit in isolation from the wider region the World Bank tracks, and the regional numbers paint an even more difficult picture. The Bank’s Middle East, North Africa, Afghanistan, and Pakistan (MENAAP) regional economic update — most recently refreshed in April 2026 under the title Challenges of Conflict and Industrial Policy for Development — shows that, excluding Iran itself, overall regional growth is expected to slow from 4.0% in 2025 to just 1.8% in 2026, a downgrade of 2.4 percentage points versus the Bank’s January projections.
The Bank’s July 2026 Global Economic Prospects update reinforces this framing, explicitly identifying MENAAP as “the worst affected” region globally by the Middle East conflict, while noting that South Asia — the broader grouping that includes Pakistan alongside India and Bangladesh — remains comparatively the fastest-growing region, with impacts varying based on each country’s energy exposure, strategic reserves, and available policy buffers. For Pakistan specifically, that framing matters: as a net energy importer without the Gulf region’s oil-export offsets, Pakistan sits closer to the vulnerable end of that regional spectrum.
The Uncomfortable Poverty Data Behind the Growth Numbers
Perhaps the most striking figures in the World Bank’s Pakistan analysis aren’t growth rates at all, but poverty statistics. Between 2018 and 2023, the share of Pakistan’s population living below the international poverty line of $3 per day (PPP) surged from 16.5% to 46% — a reversal of years of prior progress. At the slightly higher $4.20-per-day threshold, the Bank estimates nearly nine in ten Pakistanis now live in poverty, reflecting the combined toll of pandemic-era disruption, sustained inflation, and repeated climate disasters including the 2022 and 2025 floods.
The Bank explicitly warns that this sharp deterioration risks entrenching inequality and social instability — a structural risk that sits in tension with the more optimistic, momentum-driven narrative often associated with the KSE-100’s record-breaking equity performance over the same period.
Reform Levers the World Bank Is Watching
On the policy side, the Bank has highlighted Pakistan’s National Tariff Policy (2025–2030), which aims to cut tariffs by roughly half over five years, as a potentially meaningful driver of longer-term export competitiveness. However, the Bank is careful to caveat that the benefits of tariff liberalization will take time to materialize and depend heavily on complementary reforms across logistics, taxation, and energy pricing — areas where Pakistan’s track record on sustained implementation has historically been mixed.
World Bank Data Snapshot
| Metric | Figure |
|---|---|
| Pakistan FY26 GDP growth (World Bank forecast) | 3.0% |
| Pakistan FY27 GDP growth (World Bank forecast) | 3.4% |
| MENAAP region 2026 growth (ex-Iran) | 1.8%, down from 4.0% in 2025 |
| Population below $3/day poverty line (2023) | 46%, up from 16.5% in 2018 |
| Population below $4.20/day poverty line | ~90% |
| Agricultural output loss from 2025 floods | ~10% |
Why the Disconnect Matters for PSX Investors
The tension here is real and worth naming directly: the KSE-100 delivered a 44% gain in FY26, even as the World Bank’s own growth forecast for that same fiscal year sat at a comparatively modest 3.0%, against a backdrop of surging poverty and a sharply downgraded regional outlook. This isn’t necessarily contradictory — equity markets often price forward-looking reform momentum, IMF program credibility, and remittance-driven currency stability well ahead of broad-based GDP or poverty statistics catching up. But it does mean investors relying purely on KSE-100 price action risk missing the structural fragility the World Bank’s data continues to flag: a economy still highly exposed to climate shocks, regional conflict spillover, and deep social strain that hasn’t meaningfully eased even as headline stock returns have soared.
Frequently Asked Questions
What does the World Bank forecast for Pakistan’s economy in 2026?
The World Bank’s Pakistan Development Update projects 3.0% GDP growth for FY26, held back by 2025 flood damage to agriculture, with growth expected to pick up to 3.4% in FY27 contingent on continued reforms.
Why has poverty risen so sharply in Pakistan despite stock market gains?
World Bank data shows the population below the $3-per-day poverty line surged from 16.5% to 46% between 2018 and 2023 due to pandemic disruption, inflation, and repeated flooding — a structural trend largely disconnected from the KSE-100’s recent equity-market rally.
How is the Middle East conflict affecting Pakistan’s regional growth outlook?
The World Bank’s MENAAP regional update shows growth excluding Iran slowing from 4.0% in 2025 to 1.8% in 2026, a downgrade attributed directly to the conflict’s spillover effects on energy prices and regional stability.
Discover more from The Economy
Subscribe to get the latest posts sent to your email.

10-Year Treasury Yield Tops 5%: What It Means for Mortgages, Stocks, and the Fed

Ceasefire Negotiations in 2026: Predicting the Rebound of European and Asian Economies

Emerging Markets Update: The Impact of World Bank Policies on PSX Stability

Costco Oil Shortage 2026: Will Prices Double for All Synthetic Motor Oils?

Trump’s $5,000 Promise: The Hidden Tax Implications for Retail Investors

Global Economy Outlook 2026: What Ceasefire Talks Mean for the Tech Sector

China Stocks Today: Are Big Economies in Asia Nearing a Market Bottom?

Stock Market Crash 2026? How the Trump $5,000 Dividend Impacts Global Inflation

Tax-to-GDP Ratio Explained: Global Benchmarks, Fiscal Sovereignty & 2026 Insights

Trade Deficit & Terms of Trade Explained: Global Impact, Real-World Examples, and 2026 Insights

Supply vs Demand Shocks Explained: Market Equilibrium, Inflation Risks & Policy Responses in 2026

Microeconomics vs. Macroeconomics Explained: Key Differences, Interdependence & Global Impact

Devaluation vs Depreciation: Clear Differences, Causes, and Economic Impact

Purchasing Power Parity (PPP) Explained: Global Rankings, Living Standards & Why Nominal Exchange Rates Mislead in 2026

State Farm’s $5B Dividend 2026: Who Qualifies & Payout Dates

US-China Relations in Q3 2026: Trade Tariffs and Supply Chain Risks

Gold’s Wild 2026: From a Record $5,600 Peak to a 24% Crash and Back Toward $4,500

Oil Surges as Strait of Hormuz Traffic Collapses Again

Bank of England Set to Hold Rates Through Year-End, Reuters Poll Shows

SpaceX Starship Flight 14: First Orbital Attempt & Starlink V3 Launch Explained

The 2026 Crypto Regulatory Shift: What It Means for Institutional Investors

Top 30 Stocks for Investment in PSX for Massive ROI in 2026

AI Chip Stocks 2026: The Best Semiconductor Investments Beyond Marvell

AI-Powered Training: The Next Multi-Billion Dollar Ecosystem in Fitness

Tween Back-to-School Trends 2026: What’s Driving the $85B Season

Russia’s Black Sea Oil Exports Fall for a Fifth Straight Week

Global Chip Selloff Deepens: What’s Driving the Aug. 19 Semiconductor Rout

Shein Clothes Quality & Safety in 2026: What Lab Tests Show
-

 Markets & Finance8 months ago
Top 15 Stocks for Investment in 2026 in PSX: Your Complete Guide to Pakistan’s Best Investment Opportunities
-

 Analysis7 months ago
Johor’s Investment Boom: The Hidden Costs Behind Malaysia’s Most Ambitious Economic Surge
-

 Analysis7 months ago
Top 10 Stocks for Investment in PSX for Quick Returns in 2026
-

 Analysis7 months ago
Brazil’s Rare Earth Race: US, EU, and China Compete for Critical Minerals as Tensions Rise
-

 Banks8 months ago
Best Investments in Pakistan 2026: Top 10 Low-Price Shares and Long-Term Picks for the PSX
-

 Investment8 months ago
Top 10 Mutual Fund Managers in Pakistan for Investment in 2026: A Comprehensive Guide for Optimal Returns
-

 Global Economy9 months ago
15 Most Lucrative Sectors for Investment in Pakistan: A 2025 Data-Driven Analysis
-

 Global Economy9 months ago
Pakistan’s Export Goldmine: 10 Game-Changing Markets Where Pakistani Businesses Are Winning Big in 2025