
Analysis
Stocks Surge as US-Iran Deal Ignites Global Rally

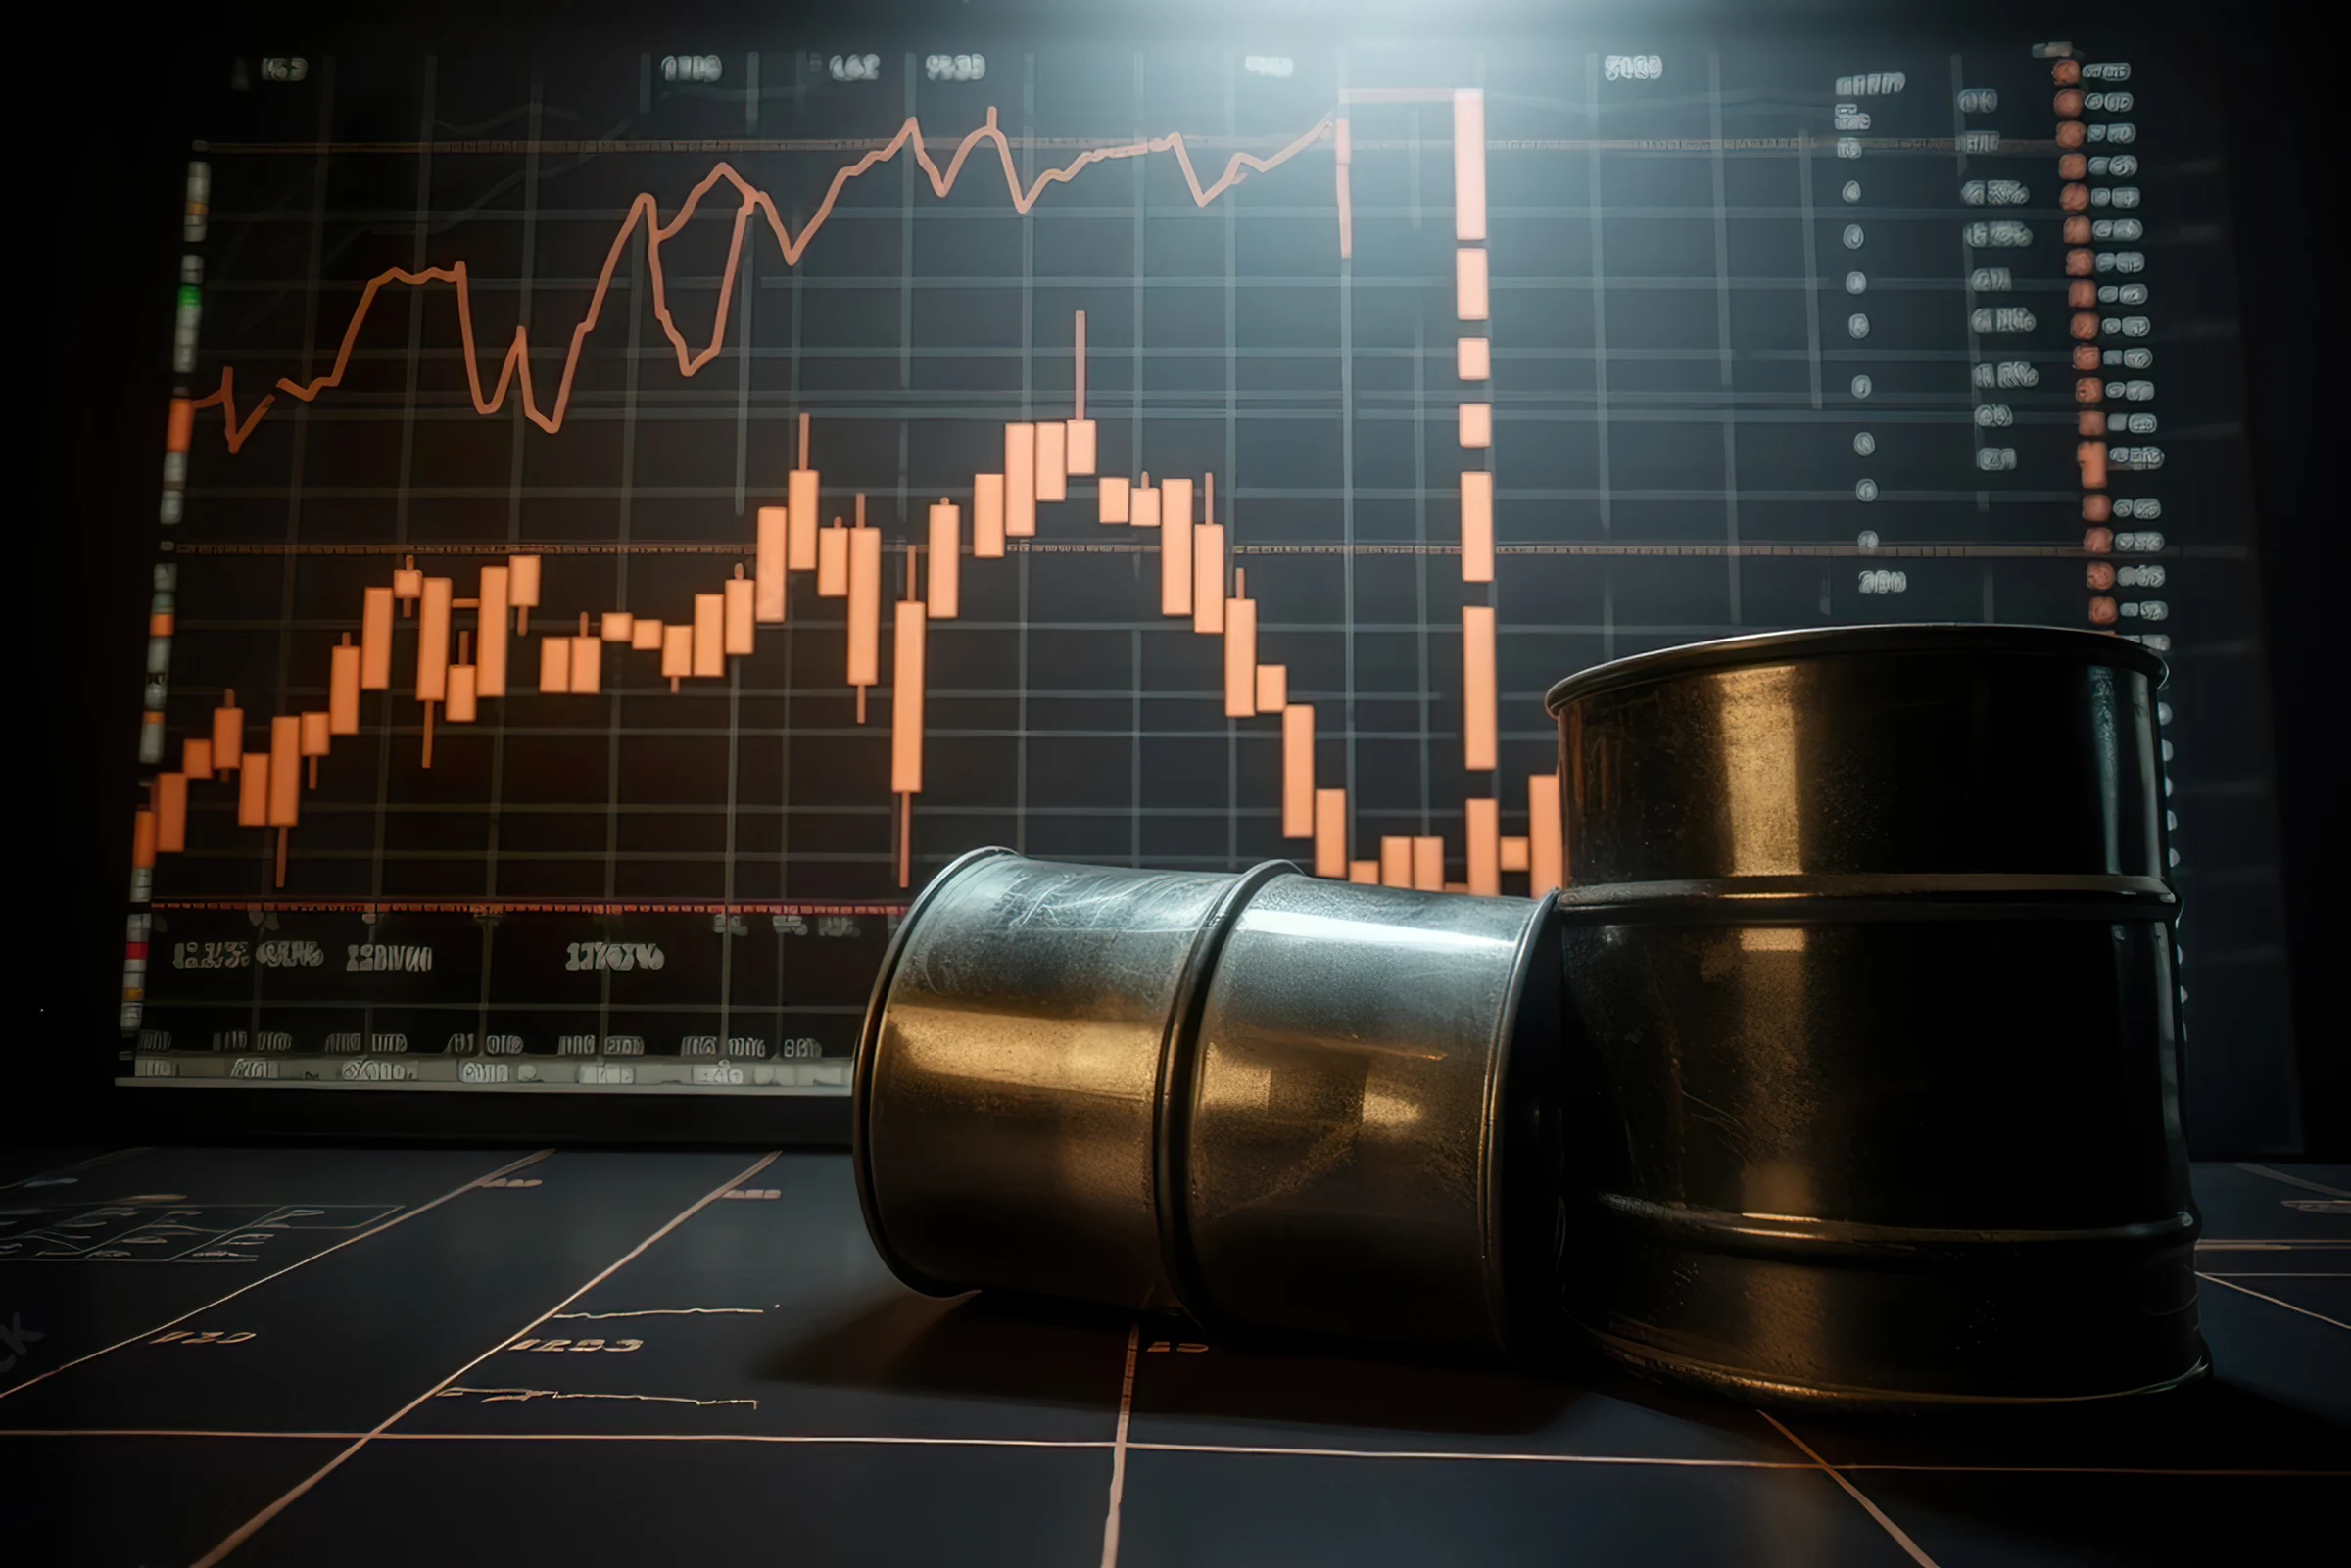
On Sunday evening, a post to Truth Social from President Donald Trump set financial markets alight. “The deal with Iran is now complete,” he wrote. By Monday morning, the S&P 500 had surged past 7,540, the Dow Jones Industrial Average was up more than 600 points to a fresh record of 51,725, and the Nasdaq Composite had rocketed nearly 3%. Crude oil, which had traded above $117 a barrel as recently as last week, plunged more than 5%. A four-month war, and the economic anxiety it generated, was — at least provisionally — over.
The stocks surge on the US-Iran deal reflected something deeper than relief. It was a collective re-pricing of global stability across every asset class simultaneously.
A World Holding Its Breath Since February
The crisis had its roots in the collapse of nuclear negotiations in Geneva in early 2026. On February 28, the United States and Israel launched coordinated air strikes against Iranian military infrastructure, triggering a closure of the Strait of Hormuz — the narrow channel through which roughly one-third of the world’s traded oil flows — and sending crude prices toward their highest levels since 2022.
For nearly four months, markets had lived under what strategists called a geopolitical risk premium: elevated energy costs, rising inflation expectations, suppressed equity valuations, and a Federal Reserve boxed into policy paralysis. US producer prices climbed 6.5% year-over-year in May 2026, according to the Bureau of Labor Statistics, underscoring how deeply the energy shock had fed into the broader price level. The European Central Bank responded by raising rates for the first time since 2023.
Gold, that oldest barometer of institutional fear, had surged above $5,100 an ounce earlier this year. By Monday it had retreated to $4,334 — still elevated, but telling. The fear trade was unwinding.
1 — The Core Development: What the Deal Actually Says
The agreement, expected to be formally signed in Switzerland on June 19, is structured as a 60-day ceasefire memorandum rather than a permanent treaty. Iran’s Supreme National Security Council confirmed the finalised text over the weekend; Pakistan’s Prime Minister Shehbaz Sharif, who played a notable mediating role during negotiations, announced the signing ceremony in a statement that briefly sent markets on a roller-coaster ride last week when his earlier proposal to extend Trump’s deadline was being processed by Washington.
Trump confirmed the deal would reopen the Strait of Hormuz “toll-free” and that the US naval blockade of Iranian ports would be lifted immediately. The provisional framework also reportedly includes sanctions relief for Tehran and commitments toward dismantling Iran’s nuclear programme, though the precise architecture of those provisions remains unpublished.
Markets didn’t wait for the fine print.
Brent crude fell $4.22, or 4.8%, to $83.11, while West Texas Intermediate tumbled $4.41, or 5.2%, to $80.47 — a dramatic reversal from the $117 peaks reached just days before. The Nasdaq Composite soared nearly 3%, the S&P 500 jumped 1.8%, and the Dow climbed 1.3% — extending what had already been Friday’s solid session for Wall Street.
The sectoral rotation was equally instructive. Shares of United Airlines jumped 3% while Delta Air Lines gained 1.5% — both carriers hammered by elevated jet fuel costs throughout the conflict. Royal Caribbean Group rose more than 4% and Carnival Corporation gained more than 3%, the cruise lines bouncing as energy cost headwinds eased.
Across Asia, the reaction was even sharper. Japan’s Nikkei 225 soared 5.5% in morning trading, while South Korea’s Kospi jumped as much as 5.7%. Taiwan’s Taiex climbed 2.7% and Australia’s ASX 200 rose approximately 1.5%. In Europe, the pan-European Stoxx 600 reached a record for the first time since late February, completing a round-trip that few analysts had predicted would happen this quickly.
Section 2 — The Analytical Layer: Relief Is Not Recovery
Why Did Stocks Surge After the US-Iran Deal?
Markets rallied because the deal eliminated the largest single source of macro uncertainty since early 2026. Yet the precise mechanism matters: this was not growth optimism driving prices higher. It was the unwinding of a fear premium — energy, inflation, and central bank risk — that had been embedded in asset prices for months.
What the rally actually signals about rate expectations
Stocks surge after the US-Iran deal principally because lower oil prices make the Federal Reserve’s job significantly easier. A sustained drop in crude reduces headline CPI directly and dampens core inflation indirectly through transport and manufacturing costs. Strategists at Stifel Nicolaus and Pepperstone Group cautioned that the agreement is “more likely to create a short-term trading opportunity than mark the start of a longer-term rally”, but even that framing understates the structural relief at play.
Stocks surged after the US-Iran deal because the agreement to reopen the Strait of Hormuz eliminated the geopolitical risk premium embedded in global markets since February 2026. Lower oil prices reduce inflation pressure, ease central bank hawkishness, and restore investor confidence in risk assets — all simultaneously.
The Bank of Japan provides a useful case study. Analysts noted that falling oil prices could temper expectations of a hawkish stance from BOJ Deputy Governor Shinichi Uchida, meaning the deal’s impact on monetary policy extends well beyond Washington and into Tokyo, where rate decisions carry enormous implications for yen-carry trades and global liquidity.
The picture is more complicated in Europe. The ECB had already moved, and its revised inflation forecasts for 2026 and 2027 were built on an energy-shock baseline. If Brent crude holds below $85 through Q3, those forecasts may require downward revision — with corresponding implications for the rate path.
That said, the MSCI Asia Pacific Index climbing as much as 3.2% in a single session represents more than just relief trading. Richard Tang, Head Equity Research Analyst Asia at Julius Baer, noted that “Asia, as an oil-importing region, should benefit from the deal to reopen the Strait of Hormuz,” adding that India remains an overweight market in the region as pressure from oil begins to ease. For emerging markets that have spent four months absorbing a terms-of-trade shock through expensive energy imports, this is genuinely structural.
3 — Implications and Second-Order Effects
The most immediate second-order effect is on global shipping and insurance markets. Despite the cessation of hostilities, analysts with political risk consultancy Eurasia Group warned that it may take several weeks for oil tanker traffic through the Strait of Hormuz to reach even 50% of its pre-war levels, as shipping and insurance companies will want to be confident the pact will hold before resuming normal operations.
This matters enormously. The psychological reopening of the strait and the physical reopening are two different events separated by weeks of verification. Shipping companies are not going to route tankers through a waterway where Iranian missile strikes were recorded as recently as March without independent assurance that the ceasefire is durable. Insurance premiums for passage will remain elevated for weeks at minimum, keeping some upward pressure on delivered energy costs even as spot crude falls.
For US households, the timeline for relief at the pump is similarly staggered. While gas prices could ease in the coming weeks, experts said they’re unlikely to return to pre-war levels anytime soon — continuing to place financial pressure on households and businesses even as financial markets celebrate. The national average for retail gasoline was $4.14 per gallon during peak tensions, against a pre-war level well below $3.50.
For policymakers, the deal provides a narrow window of opportunity. The Federal Reserve, which meets this week on interest rates, now faces a materially different set of assumptions than those underpinning its May projections. A continued decline in crude — if sustained — shifts the calculus meaningfully away from further hikes. Markets had been pricing a rate increase as the primary scenario; that pricing is now in flux.
There is a fiscal dimension too. The energy shock had been feeding into government bond markets through inflation expectations, pushing yields higher across the G7. Gold climbed above $4,300 on Monday as lower oil prices eased concerns over the prospect of interest rate hikes that had weighed on bullion — paradoxically, the peace deal is bullish for gold too, because it reduces the probability of further central bank tightening while simultaneously removing the fear premium.
For airlines and shipping, the deal is unambiguously positive. The CEO of Menzies Aviation, the world’s largest airport services company, warned that jet fuel prices are likely to stay elevated for several more months — a useful corrective against the temptation to extrapolate today’s stock prices into earnings forecasts.
4 — The Dissenting View: Reasons to Temper the Euphoria
Not everyone on Monday morning was buying the rally with conviction.
Strategists at KCM Trade, Pepperstone Group, and Stifel Nicolaus said the agreement is more likely to create a short-term trading opportunity than mark the start of a longer-term rally. Their reasoning deserves serious engagement.
The deal is, at this stage, a memorandum of understanding, not a treaty. The 60-day ceasefire window is explicitly designed to create space for broader negotiations on Iran’s nuclear programme, sanctions architecture, and the permanent status of the Strait of Hormuz. Each of those issues is independently capable of derailing the process. Iran’s Supreme Leader has not publicly endorsed the terms. The IRGC, which closed the strait and fired on tankers in March, operates with a degree of institutional autonomy that any paper agreement must ultimately accommodate.
Market analysts noted that while the deal framework is positive, questions remain about whether a permanent resolution will hold, with some investors cautioning that the agreement is still preliminary and that final terms could shift before the formal signing.
There is also the inflationary inheritance to account for. The conflict had already transmitted into price levels that won’t reset on a diplomatic announcement. US producer prices at 6.5% year-on-year, ECB forecasts revised upward, and household energy bills that remain structurally higher than their pre-February baselines — these are supply-side scars that take quarters, not days, to heal.
Is the global rally, then, a durable rotation or a relief spike? The honest answer is that Monday’s moves contain elements of both, and distinguishing between them will require watching crude inventories, tanker traffic data, and the Fed’s communications over the next six weeks more carefully than any single headline.
A Provisional Peace, A Provisional Reprieve
Four months of war compressed into a Truth Social post and an overnight market rally is, by any measure, a strange way for a geopolitical crisis to resolve itself. Yet here we are. The global equity rally ignited by the US-Iran deal reflects something real: a world that had priced in sustained conflict is now, tentatively, pricing in something closer to normalcy.
That normalcy remains conditional. The formal signing in Switzerland on June 19 will be closely watched for any deviation from the terms markets have already priced. The tankers waiting outside the Strait of Hormuz will be watched even more closely. And the Federal Reserve, meeting this week against a suddenly altered energy backdrop, will need to decide how much confidence to place in a diplomatic development that has not yet produced a single barrel of additional oil supply.
Markets have celebrated the announcement. The harder work — of energy market recovery, of institutional trust-building, of nuclear diplomacy — begins now.
What investors bought on Monday was not a guarantee. It was a door, cracked open for the first time in months.
Discover more from The Economy
Subscribe to get the latest posts sent to your email.



Navigating Mortgage and Loan Refinancing in a High-Yield Environment
Global public debt crossing critical thresholds has kept central bank policies volatile, resulting in fluctuating US Treasury yields throughout 2026. For homeowners and commercial property holders burdened by previous high-interest borrowing cycles, finding optimal refinance windows has become a high-stakes financial puzzle. Stalled disinflation and stubborn employment numbers mean rate cuts are incremental, requiring borrowers to act with precision.
Timing your mortgage or commercial loan refinance in this environment requires a deep understanding of yield curve movements and lender risk appetites.
Decoding 2026 Refinance Dynamics
The 10-Year Treasury Yield Benchmark
Mortgage rates continue to track closely with the 10-year US Treasury yield. When macroeconomic anxiety spikes debt issuance, yields rise, tightening consumer borrowing capacity. Savvy borrowers monitor weekly Treasury auctions to lock in rates during brief dip windows.
Hybrid ARMs and Alternative Structures
With fixed rates remaining elevated, 7/1 and 10/1 adjustable-rate mortgages (ARMs) have surged in popularity. These products offer lower initial monthly payments, giving borrowers breathing room until central bank easing cycles fully materialize.
| Loan Product | Current Rate Range | Best For | Key Risk Factor |
| 30-Year Fixed Mortgage | 6.2% – 6.8% | Long-term predictability | Higher initial monthly outlay |
| 7/1 Hybrid ARM | 5.5% – 5.9% | Short-term ownership / flipping | Rate reset risk after year 7 |
| Commercial Refinance | 7.0% – 8.2% | Corporate asset restructuring | Strict DSCR lender covenants |
Actionable Steps for Successful Refinancing
To maximize your chances of securing favorable refinance terms in a volatile market, follow a disciplined preparation strategy.
Boost Your Credit Score Immediately: Lenders in 2026 are applying stringent credit tiering; a 20-point increase can drop your APR by a crucial quarter-point.
Shop Regional Credit Unions: Smaller financial institutions often offer portfolio loans with more flexible underwriting than major national banks.
Calculate the Break-Even Point: Ensure your total closing costs are recouped through monthly savings within 24 months of closing.
“Market Strategist View: Refinancing in 2026 is an exercise in opportunistic timing. Borrowers must maintain immaculate financial profiles ready to strike the moment Treasury yields dip.”
Mastering the complexities of today’s debt environment ensures you can successfully lower your debt service costs and protect your long-term financial stability.
Discover more from The Economy
Subscribe to get the latest posts sent to your email.

The days of pulling generic auto insurance quotes based purely on your zip code and age are officially over. In 2026, insurance comparison engines are powered entirely by generative AI and real-time telematics. These platforms digest thousands of live data points—ranging from your driving smoothness via connected vehicle sensors to real-time traffic congestion patterns—to generate hyper-personalized premiums instantly.
For consumers, this evolution represents both a massive opportunity for savings and a hidden trap for penalty pricing. Understanding how AI algorithms evaluate risk is essential for anyone looking to lower their monthly auto insurance premiums.
How AI Comparison Engines Evaluate Your Risk Profile
Behavioral Telematics and Connected Cars
Modern cars stream performance data directly to insurance aggregators. Generative AI models analyze braking sharpness, acceleration curves, cornering G-forces, and phone distraction metrics. Drivers who maintain smooth, defensive habits are rewarded with dynamic rate cuts of up to 40% compared to traditional rating tiers.
Predictive Traffic and Weather Modeling
AI tools now cross-reference your daily commute route with predictive weather and accident probability models. If your standard parking location or driving corridor has a statistically higher incidence of uninsured motorist claims, your quotes will reflect that hyper-local risk assessment.
| Comparison Factor | Traditional Rating Model | 2026 Generative AI Model | Impact on Premium |
| Mileage & Usage | Annual estimated odometer reading | GPS tracking & live trip duration | High (up to 35% savings) |
| Driving Behavior | MVR driving record & accidents | Real-time braking, speed, & G-force | Critical (determines tier) |
| Vehicle Tech | Make, model, and safety rating | ADAS calibration & repair cost data | Moderate |
Strategies to Lower Your AI-Driven Insurance Quote
To outsmart the algorithm and secure the lowest possible premium in 2026, drivers must proactively manage their digital footprint on insurance platforms.
Opt-In for Telematics Trial Periods: Many insurers offer immediate 15% discounts just for installing their driving app; let it track safe habits for 30 days to lock in permanent savings.
Scrub Unverified Public Records: Ensure your motor vehicle report is free of clerical errors that AI risk models misinterpret as reckless behavior.
Compare AI Aggregators: Use platforms that integrate multi-carrier API feeds rather than single-brand comparison sites to find the best risk-adjusted rate.
“Industry Note: AI-driven pricing rewards transparency and precision. Drivers who actively manage their telematics data consistently out-save those relying on legacy quote calculators.”
Embracing AI comparison tools allows savvy policyholders to customize coverage limits precisely to their driving habits, eliminating wasted premium spend while ensuring robust protection.
Discover more from The Economy
Subscribe to get the latest posts sent to your email.

Despite decades of bans and strict handling mandates, asbestos remains a silent killer across legacy manufacturing plants, shipyards, and modern green-energy infrastructure retrofits. In 2026, regulatory changes by the EPA and tightened occupational health standards have triggered a fresh wave of mesothelioma litigation. Manufacturers attempting to fast-track industrial transitions are encountering catastrophic oversight, exposing workers to legacy toxins and opening corporate parent companies to unprecedented liability.
Navigating a mesothelioma claim in 2026 requires understanding how modern industrial supply chains intersect with historical exposure. Trusts established decades ago are being audited under stricter transparency laws, altering payout ratios and accelerating fast-track settlements for terminally ill plaintiffs.
Modern Industrial Exposure Hotspots
Green Retrofitting and Renewable Energy Infrastructure
A primary source of 2026 asbestos exposure occurs during the decommissioning and retrofitting of older industrial facilities for renewable energy production. Workers insulating electrical grids, modernizing HVAC systems, or upgrading manufacturing floors frequently disturb encapsulated asbestos materials that were improperly documented or ignored during facility audits.
Automotive and Aerospace Supply Chains
With advanced manufacturing booming, workers handling specialized friction materials, gaskets, and heat shields face ongoing risks. Supply chain tracing has become more sophisticated, allowing legal teams to pinpoint exact corporate entities responsible for raw material distribution across multinational borders.
| Industry Sector | Primary Exposure Risk | Legal Venue / Trust | Avg. Claim Value Range |
| Green Energy Retrofit | Disturbed insulation, pipe lagging | Federal Tort / Manufacturer Trust | $1.2M – $3.5M |
| Shipbuilding & Marine | Boiler insulation, structural seals | Asbestos Bankruptcy Trusts | $800K – $2.4M |
| Automotive Manufacturing | Brake components, high-heat gaskets | Third-Party Product Liability | $600K – $1.8M |
Securing Maximum Compensation: Steps for Plaintiffs
Time is of the essence in mesothelioma cases. Plaintiffs and their families must act decisively to secure financial recovery before statutes of limitations expire.
Retain Specialized Counsel: Work exclusively with national mesothelioma law firms possessing deep historical databases of asbestos-containing products.
Audit Employment History: Document every job site, supervisor name, and equipment brand encountered throughout your career.
Expedite Medical Filings: Secure a formal pathological diagnosis quickly to qualify for expedited trust fund distribution and priority trial settings.
“Expert Insight: Modern asbestos litigation is no longer just about historical tracking; it is about holding modern corporations accountable for failing to conduct rigorous environmental safety audits before initiating industrial retrofits.”
By combining meticulous work history reconstruction with aggressive multi-trust filings, victims can secure substantial financial relief to cover specialized immunotherapy and family support.
Discover more from The Economy
Subscribe to get the latest posts sent to your email.

10-Year Treasury Yield Tops 5%: What It Means for Mortgages, Stocks, and the Fed

Ceasefire Negotiations in 2026: Predicting the Rebound of European and Asian Economies

Emerging Markets Update: The Impact of World Bank Policies on PSX Stability

Costco Oil Shortage 2026: Will Prices Double for All Synthetic Motor Oils?

Trump’s $5,000 Promise: The Hidden Tax Implications for Retail Investors

Global Economy Outlook 2026: What Ceasefire Talks Mean for the Tech Sector

China Stocks Today: Are Big Economies in Asia Nearing a Market Bottom?

Stock Market Crash 2026? How the Trump $5,000 Dividend Impacts Global Inflation

Tax-to-GDP Ratio Explained: Global Benchmarks, Fiscal Sovereignty & 2026 Insights

Trade Deficit & Terms of Trade Explained: Global Impact, Real-World Examples, and 2026 Insights

Supply vs Demand Shocks Explained: Market Equilibrium, Inflation Risks & Policy Responses in 2026

Microeconomics vs. Macroeconomics Explained: Key Differences, Interdependence & Global Impact

Devaluation vs Depreciation: Clear Differences, Causes, and Economic Impact

Purchasing Power Parity (PPP) Explained: Global Rankings, Living Standards & Why Nominal Exchange Rates Mislead in 2026

State Farm’s $5B Dividend 2026: Who Qualifies & Payout Dates

US-China Relations in Q3 2026: Trade Tariffs and Supply Chain Risks

Gold’s Wild 2026: From a Record $5,600 Peak to a 24% Crash and Back Toward $4,500

Oil Surges as Strait of Hormuz Traffic Collapses Again

Bank of England Set to Hold Rates Through Year-End, Reuters Poll Shows

SpaceX Starship Flight 14: First Orbital Attempt & Starlink V3 Launch Explained

The 2026 Crypto Regulatory Shift: What It Means for Institutional Investors

Top 30 Stocks for Investment in PSX for Massive ROI in 2026

AI Chip Stocks 2026: The Best Semiconductor Investments Beyond Marvell

AI-Powered Training: The Next Multi-Billion Dollar Ecosystem in Fitness

Tween Back-to-School Trends 2026: What’s Driving the $85B Season

Russia’s Black Sea Oil Exports Fall for a Fifth Straight Week

Global Chip Selloff Deepens: What’s Driving the Aug. 19 Semiconductor Rout

Shein Clothes Quality & Safety in 2026: What Lab Tests Show
-

 Markets & Finance8 months ago
Top 15 Stocks for Investment in 2026 in PSX: Your Complete Guide to Pakistan’s Best Investment Opportunities
-

 Analysis7 months ago
Johor’s Investment Boom: The Hidden Costs Behind Malaysia’s Most Ambitious Economic Surge
-

 Analysis7 months ago
Top 10 Stocks for Investment in PSX for Quick Returns in 2026
-

 Analysis7 months ago
Brazil’s Rare Earth Race: US, EU, and China Compete for Critical Minerals as Tensions Rise
-

 Banks8 months ago
Best Investments in Pakistan 2026: Top 10 Low-Price Shares and Long-Term Picks for the PSX
-

 Investment8 months ago
Top 10 Mutual Fund Managers in Pakistan for Investment in 2026: A Comprehensive Guide for Optimal Returns
-

 Global Economy9 months ago
15 Most Lucrative Sectors for Investment in Pakistan: A 2025 Data-Driven Analysis
-

 Global Economy9 months ago
Pakistan’s Export Goldmine: 10 Game-Changing Markets Where Pakistani Businesses Are Winning Big in 2025