
Energy Economy
K-Electric Tariff Cut Sparks $2B Arbitration Crisis
The lights flickered in Rashid Ahmed’s textile factory in Karachi’s SITE industrial area on a sweltering October afternoon. Not from another power cut—those he’d grudgingly accepted as the cost of doing business in Pakistan—but from uncertainty. News had just broken that the National Electric Power Regulatory Authority (NEPRA) had slashed K-Electric’s tariff by Rs7.6 per unit, the steepest reduction the city’s sole power provider had seen in years. Ahmed’s electricity bill would drop, yes, but the veteran manufacturer knew something the celebratory headlines didn’t reveal: when regulators squeeze utilities this hard in emerging markets, someone always pays the price.
Six weeks later, that bill arrived—not to consumers, but to Pakistan itself, in the form of a a $2 billion arbitration claim filed by furious Gulf investors who now accuse Islamabad of regulatory sabotage.
This collision between populist rate relief, corporate profitability, and foreign investment protection has become the most consequential energy sector dispute in Pakistan’s recent history, with implications extending far beyond Karachi’s overloaded distribution network. It reveals fundamental tensions in how developing nations balance affordable electricity for 16 million consumers against the contractual promises made to privatized utilities—and the scorching retaliation that follows when that balance tips.
The Uniform Tariff Trap: How National Policy Caught K-Electric in Its Crosshairs
To understand why K-Electric’s Gulf investors are threatening Pakistan with its largest utility sector arbitration, one must first grasp the peculiar economics of Pakistan’s uniform tariff policy—a well-intentioned populist mechanism that has become a fiscal Frankenstein.
Unlike most countries where electricity prices reflect local generation costs and distribution efficiency, Pakistan mandates a single national tariff across all regions. Karachi consumers pay the same per-unit rate as those in Lahore or Peshawar, regardless of whether power comes from expensive furnace oil plants or cheaper hydroelectric dams. The difference? The federal government covers the gap through subsidies, which for fiscal year 2025-26 total Rs249 billion out of a Rs3,520 billion revenue requirement.
K-Electric occupies a uniquely vulnerable position within this framework. As Pakistan’s only vertically integrated private utility—privatized in 2005 to a consortium led by Saudi Arabia’s Al Jomaih Power and Kuwait’s Denham Capital—it operates independently from the national grid while simultaneously being subject to national pricing policies designed for state-owned distribution companies (DISCOs). For nearly two decades, this arrangement worked through an implicit bargain: K-Electric would modernize Karachi’s decrepit infrastructure while the government ensured cost-reflective tariffs that allowed reasonable returns.
That bargain shattered on October 21, 2025, when NEPRA reversed its own May 2025 determination—issued after two-and-a-half years of consultation—and slashed K-Electric’s multi-year tariff from Rs39.97 to Rs32.37 per kilowatt-hour. The reduction didn’t emerge from new operational data or efficiency gains. Rather, it stemmed from a review petition filed by Pakistan’s Power Division seeking to align K-Electric’s rates more closely with the Rs31.59 average for state DISCOs, thereby reducing the subsidy burden on federal coffers.
Anatomy of a Financial Shock: How Rs7.6 Per Unit Translates to Existential Crisis
The mathematics of K-Electric’s predicament are brutal. Each rupee reduction in tariff translates to approximately Rs15 billion in annual revenue loss, according to industry estimates cited by The News. The Rs7.6 cut therefore represents Rs110-120 billion annually, or roughly Rs700 billion over the seven-year control period through fiscal 2030.
But the damage extends beyond headline numbers. NEPRA’s revised determination fundamentally restructured K-Electric’s business model across multiple dimensions:
Return on Equity Denominated in Rupees: Previously, K-Electric’s transmission and distribution operations earned dollar-indexed returns—a standard protection against currency devaluation in emerging market infrastructure. NEPRA converted these to rupee-denominated returns, immediately slashing the real value of anticipated profits given Pakistan’s chronic depreciation pressures.
Capacity Payment Restructuring: The regulator terminated four aging gas-fired generation plants outright and altered payment formulas for remaining facilities. Only 35% of capacity payments are now guaranteed, with the remainder shifted from “take-or-pay” (payment regardless of dispatch) to “take-and-pay” (payment only when utilized)—mirroring the controversial Independent Power Producer (IPP) model that Pakistan has been trying to renegotiate nationwide.
Recovery Benchmarks Raised to 100%: K-Electric’s bill collection rate, which stood at 91.5% in fiscal 2023-24, must now reach 100% to avoid tariff penalties. This is particularly punishing for a utility serving Karachi’s sprawling informal settlements where electricity theft and non-payment remain endemic. For context, NEPRA allowed no recovery losses for Punjab’s five DISCOs, creating an impossible standard.
The financial impact has been swift and severe. Analysts at AKD Securities estimate that K-Electric’s Rs4 billion profit in fiscal 2024 could flip to a Rs70-80 billion annual loss once accounts are restated under the new tariff. K-Electric’s foreign shareholders project losses could reach Rs100 billion annually through 2030.
CEO Moonis Alvi, in a carefully worded video statement, acknowledged the utility was “reviewing how to continue operations” under the revised framework—corporate-speak that sent K-Electric’s share price tumbling and triggered alarm bells among energy analysts. One expert told Dawn newspaper the cut would cause “immediate financial and operational shocks,” warning that “you don’t pull hundreds of billions out of a utility and expect business as usual.”
The $2 Billion Reckoning: When Regulatory Reversal Becomes Investor Retaliation
The tariff cut was merely the spark. The kindling had been accumulating for nearly a decade.
On January 16, 2026, London-based law firms Steptoe International and Omnia Strategy filed a Notice of Arbitration on behalf of 32 Saudi individuals and entities linked to the Al Jomaih family, along with five Kuwaiti companies. Together holding a 30.7% indirect stake in K-Electric, they’ve appointed Professor Stephan Schill as their arbitrator and proposed the Permanent Court of Arbitration to oversee proceedings under the Organisation of Islamic Cooperation Investment Agreement and UNCITRAL Arbitration Rules.
The 39-page filing reads like an indictment of Pakistan’s investment climate, alleging systematic breach of treaty obligations across multiple fronts:
Indirect Expropriation Through Stalled Privatization: The investors agreed in October 2016 to sell 66.4% of K-Electric to Shanghai Electric Power Company for $1.77 billion. Despite initial regulatory support, the deal languished for over eight years amid “shifting conditions, contradictory instructions, and withheld national security approvals,” according to the filing. Shanghai Electric eventually withdrew, leaving investors without their planned exit and K-Electric without the capital infusion needed for grid modernization.
The aborted sale carries particular sting because it wasn’t a commercial failure—both parties wanted to proceed. Rather, it died of bureaucratic attrition and alleged political interference, what arbitration specialists call “creeping expropriation” where investment value is systematically destroyed through regulatory obstruction rather than outright seizure.
Unpaid Government Receivables: The investors claim nearly two decades of unpaid tariff differential subsidies and other receivables have “crippled K-Electric’s finances” while authorities continued imposing penalties for late payments on infrastructure investments. This creates a perverse dynamic where the government simultaneously owes the company money while fining it for cash flow problems caused by… the government not paying what it owes.
Tariff Framework Politicization: The October 2025 tariff reversal represents, in the investors’ view, the culmination of regulatory unreliability. They allege the government “reopened settled matters through flawed review processes” and imposed revised tariffs costing approximately Rs85 billion annually without proper consultation or respect for the multi-year certainty that tariff frameworks are meant to provide.
Failed Protection Against Hostile Takeovers: The filing also points to attempts by domestic investor Zia Chishty to gain control of K-Electric’s parent company through offshore structures, which Gulf shareholders characterize as an orchestrated takeover attempt that Pakistani authorities failed to prevent despite “repeated complaints.”
Pakistan now has 60 days to nominate its own arbitrator. If it fails to engage constructively, the case proceeds to a three-member tribunal that could award damages, impose injunctions, or order structural remedies. Previous arbitration cases in Pakistan’s power sector have cost the country heavily—the government’s forced renegotiations with IPPs in 2024-25, while technically “voluntary,” were driven partly by the threat of cascading arbitration claims.
Echoes of Emerging Market Privatization Failures: Argentina, Nigeria, and the FDI Death Spiral
Pakistan’s predicament with K-Electric is hardly unique. It echoes a familiar pattern across developing economies where infrastructure privatization meets fiscal desperation—a toxic combination that has destroyed investor confidence from Buenos Aires to Lagos.
Argentina’s experience with electricity privatization in the 1990s offers an especially cautionary parallel. After selling state utilities to Spanish and French consortiums, the government implemented an emergency tariff freeze during the 2001-02 economic crisis, converting dollar-denominated tariffs to pesos at par despite 75% currency devaluation. The resulting disputes spawned over 40 arbitration cases at the International Centre for Settlement of Investment Disputes (ICSID), with awards exceeding $1 billion. Two decades later, Argentina still struggles to attract foreign capital for energy infrastructure.
Nigeria’s privatization of its power sector in 2013 followed a similar trajectory. Distribution companies purchased at premium valuations quickly discovered the government wouldn’t honor subsidy commitments or permit cost-reflective tariffs for fear of political backlash. By 2020, most DISCOs were technically insolvent, and foreign investors had written down their stakes to near zero. The World Bank’s 2025 Investment Climate Statement for Pakistan notes that such regulatory unreliability “directly undermines FDI” and creates lasting reputational damage.
For Pakistan, the timing couldn’t be worse. Foreign direct investment, excluding retained earnings, has cratered below $1 billion annually—a figure that pales against regional competitors. Vietnam attracted $6.9 billion in just the first two months of 2025, a 68% year-on-year surge. India, despite recent slowdowns, maintains FDI flows an order of magnitude higher than Pakistan’s. Even Bangladesh, wracked by political turmoil, attracts proportionally more investment relative to GDP.
The K-Electric dispute signals to potential investors that contractual commitments in Pakistan’s infrastructure sector are vulnerable to unilateral revision whenever fiscal pressures mount—precisely the message a country desperate for investment in renewable energy, mining, and digital infrastructure cannot afford to send.
The Circular Debt Paradox and Pakistan’s Energy Sector Checkmate
K-Electric’s crisis is symptomatic of a larger dysfunction: Pakistan’s power sector circular debt, which now exceeds Rs1.693 trillion and growing. This represents unpaid obligations cascading through the system—the government owes subsidies to utilities, utilities owe fuel suppliers, suppliers owe refineries, and consumers owe utilities for unpaid bills.
The uniform tariff policy, intended to shield consumers from high electricity costs, has become a primary driver of this debt spiral. By setting retail prices below cost-recovery levels and failing to fully fund the resulting subsidies, the government essentially finances consumption through arrears. K-Electric is both victim and participant: owed billions in historical subsidies while struggling to collect from consumers, it now faces tariff cuts that make cost recovery impossible even with perfect collections.
NEPRA’s October 2025 decision crystallizes the impossibility of Pakistan’s energy policy trilemma: keep tariffs low for political survival, maintain utility profitability to attract investment, and avoid ballooning subsidies to meet IMF fiscal targets. Pakistan has been pretending it could satisfy all three simultaneously. The K-Electric tariff cut represents the moment that pretense collapsed—solving the subsidy problem by transferring Rs700 billion in costs to private investors who, predictably, are now threatening to walk away.
Climate Ambitions Meet Investment Reality: The Renewable Energy Stakes
Beyond immediate financial ramifications, the K-Electric dispute threatens Pakistan’s nascent renewable energy ambitions. Karachi’s utility had secured Pakistan’s lowest renewable tariffs through competitive bidding—Rs8.9 to Rs11.6 per unit for 640 MW of solar and wind projects at Dhabeji, Winder, and Bela. These projects, approved by NEPRA in May 2025, represented a rare bright spot in Pakistan’s energy transition.
But capital-intensive renewable projects require regulatory certainty above all else. Solar and wind facilities have high upfront costs and decades-long payback periods, making them exquisitely sensitive to policy risk. If Gulf investors—historically among the most patient infrastructure capital providers—can have their tariffs retroactively slashed by 19% despite multi-year regulatory approval, why would any renewable energy developer believe their 20-year power purchase agreement will be honored?
The broader climate finance implications are sobering. Pakistan requires an estimated $348 billion through 2030 to meet its climate commitments, according to its updated Nationally Determined Contribution. Perhaps $101 billion of that must come from private sources, primarily foreign investment in renewable energy. Yet Pakistan’s investment climate is characterized by “bureaucratic red tape, policy unpredictability, weak contract enforcement, and infrastructure deficits”—precisely the conditions that make climate finance impossible to mobilize at scale.
Development banks like the Asian Development Bank and Green Climate Fund have structured some risk mitigation, including guarantees for distributed solar projects. But these mechanisms only work if host governments maintain baseline regulatory credibility. The K-Electric precedent suggests Pakistan may be dismantling that credibility precisely when climate change makes energy transition most urgent.
Karachi’s Power Future: Infrastructure Investment or Managed Decline?
For Karachi’s 16 million residents and Pakistan’s industrial heartland, the immediate question is whether K-Electric can maintain, let alone improve, service quality under financial duress.
The utility met Karachi’s peak summer 2025 demand of 3,563 MW with 3,545 MW supply—a credible performance for a grid serving one of the world’s largest cities. But that reliability required sustained capital expenditure: transmission upgrades, distribution network expansion, loss reduction programs, and the commissioning of 900 MW in new generation capacity at the RLNG-based BQPS-III plant.
Under the revised tariff, such investments become financially irrational. Why would shareholders inject capital into a utility whose regulator retroactively reduces approved returns? The likely outcome: K-Electric enters maintenance mode, avoiding major capital commitments while extracting whatever cash flows remain. This means delayed grid upgrades, slower expansion to underserved areas, and potentially deteriorating reliability as equipment ages without replacement.
The government’s implicit bet is that K-Electric’s investors will accept diminished returns rather than abandon a strategic asset. That calculation may prove catastrophically wrong. Saudi and Kuwaiti investors entered K-Electric in 2005 with a 20-year horizon; they’re now 20 years in with nothing to show but mounting losses and broken promises. The arbitration filing suggests they’ve reached the breaking point.
One scenario sees the Gulf investors eventually selling to domestic Pakistani conglomerates at fire-sale valuations, as occurred with some IPPs in 2024. Pakistani business groups, with deeper political connections and lower cost of capital, might accept returns that foreign investors cannot. But this would mark another retreat of foreign capital from Pakistan’s infrastructure sector—a symbolic defeat for a country trying to project itself as investment-ready.
Policy Pathways: Can Pakistan Restore Credibility?
Pakistan faces a choice between two paths, neither painless but one potentially transformative.
Path One: Managed Retreat and Renationalization—Pakistan could accept that private sector participation in distribution and integrated utilities has failed, compensate K-Electric’s investors at some negotiated value, and fold the utility back into state control. This would be honest but devastating for Pakistan’s broader privatization agenda. The government is currently trying to sell Pakistan International Airlines and several power sector assets; K-Electric’s effective renationalization would make those sales nearly impossible at acceptable valuations.
Path Two: Regulatory Reset with Credible Commitments—Alternatively, Pakistan could use the K-Electric crisis to fundamentally reform its approach to private infrastructure. This would require:
- Independent Regulatory Insulation: Strengthening NEPRA’s independence and establishing binding limits on government review petitions. The October 2025 reversal occurred because the Power Division could file a review petition triggering full reconsideration—a mechanism that makes any determination provisional.
- Subsidy Transparency and Fiscal Realism: Acknowledging that uniform tariffs require fully-funded subsidies appropriated in the budget, not off-balance-sheet arrangements that collapse during fiscal stress. If Pakistan cannot afford Rs700 billion in power subsidies over seven years, it should adjust tariff policy rather than retroactively slashing approved rates.
- Arbitration Clause Enforcement: Rather than fighting every arbitration claim, Pakistan should establish domestic mechanisms that give investors confidence their grievances will be heard fairly. The Investment Ombudsman created under the 2022 Special Investment Facilitation Council has potential but needs demonstrated credibility.
- Ring-Fencing Privatized Assets: Privatized entities like K-Electric should be explicitly excluded from policy measures designed for state-owned enterprises, or compensated when subjected to such measures. The recent IPP renegotiations, while financially beneficial short-term, sent a devastating signal about contractual sanctity.
Finance Minister Muhammad Aurangzeb’s “Uraan Pakistan” initiative, outlined at the World Economic Forum, promises improved investment climate and partnerships in priority sectors. But rhetoric without institutional reform is merely noise. Global investors have heard similar promises from Pakistan before—and watched them dissolve under political pressure.
The Karachi Canary: What K-Electric Signals for Pakistan’s Economic Future
Energy policy is often where investment climates live or die in developing economies. Electricity is essential yet politically volatile, capital-intensive yet long-cycle, technically complex yet visible to every voter. How governments handle this trilemma reveals whether they prioritize short-term political expediency or long-term institutional credibility.
K-Electric’s predicament suggests Pakistan is failing this test. By retroactively slashing tariffs after a multi-year regulatory process, the government solved an immediate subsidy problem while destroying long-term investor confidence. The Rs700 billion transferred from K-Electric to the federal budget over seven years will be dwarfed by the tens of billions in foregone investment as other investors price Pakistan risk higher.
The $2 billion arbitration claim is a symptom, not the disease. The disease is a political economy where every institution—regulatory bodies, courts, even constitutional protections for private property—can be overridden when fiscal desperation meets populist pressure. Pakistan’s investment-to-GDP ratio has fallen to a 50-year low of 13.1%, according to the 2025 Investment Climate Statement. That didn’t happen by accident; it’s the rational response to a system where contracts are perpetually renegotiable and yesterday’s approved project becomes tomorrow’s “excessive profit” to be clawed back.
For the textile manufacturer in SITE industrial area, the K-Electric tariff cut won’t translate to lower bills—the uniform tariff mechanism ensures his rates remain unchanged. What he’ll experience instead is gradually deteriorating grid reliability, more frequent unscheduled outages, and slower response times as K-Electric starves infrastructure investment. The savings on paper evaporate in lost production hours.
Pakistan’s leaders have a brief window to demonstrate they understand what’s at stake. The Gulf investors have given the government 60 days to respond before arbitration proceeds. That period could be used for genuine engagement: acknowledging the regulatory whiplash, negotiating some compensatory adjustment, and establishing credible protections against future retrospective changes.
More likely, bureaucratic inertia and political denial will prevail until a tribunal awards damages Pakistan cannot afford to pay, further eroding sovereign creditworthiness and cementing the country’s status as an investment graveyard.
The lights in Rashid Ahmed’s factory will likely keep flickering—no longer from uncertainty, but from a grid starved of the investment it desperately needs. In the annals of infrastructure privatization failures, K-Electric’s slow-motion collapse may rank as among the most preventable, arising not from force majeure or technological disruption but from simple failure to honor commitments. That is perhaps the cruelest epitaph: Pakistan had a functioning private utility that invested $4.7 billion over two decades, reduced losses, and expanded capacity. It chose to destroy it for Rs700 billion in short-term fiscal relief—a bargain Mephistopheles himself would have declined as too one-sided.
Discover more from The Economy
Subscribe to get the latest posts sent to your email.


Analysis
Singapore’s Growth Beat Hides a Harder Question: Can MAS Keep Tightening Into a War-Driven Inflation Shock?
Singapore’s economy grew 5.7% year-on-year in Q2 2026, beating consensus forecasts of 5.5% but decelerating from Q1’s revised 6.3% pace. Manufacturing, powered by an AI-related semiconductor “supercycle,” was the standout driver. The deceleration, however, arrives just as the Monetary Authority of Singapore prepares a policy decision complicated by rising inflation risk tied to the Iran conflict.
The Headline Numbers
Singapore’s Ministry of Trade and Industry reported advance Q2 2026 GDP growth of 5.7% year-on-year, ahead of the 5.5% Reuters consensus but down from a revised 6.3% in Q1 (IBTimes Singapore). On a quarter-on-quarter seasonally adjusted basis, GDP rose 1.1%, following 1.3% growth in Q1. Manufacturing expanded 12.2% year-on-year, up sharply from 8.0% in the prior quarter and the clearest evidence yet of how central Singapore has become to the global AI hardware supply chain (CNBC).
Forecasters have responded by upgrading their outlooks. UOB Global Economics and Markets Research raised its full-year 2026 GDP forecast to 4.8% from 4%, citing sustained AI-related demand, while Nomura pointed to a broadening “semiconductor super cycle” as a key driver of upside risk to its own 4.6% forecast (Xinhua).
The MAS Dilemma
Singapore does not set monetary policy through interest rates but by managing the Singapore dollar’s trading band against a basket of currencies — the S$NEER framework. In April 2026, MAS raised the rate of appreciation of that band, tightening policy in response to inflation risk tied to the Iran conflict, and simultaneously raised its 2026 inflation forecast range to 1.5–2.5%, up from 1.0–2.0% (IBTimes Singapore).
The central bank’s next policy review, due before the end of July, arrives at an awkward moment: growth is decelerating from its Q1 peak even as inflation risk from the Gulf conflict remains elevated. CPI inflation held at 1.8% in May 2026, its joint-highest reading since September 2024 (CNBC).
A Region Serving as Shipping’s Overflow Valve
One underreported dimension of Singapore’s exposure to the Hormuz conflict: the city-state has seen increased vessel traffic as ships reroute around Africa or use Singapore as a stopover hub for displaced shipping, according to the Monetary Authority of Singapore’s own macroeconomic review (MAS Macroeconomic Review, April 2026). This gives Singapore a curious dual exposure to the conflict: it benefits from increased logistics and trans-shipment activity even as it absorbs higher energy import costs.
Growth Forecast Range Holds — For Now
The Ministry of Trade and Industry has maintained its official 2026 growth forecast at 2.0–4.0%, explicitly citing elevated downside risk from the US-Israel-Iran conflict even as it acknowledges that actual growth has been tracking well above that range in the first half of the year (MTI). That gap between the official forecast band and independent economists’ more bullish revisions reflects genuine uncertainty about how durable the AI-driven manufacturing boom will prove if geopolitical risk intensifies again.
Why This Matters for Global AI Supply Chains
Singapore’s position at the center of the “semiconductor supercycle” narrative connects directly to the broader AI chip investment story unfolding in the US and China (see our companion coverage). As a hub for both electronics manufacturing and financial services, Singapore’s growth trajectory functions as a leading indicator for global AI hardware demand more broadly.
Key Takeaways
- Singapore’s Q2 2026 GDP grew 5.7% year-on-year, beating forecasts but decelerating from Q1, driven by a 12.2% surge in manufacturing output.
- MAS tightened monetary policy in April 2026 specifically in response to Iran-conflict-linked inflation risk, and faces a delicate policy call later this month.
- Singapore has a dual exposure to the Hormuz conflict — benefiting from rerouted shipping traffic while absorbing higher energy costs.
- Independent forecasters have raised 2026 growth estimates to as high as 4.8%, well above the MTI’s official 2.0–4.0% range.
Discover more from The Economy
Subscribe to get the latest posts sent to your email.
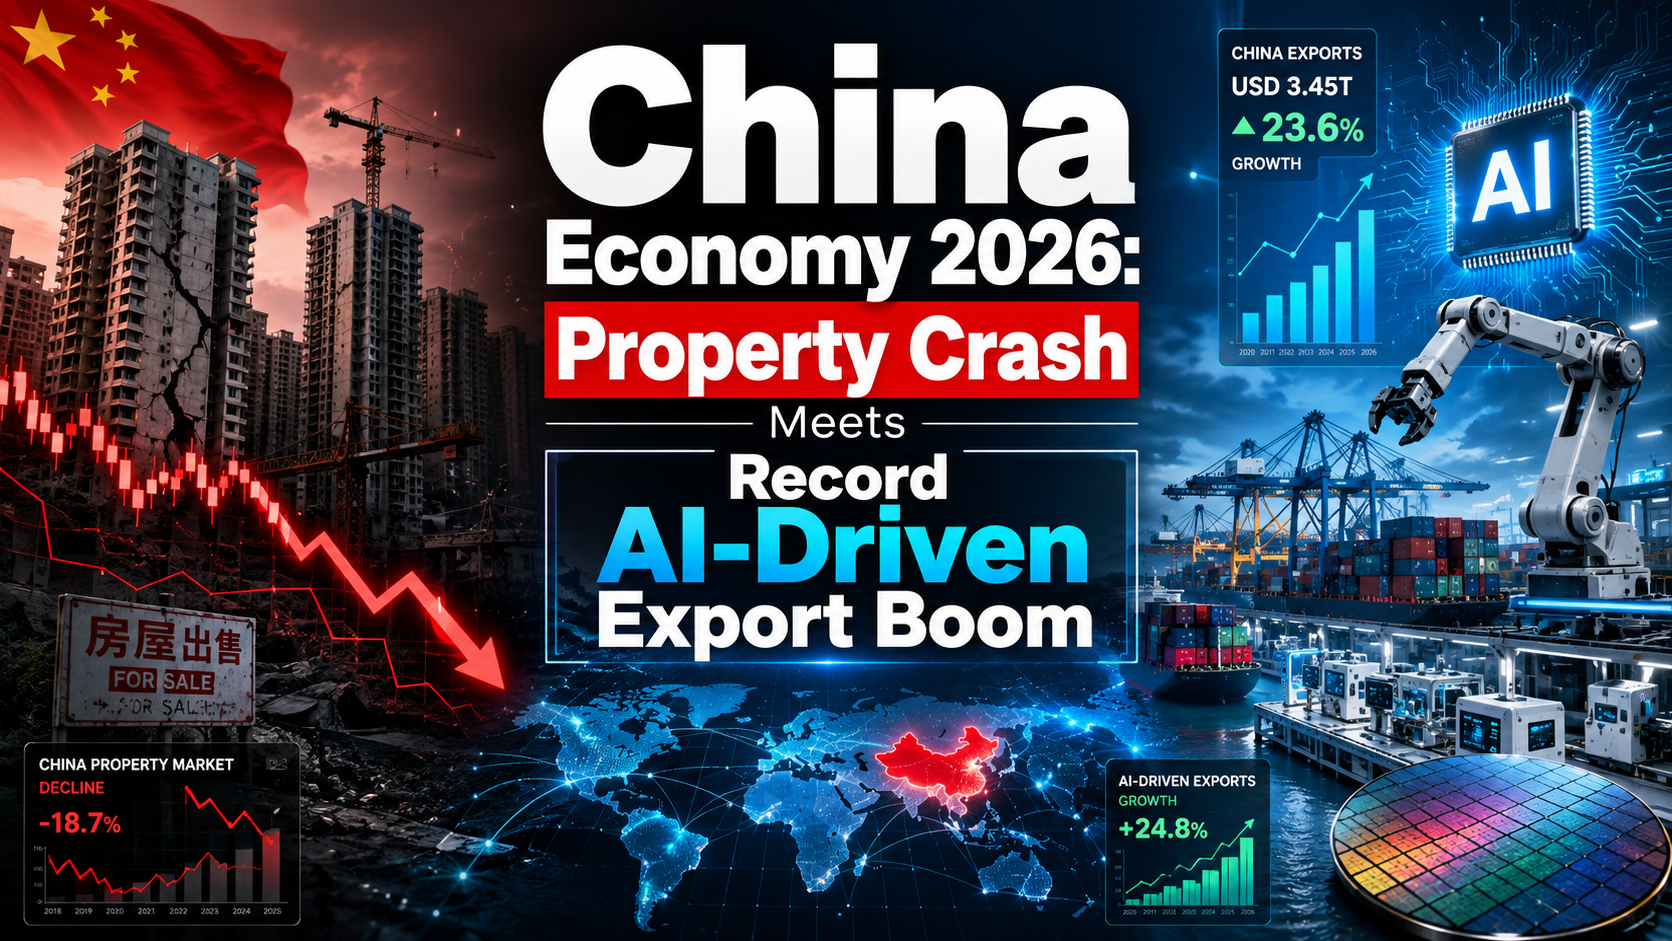
China’s economy is being pulled in two directions at once. Fixed-asset investment fell 4.1% year-on-year in the first five months of 2026 — the steepest decline since May 2020 — while exports surged 19.6% in May alone, powered overwhelmingly by semiconductor and AI-hardware demand, according to Deloitte’s Weekly Global Economic Update.
The Property Sector’s Deepening Slide
Property investment within that fixed-asset figure fell 16.2% year-on-year, the sharpest drop recorded in the current downturn. Roughly two-thirds of Chinese household wealth is held in property, so the sustained decline in home values is pushing consumers toward higher savings and lower spending as they attempt to rebuild balance sheets, per Deloitte’s analysis from chief global economist Ira Kalish. Government efforts to stabilize the housing market have so far failed to reverse the trend, with the excess capacity built during the prior debt-fueled construction boom still working through the system.
Exports Riding the Global AI Supercycle
The export side of the ledger tells a starkly different story. Semiconductor exports rose 110% year-on-year in May, mobile phone exports climbed 44%, and exports of automatic data-processing machines — the category covering computer and data-storage components — increased 66%. The May export growth of 19.6% was the second-largest year-on-year increase since January 2022, trailing only the 39.6% surge recorded in January–February 2026. Part of that strength reflects inventory build-up by global buyers anticipating further supply-chain disruption from the ongoing Middle East conflict.
Tariff Investigations Add a New Layer of Risk
Even as exports boom, the trade environment China and its partners face is becoming more adversarial. The US administration has launched an investigation into 60 countries — including the European Union — to determine whether they are importing goods made with forced labor, with the goal of imposing tariffs ranging from 10% to 12.5%. The move sets the stage for renewed friction even after the US and EU reached a trade agreement approved by the European Parliament the previous year, according to Deloitte’s tracking of the administration’s tariff strategy.
The China-Russia Financial Relationship Under New Strain
China’s export strength has not shielded it from secondary pressure tied to its economic relationship with Russia. US Treasury sanctions actions have begun targeting cross-border payment channels between Russian and Chinese entities used to facilitate sensitive-goods transactions, and Chinese banks have reportedly started refusing payments from Russian counterparties amid the threat of US secondary sanctions, according to CEPA’s analysis of the sanctions squeeze. China has supplied more than 90% of Russia’s semiconductor imports since the Ukraine war began, per CSIS’s research on sanctions reshaping Russia’s economy, making Beijing’s compliance posture a critical swing factor for Moscow’s continued access to Western-branded technology.
What It Means for the Regional Outlook
Asia House projects China’s growth easing modestly from 4.8% in 2025 to 4.6% in 2026, a relatively soft landing given the scale of tariffs imposed on Chinese exports, reflecting redirected trade flows toward Asian and European markets and a weaker real effective exchange rate, according to Asia House’s Annual Outlook. For ASEAN economies plugged into China’s supply chains — Malaysia and Vietnam in particular — the divergence between China’s property drag and export strength will remain a key variable shaping regional growth through the rest of 2026.
Discover more from The Economy
Subscribe to get the latest posts sent to your email.
Russia’s federal budget collected less revenue in 2025 than originally planned for the first time since the pandemic, a shortfall that has pushed the Kremlin to raise its value-added tax rate from 20% to 22% starting January 1 and pull far more small businesses into the VAT system, according to The Moscow Times’ assessment of the country’s 2026 fiscal trajectory.
The Oil Money Is Drying Up
The core of Russia’s budget problem is straightforward: oil and gas revenue, the traditional backbone of Kremlin finances, has fallen by more than 25% as a stronger ruble and tightening Western sanctions squeeze what Moscow can earn from crude exports, according to the New Eurasian Strategies Centre’s analysis. When the 2025 budget was set, revenues were projected at 40.3 trillion rubles; updated forecasts now suggest actual collections closer to 36.6 trillion rubles, a gap of roughly $46 billion at current exchange rates, per The Moscow Times.
The World Bank expects a global oil supply surplus to push Brent crude prices down from an average of $68 a barrel in 2025 to around $60 in 2026, the lowest level in five years, further squeezing the discount Russia must already offer buyers willing to purchase sanctioned crude. With GDP estimated at 217.3 trillion rubles in 2025, total defense spending of around 15.86 trillion rubles, more than $198 billion, now represents a share of the economy that leaves little room for the civilian investment that might otherwise support long-term growth, The Moscow Times reports.
A Central Bank Fighting Inflation on Its Own
Against this fiscal backdrop, the Bank of Russia has pursued an unusually consistent disinflation campaign under Governor Elvira Nabiullina, cutting its key rate eight consecutive times from a record 21% last June down to 14.25% by its June 2026 decision, according to the central bank’s own rate announcement. That June cut of just 25 basis points came in below the market’s median expectation of a 50-basis-point reduction, with the central bank citing persistent pro-inflationary risks tied to higher energy prices from the Middle East war, refinery damage from Ukrainian strikes, and wage growth that continues to outpace productivity, per Trading Economics’ tracking of the decisions.
Annual inflation stood at 5.6% as of mid-June, still well above the Bank of Russia’s 4% target, though down meaningfully from the 9.5% rate recorded in 2025, according to the central bank’s own data. The Moscow Times’ longer analysis of the anti-inflation campaign notes that Russia’s consumer price index rose 39% across the four full wartime years from 2022 to 2025, compared with 61% in Ukraine over the same period, and a staggering 200%-plus in Iran, framing Nabiullina’s inflation-targeting approach as unusually disciplined by wartime standards, per The Moscow Times’ longer profile of the policy.
The Cost of That Discipline
That discipline has not come free. The New Eurasian Strategies Centre describes Russia as moving through the final phase of a familiar economic cycle: downturn, fiscal stimulus, inflation, interest rate rises, downturn again, disinflation, rate cuts, and eventually recovery, a sequence the think tank says has suppressed economic activity across many sectors as interest-rate pressure compounds the drag from sanctions and wartime resource reallocation, according to its analysis of key rate dynamics. Growth forecasts for both 2025 and 2026 now cluster around just 1%, according to Russia’s own Economic Forecasting Institute and the IMF alike, a marked slowdown from the wartime stimulus-driven expansion of earlier years.
A potential end to the war in Ukraine, paradoxically, could increase short-term recession risk by reducing output in defense-related industries and lowering household incomes tied to military production, the New Eurasian Strategies Centre’s analysis notes, underscoring how deeply the war economy has become embedded in Russia’s growth model.
New Taxes on Everything From Laptops to Small Firms
Beyond the VAT increase, Russian authorities are lowering the annual revenue threshold for mandatory VAT registration from 60 million rubles to just 10 million rubles, sweeping far more small and medium-sized enterprises into the tax system, according to The Moscow Times’ January analysis. The government also plans a new levy on finished electronic goods including laptops, smartphones, and lighting products. The head of Russia’s New People party has publicly warned that lowering the VAT threshold will disproportionately hit small and medium-sized enterprises in the regions, according to reporting cited in the same Moscow Times analysis, a rare instance of intra-establishment pushback on fiscal policy.
What to Watch Next
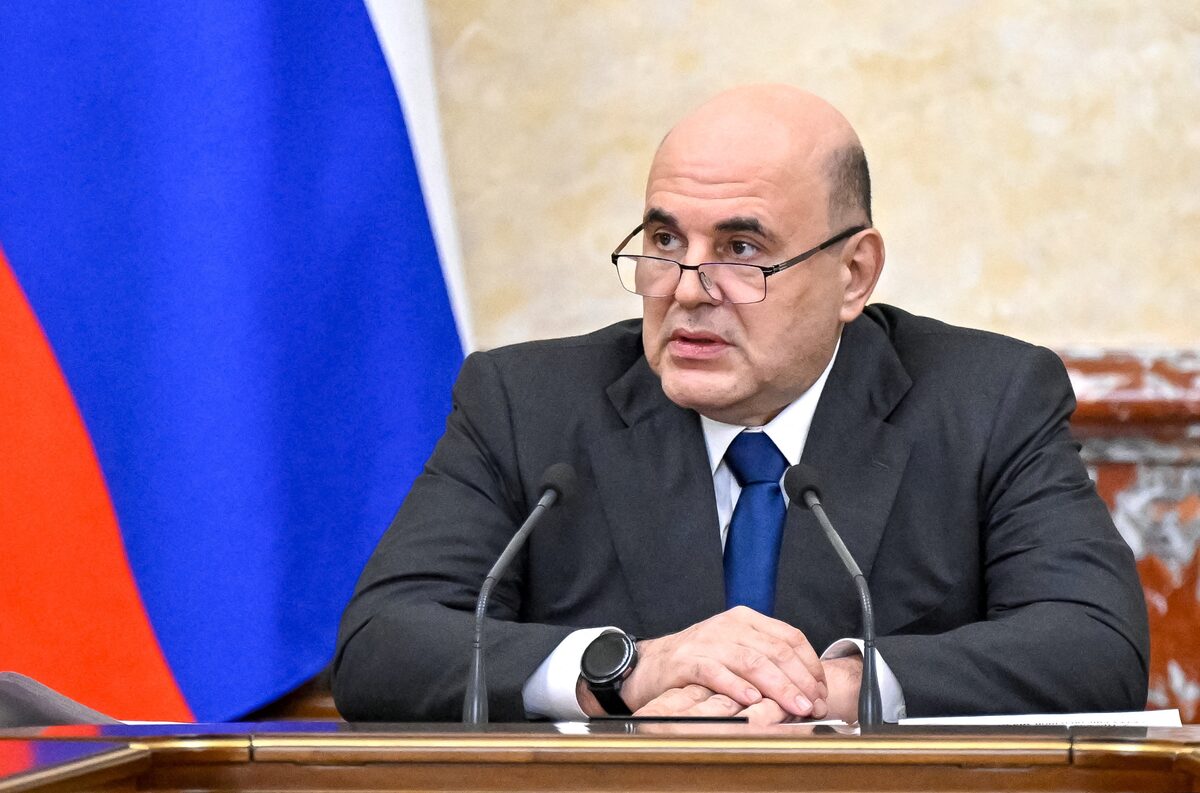
The Bank of Russia’s next key rate decision falls on July 24, with a summary of the prior meeting’s discussion published July 1, according to the central bank’s own communications calendar. Nabiullina has reaffirmed that inflation should return to the 4% target sometime in 2026, a view broadly shared by Prime Minister Mikhail Mishustin and Finance Minister Anton Siluanov, though The Moscow Times notes that even Defense Minister Andrei Belousov has, with some reservations, supported the anti-inflation policy, a rare point of consensus across an otherwise divided Russian economic leadership. Whether that consensus survives a second consecutive year of budget shortfalls and rising consumer taxes is the question shaping Russia’s economic trajectory through the remainder of 2026.
Discover more from The Economy
Subscribe to get the latest posts sent to your email.

Gulf Capital Retreat From Pakistan 2026: UAE Loan Freeze & What It Means

Pakistan’s Most Reliable Export Is Its People: Remittances Hit $41.6 Billion, Overtaking Total Exports

Indonesia’s Confidence Problem: Record Investment, a Sinking Rupiah, and a Widening Credibility Gap

Down But Not Out: Inside the Slow Sinking of Russia’s War Economy

China’s Growth Slips to a Four-Year Low: Why Beijing Still Won’t Pull the Stimulus Trigger

The Johor-Singapore Corridor: How Malaysia Became Southeast Asia’s AI Infrastructure Powerhouse

Canada’s Economy ‘On Pause’: Inside the CUSMA Deadline That Passed Without a Deal

Dubai’s Millionaire Magnet: How the UAE Turned Middle East Turmoil Into a Capital Safe-Haven Boom

Britain’s Sixth Prime Minister in a Decade: What Starmer’s Exit Means for Gilts, Sterling and Your Portfolio

Anthropic Offers Up to $600,000 Salary for Critical IPO Role as AI Giant Prepares for Wall Street Debut

EU Readies Crisis Team for Potential China Rare Earths Stand-Off as Supply Chain Risks Mount

Singapore Weighs Hedge Fund Tax Cuts to Counter Hong Kong’s Growing Financial Challenge

Facebook and Instagram Experience Global Outage

Inside the $1 Billion Tap-to-Pay Fraud Rings Targeting Banks and Retailers

Carry Trade Unwind 2026: How the Yen’s Snapback Triggered a Global Margin Call

AI Bubble Warning 2026: Why BIS, IMF and Bank of England Fear a Market Crash

Male Labor Force Participation Rate 2026: Why Men Are Leaving & Economic Impact

BRICS De‑Dollarization Strategy Takes Shape with $15 Billion Local‑Currency Push

Russia Bans Diesel Exports 2026: Global Fuel Market Impact Explained

The AI Super Bubble Is Ready to Burst

Strait of Hormuz Blockade 2026: Oil Prices Surge 9% as US-Iran Conflict Reignites

IMF Cuts Pakistan Growth Forecast, Raises Inflation to 8.4%

Private Credit Warning: Most BDCs Turn Unprofitable in 2026, Reuters Finds

India Economic Rise 2026: How the Subcontinent Toppled Japan
Gulf Capital Retreat From Pakistan 2026: UAE Loan Freeze & What It Means

Bitcoin $150k Milestone Achieved as US Sovereign Crypto Pivot Looms

Strait of Hormuz 2026: Why Markets Still Don’t Trust It’s Open

Chipmakers Just Lost 6.7% in Two Days: Inside the Great AI Trade Rotation
-

 Markets & Finance7 months ago
Top 15 Stocks for Investment in 2026 in PSX: Your Complete Guide to Pakistan’s Best Investment Opportunities
-

 Analysis5 months ago
Johor’s Investment Boom: The Hidden Costs Behind Malaysia’s Most Ambitious Economic Surge
-

 Analysis5 months ago
Top 10 Stocks for Investment in PSX for Quick Returns in 2026
-

 Analysis6 months ago
Brazil’s Rare Earth Race: US, EU, and China Compete for Critical Minerals as Tensions Rise
-

 Banks6 months ago
Best Investments in Pakistan 2026: Top 10 Low-Price Shares and Long-Term Picks for the PSX
-

 Investment7 months ago
Top 10 Mutual Fund Managers in Pakistan for Investment in 2026: A Comprehensive Guide for Optimal Returns
-

 Global Economy7 months ago
15 Most Lucrative Sectors for Investment in Pakistan: A 2025 Data-Driven Analysis
-

 Global Economy7 months ago
Pakistan’s Export Goldmine: 10 Game-Changing Markets Where Pakistani Businesses Are Winning Big in 2025