
Analysis
Asia’s Energy Triage Amid the Iran War
The Conflict Is Exposing a Hierarchy of Energy Vulnerability Across the Indo-Pacific
Live Data Snapshot — March 12, 2026
Indicator Figure Global oil & LNG offline ~20% Brent crude (bbl) ~$107 South Korea KOSPI (Mar 9) −6.0% Japan Nikkei 225 (Mar 9) −5.2% Hormuz oil bound for Asia 84% Effective Hormuz closure duration 12 days
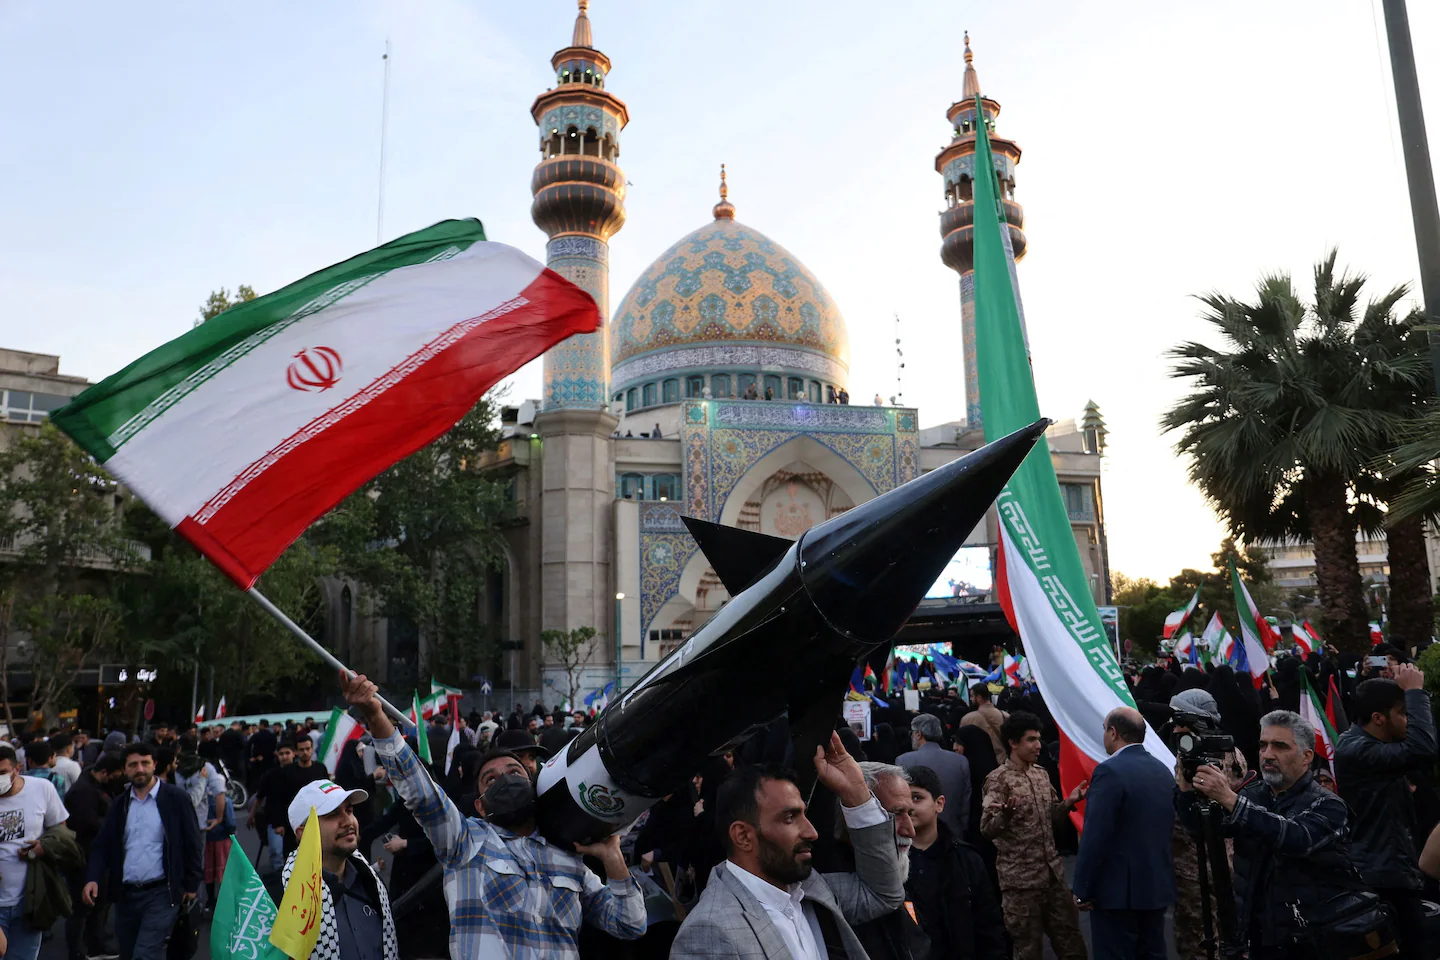
On the morning of March 9, a trading floor in Seoul fell silent in the way that trading floors only fall silent when something truly systemic is breaking. South Korea’s KOSPI had already plunged 8 percent in early trading — its second circuit-breaker halt in four sessions — before closing down 6 percent at 5,251. Across the Korea Strait, Tokyo’s Nikkei 225 was off more than 5 percent. In Manila, the government had already announced a four-day workweek for public offices. In Bangkok, the prime minister had capped diesel prices. Brent crude, which had been $73 a barrel just two weeks before, was trading above $119 — its highest print since Russia’s 2022 invasion of Ukraine.
These are not coincidental data points. They are the first vital signs of a patient whose diagnosis is the same in every language: acute energy shock. Twelve days after U.S. and Israeli forces struck Iran on February 28, killing Supreme Leader Ali Khamenei and triggering retaliatory strikes across the Gulf, the Strait of Hormuz — through which roughly 20 percent of the world’s daily oil supply and an equivalent share of global LNG transits — is effectively closed. As RBC Capital Markets global commodity strategist Helima Croft told NPR, “We’re now facing what looks like the biggest energy crisis since the oil embargo in the 1970s.” Iran achieved it not with a naval armada, but with cheap drones and the credible threat of mines.
What those initial market readings are only beginning to reveal, however, is something more structural than a price spike: a hierarchy of energy vulnerability across the Indo-Pacific that this crisis is making impossible to ignore. Asia absorbs 84 percent of the crude oil and 83 percent of the LNG that normally transits the Strait, according to U.S. Energy Information Administration data. Four economies — China, India, Japan, and South Korea — accounted for nearly 69 percent of all Hormuz crude flows in 2024. Their factories, semiconductor fabs, petrochemical complexes, and power grids are all downstream of that 34-kilometer chokepoint. But their capacity to absorb the shock is radically unequal. That inequality is the real story of Asia’s energy triage amid the Iran War.
The Choke: How a 21-Mile Strait Became Asia’s Oxygen Line
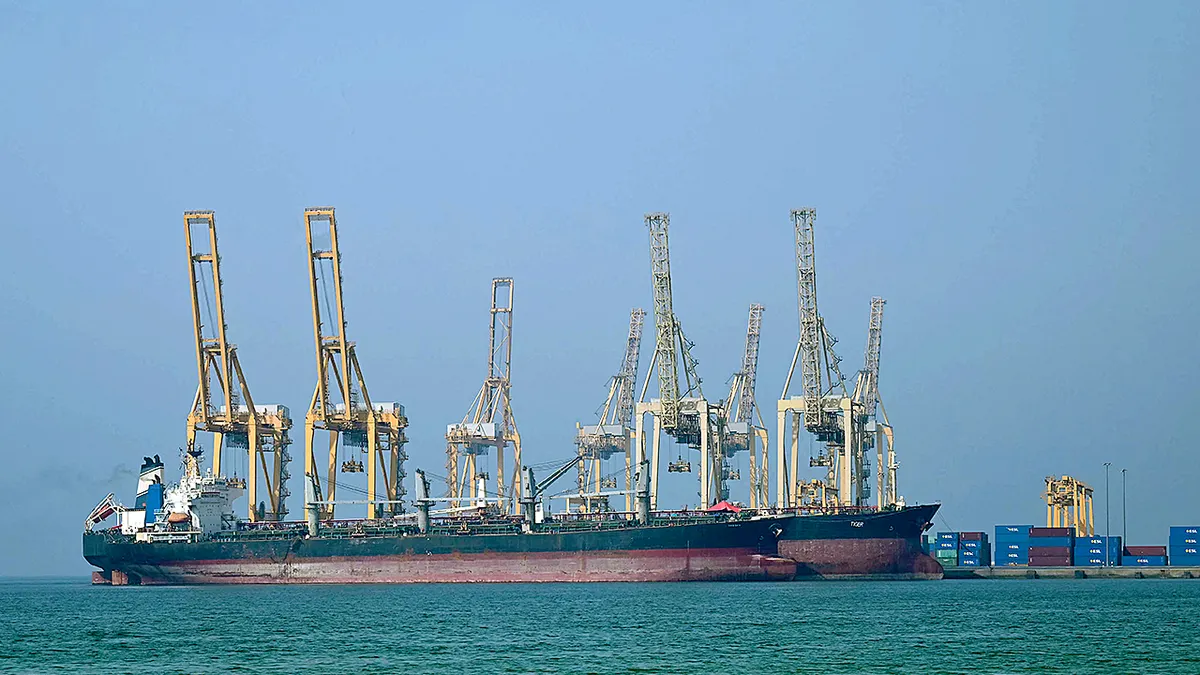
The Strait of Hormuz is 21 miles wide at its narrowest. The navigable shipping lanes are barely two miles across in each direction. Iran achieved its effective closure not with an internationally illegal blockade, but with something far more economical: targeted drone strikes on vessels transiting its approach, the apparent laying of a modest number of naval mines, and a sustained VHF radio warning from the Islamic Revolutionary Guard Corps that “no ship will be permitted to pass.” Within hours of Tehran’s warnings, the world’s major Protection and Indemnity insurers withdrew war-risk coverage. Shipping companies, unwilling to send crews and vessels through an uninsured war zone, stood down. Tanker traffic dropped by 70 percent within 48 hours and fell to near zero within a week.
The immediate impact is well-documented: nearly 15 million barrels per day of crude and 4.5 million barrels of refined products are stranded inside the Gulf, filling storage tanks that were designed for throughput, not warehousing. Iraq has begun shutting down production in its largest fields because it has nowhere to send the oil. Qatar’s Ras Laffan complex — the world’s largest LNG export facility, responsible for roughly 20 percent of globally traded LNG — suspended operations after an Iranian drone strike in the facility’s vicinity in the opening days of the conflict. The IEA has announced its largest emergency reserve release in history, some 400 million barrels in coordination with member states. The U.S. alone is contributing 172 million barrels from the Strategic Petroleum Reserve. None of this is close to adequate for a disruption that, by the EIA’s own accounting, represents the largest supply interruption since the 1970s — double the Suez Crisis’s 9–10 percent share of global trade.
What makes the current crisis categorically different from previous Gulf emergencies is its LNG dimension. The world has never stress-tested a simultaneous disruption of both oil and LNG flows through Hormuz at scale. Qatar’s suspension of Ras Laffan operations — even if temporary — sent European natural gas prices up 45 percent and delivered a supply shock for which strategic reserves simply do not exist in the same way they do for crude oil. There are no LNG equivalents to the SPR. Liquefied natural gas cannot be easily stockpiled above a few weeks’ operational buffer. And it is here that the Indo-Pacific’s hierarchy of vulnerability becomes most stark.
“This is about as wrong as things could go at any single point of failure in global oil markets.”
— Kevin Book, Clearview Energy Partners, quoted in NPR (March 4, 2026)
The Hierarchy of Vulnerability: A Three-Tier Framework
Not all of Asia is equally exposed to this shock. Understanding the Indo-Pacific’s energy triage requires mapping the region not by geography but by a more revealing metric: the intersection of import dependency, reserve depth, portfolio diversification, and institutional capacity to respond. That map produces a clear three-tier structure.
Tier 1 — Stressed but Managed: Japan & South Korea
Deep strategic crude reserves. Critical LNG exposure.
Over 150–208 days of strategic crude cover. LNG is the binding vulnerability: Japan holds 2–4 weeks, South Korea 9–52 days of operational inventory. Both are activating reserves, seeking emergency spot LNG from Australia, Canada, and the U.S., and implementing price caps. Survival is not in question; rationing may be.
Tier 2 — Scale With Exposure: China & India
Stockpile cushion versus structural brittleness.
China holds an estimated 1.2–1.3 billion barrels in strategic and commercial reserves (~108–130 days of cover) and benefits from Russian supply independent of Hormuz. India holds ~15 days of strategic crude and has already begun LNG rationing. Both face acute LPG and LNG shortfalls and are pivoting further toward Russian supply, reshaping Indo-Pacific geopolitics in the process.
Tier 3 — Acute Crisis: Southeast Asia & the Pacific
Thin margins, thin reserves, no buffer.
The Philippines, Thailand, Vietnam, Myanmar, Laos, Cambodia, and Pacific Island nations face immediate rationing, four-day workweeks, and export bans. Qatar supplied 42.5% of Singapore’s LNG and 42.7% of Thailand’s in 2025. Several nations hold less than 30 days of crude cover and have no meaningful alternative supply. The civilian pain here is already severe.
Asia-Pacific Energy Exposure Profile — March 2026
| Economy | Middle East Oil Dependence | Hormuz Exposure | Strategic Crude Reserve | LNG Buffer | Vulnerability Tier |
|---|---|---|---|---|---|
| Japan | ~90% | ~70% | ~150 days | 2–4 weeks | Tier 1 (Stressed) |
| South Korea | ~70% | ~65% | ~208 days | 9–52 days | Tier 1 (Stressed) |
| China | ~50% | ~50% | ~108–130 days | Weeks (partial coal hedge) | Tier 2 (Cushioned) |
| India | ~45% | ~45% | ~15 days | <2 weeks | Tier 2 (Acute) |
| Thailand | High | ~42.7% LNG from Qatar | Low | Very thin | Tier 3 (Crisis) |
| Philippines | ~95% | Very high | Minimal | Days | Tier 3 (Crisis) |
| Singapore | High | ~42.5% LNG from Qatar | Regional hub | Weeks (hub buffer) | Tier 2/3 (Transition) |
Sources: EIA, Kpler, Atlantic Council, The Diplomat, parliamentary disclosures. Data as of March 12, 2026.
Tier 1: Japan and South Korea — The Illusion of Preparedness
Japan and South Korea look, on paper, like the region’s best-prepared economies. Japan holds national and commercial strategic petroleum reserves covering approximately 150 days of net crude imports, according to Atlantic Council analysis of Kpler data. South Korea holds roughly 208 days. Both governments have moved rapidly: Japan’s refiners have formally requested reserve releases; Seoul has imposed the first fuel price caps in nearly three decades and announced a 100 trillion won ($68.3 billion) economic stabilization fund. Given that both economies source 70–90 percent of their crude from the Middle East — with roughly 70 percent of Japan’s supply transiting Hormuz directly — the response has been considered and reasonably swift.
But crude oil is only half the story, and it is the easier half. LNG is the binding constraint, and it is here that both countries’ preparedness assumptions collapse. South Korea’s working LNG inventory at import terminals covers roughly nine days of consumption, according to a parliamentary disclosure last week — though the government’s own figure is closer to 52 days. Japan holds an estimated two to four weeks. These are not strategic reserves in any meaningful sense; they are operational buffers, maintained not for crisis but for routine supply chain management. And they are draining at a rate that no emergency spot LNG cargo from Australia, Canada, or the United States can replace in the near term. Arranging alternative LNG cargoes requires weeks of logistics, and the global spot market was already tight before the war.
The semiconductor dimension adds a further layer of systemic risk that most energy analyses have underweighted. South Korean lawmaker Kim Yong-bae told Reuters this week that the chip industry is alarmed not just by energy costs but by the potential loss of helium — a byproduct of natural gas processing in which the Gulf is a major producer — that is essential to semiconductor fabrication. Samsung Electronics fell 7.81 percent on March 9; SK Hynix shed 9.52 percent. For economies whose export competitiveness rests on fabrication nodes measured in nanometers, the energy triage is already a technology security problem.
Tier 2: China and India — Asymmetric Resilience
China occupies a paradoxical position in this crisis: on paper the most exposed, in practice the most insulated. The People’s Republic holds the world’s largest onshore crude stockpiles, estimated at 1.2 to 1.3 billion barrels in combined strategic and commercial reserves, according to data from Kpler and the Atlantic Council. At current refinery runs of 15.5 million barrels per day, that represents approximately 108 to 130 days of import cover — a buffer built deliberately and methodically over nearly a decade of strategic pre-positioning, accelerated sharply after tensions in the Taiwan Strait began rising in 2023 and 2024. Beijing had added approximately 100 million barrels to its stockpiles in the twelve months before the war broke out, taking advantage of lower global prices and deeply discounted Russian and Iranian supply.
China has also spent two decades building structural energy independence that is now proving its strategic value. Coal and renewables dominate its power mix. Half of all nuclear reactors under construction worldwide are in China. In 2024, virtually all electricity demand growth was met by clean sources. As Foreign Policy argued this week, China’s push to become an “electrostate” — reducing its exposure to liquid fuels for power generation — means that even a prolonged LNG disruption can be partially bridged with domestic coal, a hedge that Japan and South Korea, which have been actively winding down coal generation capacity, cannot easily replicate. Beijing has also ordered state refiners to suspend petroleum product exports to conserve domestic supply, a mercantilist move that tightens Tier 3’s already critical situation.
Yet China’s resilience has a structural floor — and possibly a geopolitical ceiling. LNG is Beijing’s soft underbelly. Qatar supplies approximately 30 percent of China’s LNG imports, and China’s rapidly growing gas-fired industrial and heating sector cannot be fully substituted by coal at speed. This is why Beijing moved with unusual diplomatic urgency within 48 hours of the war’s outbreak, pressing Tehran not to target LNG tankers or Qatari export infrastructure. China’s foreign ministry called for an end to hostilities; China’s special envoy Zhai Jun condemned attacks on civilian infrastructure. These are not the statements of a government indifferent to the crisis. They are the statements of a government that has bought itself time — but not immunity.
India’s position is the most acute of the major powers. New Delhi holds strategic crude reserves of approximately 39 million barrels across three underground caverns — roughly 15 days of total imports — in a reserve system that was designed for a smaller economy and has never been fully tested in a drawdown scenario. India has already begun rationing LNG, raised LPG prices, and watched the rupee slide to near-record lows. Its benchmark indices recorded their worst week in over a year. Prime Minister Modi’s visit to Israel in the days just before the strikes has generated significant diplomatic discomfort, complicating New Delhi’s traditional posture of strategic non-alignment. Almost half of India’s crude imports and roughly 60 percent of its natural gas supplies transit Hormuz. The pivot to Russian crude, already well underway since 2022, will now accelerate sharply — deepening a bilateral energy dependency that Washington will watch with considerable unease.
Tier 3: Southeast Asia’s Acute Pain — The Region Nobody Prepared For
If Japan and South Korea face a managed crisis and China a cushioned one, Southeast Asia and the Pacific face something rawer: an emergency without a safety net. The Philippines imports nearly all of its crude from the Middle East, holds minimal strategic reserves, and is entirely dependent on imported LNG for its gas-fired power generation. The four-day government workweek announced in Manila this week — ordering agencies to cut energy consumption by 10 to 20 percent — represents a war-footing conservation measure that peacetime governments rarely invoke. Emergency fuel subsidies are under study. Gas queues stretched for blocks in Metro Manila on March 9.
Thailand and Vietnam have moved to restrict official travel and encourage remote work. Myanmar has imposed alternating driving days. Thailand has already suspended crude exports — except to Cambodia and Laos, which lack refining capacity and depend on Bangkok’s surplus. China has ordered its state refiners to cease petroleum product exports entirely, a decision that will ripple through the informal supply chains feeding Laos, Cambodia, and Myanmar within weeks. Petrochemical companies including Singapore’s Aster Chemicals and Indonesia’s PT Chandra Asri Pacific have already begun declaring force majeure on contractual obligations.
The Economist Intelligence Unit estimated this week that global oil prices averaging around $80 per barrel in 2026 — a figure that already looks conservative against today’s Brent print of $107 — would “raise inflation and lower growth across much of Asia.” For Tier 3 economies, where energy subsidies have already strained fiscal space and where household energy costs represent 15 to 25 percent of disposable income for working families, this is not a macroeconomic abstraction. It is a rapidly deteriorating quality-of-life crisis with direct implications for political stability. The Pacific Island states, which import virtually all their fuel and have virtually no fiscal capacity to cushion price shocks, represent the most acute humanitarian dimension of the Indo-Pacific’s energy triage — the least discussed, and potentially the most damaging.
The Diplomatic Tightrope: Energy, Alignment, and the New Indo-Pacific Order
Every energy crisis is also a diplomatic crisis, and this one is reshaping the Indo-Pacific’s political geometry in real time. The most consequential realignment involves India and Russia. Moscow’s Deputy Prime Minister Alexander Novak has stated publicly that Russia is “ready to increase supplies” to both India and China. Russian crude, which does not transit Hormuz — reaching Asian markets via Baltic, Black Sea, and Pacific routes — has emerged as the war’s single most important alternative supply source. India, which had already been purchasing Russian crude at a significant discount since 2022, will now accelerate that dependence sharply. China, which had been moderating its Russian crude intake as relations with the Gulf states deepened, will now abandon that restraint.
The geopolitical mathematics are uncomfortable for Washington. As the Foreign Policy Research Institute has noted, Russian state oil and gas revenues had fallen to a four-year low in January 2026, creating meaningful pressure on the Kremlin to negotiate in Ukraine. The Iran war has reversed that trajectory overnight. Higher oil revenues will directly strengthen Russia’s capacity to finance its war in Ukraine, directly undercutting one of Washington’s stated policy objectives. The crisis that the Trump administration triggered by striking Iran has, as a side effect, bailed out Vladimir Putin’s war chest.
For China, the crisis presents a more complex set of opportunities and constraints. Beijing’s immediate interest is in reopening Hormuz — not to help Washington, but because China’s LNG exposure means a prolonged closure hurts it too, despite its stockpile cushion. Yet over the medium term, as Foreign Policy argued this week, the crisis may actually consolidate China’s strategic position. Its domestic renewables buildout — already the most ambitious in the world — now looks less like climate policy and more like military-industrial foresight. Every additional gigawatt of solar and wind generation is a unit of strategic autonomy that Japan, South Korea, and India currently lack at scale. The crisis accelerates China’s relative energy independence even as it deepens the dependence of its regional rivals.
India’s position is the most diplomatically contorted. New Delhi’s traditional doctrine of strategic autonomy — buying Russian oil while deepening U.S. security ties, investing in Iranian infrastructure while accepting Western sanctions constraints — is under simultaneous pressure from every direction. The rupee’s slide, the LNG rationing, and the optics of Modi’s Israel visit have narrowed India’s maneuvering room precisely at the moment when it needs maximum flexibility. Chinese Foreign Minister Wang Yi’s call for BRICS solidarity this week — urging India to “step up to the plate” within the bloc — is a reminder that Beijing intends to use the crisis to deepen its gravitational pull on New Delhi’s policy calculus.
The Clean Energy Paradox: Acceleration and Rebound
Energy crises historically trigger two simultaneous and contradictory responses: an acceleration of clean energy transition, as nations confront their import dependency, and a short-term rebound toward energy security at any cost — including coal. Both dynamics are visible in Asia today, and both will shape the region’s energy architecture for the next decade.
The acceleration case is powerful. Japan’s long-stalled nuclear restart program — which had recovered from near-zero post-Fukushima to roughly 8 percent of the electricity mix by 2025 — is now receiving an unexpected political tailwind. Every reactor that comes back online reduces LNG demand and extends the operational buffer that stands between Japan’s industrial economy and rationing. South Korea’s government, which had been navigating a politically fraught coal phaseout strategy, is now confronting the reality that its accelerated LNG dependency — the direct consequence of closing coal plants before equivalent renewables capacity was online — has dramatically worsened its position in the hierarchy of vulnerability.
The rebound risk is equally real. Thailand, the Philippines, and Vietnam have been among Southeast Asia’s most ambitious renewable energy markets. Under acute fiscal pressure, with energy subsidies straining budgets and foreign exchange reserves being drawn down to purchase spot LNG, the temptation to extend coal plant lifetimes rather than retire them — accepting the carbon cost in exchange for energy security and price certainty — will be significant. The crisis is creating conditions in which “energy security” and “clean transition” feel like opposing vectors, when the reality is that domestic renewables are the only durable solution to Hormuz dependency. That insight may take hold. Or it may arrive too slowly to prevent a decade of coal lock-in across precisely the economies that most need to decarbonize.
“Every kilowatt-hour generated from domestic renewables is now a unit of strategic autonomy.”
— The structural insight reshaping Indo-Pacific energy policy, March 2026
The Path Forward: Three Structural Shifts That Will Harden
The immediate crisis — the drone strikes, the insurance paralysis, the stranded tankers — will eventually resolve. Either a ceasefire will allow underwriters to reassess war-risk coverage, or a sustained U.S. naval escort regime will restore a partial flow of commercial vessels, or Iran’s own export calculus will create sufficient diplomatic leverage to broker a limited reopening. History suggests that the strait’s de facto closure is unlikely to persist beyond four to six weeks before some combination of military deterrence and economic necessity forces a partial resolution.
What will not resolve is the structural exposure that this crisis has exposed. Three shifts are likely to harden into permanent features of Indo-Pacific energy and security architecture.
First, energy security will be permanently redefined across the region as a core national security imperative, not merely an economic or environmental policy domain. Every Asian government that has watched its equity market fall 6 to 16 percent in two weeks will emerge from this crisis with a different calculation about the cost of import dependency.
Second, LNG supply diversification will accelerate sharply, and the beneficiaries will be American, Australian, and Canadian producers. Long-term contracts with non-Hormuz LNG suppliers — already rising before the crisis — will now command a strategic premium. The IEA’s post-crisis assessment will almost certainly recommend a formal LNG strategic reserve mechanism for the first time, analogous to the crude oil reserves that have been inadequately but meaningfully mobilized in the current emergency.
Third, and most consequentially for the Indo-Pacific’s geopolitical order, the crisis will accelerate the energy-driven reshaping of the U.S.-China-Russia triangle. American LNG will flow to Japan, South Korea, and eventually India at volumes that were commercially marginal before the war. Russian crude will flow to China and India at volumes that are strategically inconvenient for Washington. China’s domestic clean energy buildout will continue at a pace that, within a decade, will make Beijing significantly less vulnerable to the kind of chokepoint coercion that has just traumatized its neighbors.
The hierarchy of energy vulnerability that this crisis has exposed is not permanent. But the divergent trajectories it has revealed — and accelerated — will define who holds structural power in the Indo-Pacific for the next generation.
In a region that has long preferred to treat energy as a commercial matter and security as a separate domain, the Iran war’s twelve days of closed waters have delivered a lesson that will not be forgotten: the two were never separate. They were simply waiting for a drone strike in a narrow Gulf waterway to make the connection undeniable.
Frequently Asked Questions
What is the “hierarchy of energy vulnerability” exposed by the Iran war in Asia?
The hierarchy framework ranks Asia-Pacific economies by their structural capacity to absorb the Hormuz supply shock. Tier 1 (Japan and South Korea) hold deep strategic crude reserves but face acute LNG vulnerability. Tier 2 (China and India) benefit from scale and diversification respectively, but both face LNG constraints and import dependency. Tier 3 (Southeast Asia and Pacific Island states) have minimal reserves, thin fiscal buffers, and are experiencing immediate rationing, shorter workweeks, and export restrictions. The key insight is that exposure is asymmetric even among countries at comparable levels of import dependency.
Why is LNG more critical than crude oil in the current Asia energy crisis 2026?
Unlike crude oil, LNG cannot be stockpiled at the same scale. Most Asian economies hold only weeks of LNG operational buffer — compared to months of strategic crude reserves. Japan’s two-to-four weeks of LNG cover and South Korea’s nine-day parliamentary estimate underscore how quickly a protracted closure translates into electricity and industrial rationing. The global LNG spot market was already tight before the war, making emergency procurement both expensive and logistically constrained.
How has China managed to remain relatively insulated from the Strait of Hormuz closure impact on the Indo-Pacific?
China’s relative resilience reflects three deliberate structural choices made over the past decade: aggressive stockpiling (an estimated 1.2–1.3 billion barrels in combined strategic and commercial reserves); supply diversification including deep reliance on Russian crude arriving via non-Hormuz routes; and a domestic clean energy buildout that reduces dependence on gas-fired power. Its principal vulnerability remains LNG, where Qatar supplies roughly 30 percent of its imports — which is why China moved diplomatically within 48 hours to pressure Tehran not to target LNG tankers or Qatari export infrastructure.
Will the Iran war accelerate the clean energy transition or trigger a coal rebound in Asia?
Both dynamics are underway simultaneously. The acceleration case is driven by Japan’s nuclear restart momentum and South Korea’s recognition that its coal phaseout worsened its crisis exposure. The rebound risk is driven by Southeast Asian economies — particularly Thailand, Vietnam, and the Philippines — that face acute fiscal pressure and may find coal plant life extensions more politically viable under emergency conditions. The structural argument for domestic renewables as strategic autonomy has never been stronger, but policy windows in a crisis are narrow.
What are the broader Indo-Pacific security implications of the energy supply shock from the Iran conflict?
The crisis is reshaping three geopolitical relationships simultaneously. Russia benefits directly: higher oil revenues reverse a budget squeeze that had been pressuring Moscow toward Ukraine negotiations. The U.S.-India relationship is complicated by New Delhi’s accelerated pivot to Russian energy. And China’s domestic clean energy leadership will compound over the next decade into a structural energy security advantage relative to Japan, South Korea, and Southeast Asia. The crisis has exposed Hormuz as Asia’s systemic single point of failure, and the geopolitical consequences will outlast any ceasefire.
Discover more from The Economy
Subscribe to get the latest posts sent to your email.


Key Figures at a Glance
- $299B — Maximum output loss projected for Asia-Pacific (UNDP)
- 8.8M — People at risk of poverty across Asia-Pacific
- $103/bbl — Brent crude average, March 2026
- +140% — Asian LNG spot price surge following Ras Laffan strike
- 84% — Share of Gulf crude bound for Asian markets
When the United States and Israel launched their opening airstrikes on Iran on the morning of February 28, 2026, the immediate headlines belonged to the military: assassinated officials, retaliatory ballistic missiles, the macabre theatre of drone swarms over Gulf capitals. Economists watched a different ticker. Within hours, Brent crude had surged more than ten percent. Within days, the Strait of Hormuz — that narrow, twenty-one-mile pinch point between Iran and Oman — had been declared closed by the Iranian Revolutionary Guard Corps. That single act of strategic disruption set off a financial shockwave that, two months on, continues to resonate most violently not in New York or London, but across the factories, farm fields, and households of Asia.
The financial impact of the US-Iran war on Asia is, in the precise language of economics, an asymmetric shock: a crisis whose costs are distributed with breathtaking inequity. The United States — now a net energy exporter thanks to its shale revolution — is cushioned from the worst. Its gasoline prices spiked, its consumers winced, but the macro numbers held. Asia, by contrast, sits at the exact intersection of the world’s most consequential energy corridor and its most energy-hungry growth engines. To understand why this war’s economic toll lands differently in Seoul than in Cincinnati, you must begin not with geopolitics but with geography — and with the inescapable arithmetic of who buys what from where.
The Choke Point That Choked an Entire Continent
The Strait of Hormuz is, to borrow a phrase from energy analysts, the world’s most consequential twenty-one miles of water. Before the war, approximately 20 percent of global seaborne oil and a fifth of global liquefied natural gas flowed through it daily. That figure, while striking, undersells Asia’s particular exposure. According to data compiled by the Congressional Research Service from pre-conflict 2024 shipping records, 84 percent of the crude oil and 83 percent of the LNG transiting the strait was destined for Asian markets. China, India, Japan, and South Korea alone accounted for roughly 70 percent of those oil shipments; the remaining 15 percent was scattered across Southeast and South Asia.
Iran’s closure of the strait on March 2 — the formal declaration by a senior IRGC official that “the strait is closed” — was not a bluff. Within hours, no tankers in the strait were broadcasting automatic identification signals. Britannica’s conflict chronology records that commercial traffic fell more than 90 percent after the opening of hostilities. War-risk insurance premiums for strait transits — which had crept from 0.125 percent to 0.4 percent of ship value in the days before the strikes — became essentially academic: the economic risk made transit uninsurable at any rational price.
The Energy Math, Laid Bare
Qatar’s Ras Laffan LNG complex — struck by Iranian drones on March 18 — suffered a 17 percent reduction in production capacity. Repair timelines: three to five years. Asian LNG spot prices surged more than 140 percent in response. QatarEnergy, the single largest LNG supplier to Asian markets, declared force majeure on its contracts with buyers.
Oil prices surged from roughly $70 per barrel just before the war to an average of $103 per barrel in March, with analysts at Capital Economics warning that a prolonged conflict could push Brent to $150 per barrel over a six-month horizon.
Fertilizers represent a less-discussed but equally dangerous channel: the Persian Gulf accounts for roughly 30–35 percent of global urea exports. With the strait closed, Asian agrarian economies face input cost shocks arriving precisely as spring planting cycles begin — a cruel, compound blow to food security.
The Chatham House analysis published in March put the structural vulnerability plainly: at the far end of energy import dependence sit South Korea, Taiwan, Japan, India, and China — all economies where energy imports represent a significant share of GDP. The United States sits “somewhere in the middle” — a net energy exporter whose domestic consumers pay more, but whose macro balance is net-positive when global oil prices rise. For Asia’s importers, the transmission is brutally direct: higher oil and gas prices raise the import bill for every household and firm, squeezing real incomes, widening current account deficits, and forcing central banks into an impossible bind between tightening to defend currencies and loosening to protect growth.
“This is not only a Middle East oil shock but also a wider Asian gas and power-security problem.” — Energy analyst cited in TIME, March 2026
Country by Country: A Continent Under Differential Pressure
China — Relatively Buffered, For Now
China entered the crisis with approximately 1.4 billion barrels of strategic crude reserves and pre-war stockpiling. Its belt-and-road railway links to Central Asia and overland Russian pipeline gas provided partial substitutes. Beijing’s formal neutrality also gave it negotiating leverage: Iran granted Chinese-flagged vessels selective strait access. But higher energy costs feed directly into steel, chemicals, and electronics production — squeezing margins at exactly the moment of peak trade friction with Washington. If the conflict persists beyond three months, Capital Economics estimates that Chinese growth could fall below 3 percent year-on-year.
India — Severely Exposed
India imports over 90 percent of its oil needs, with more than 40 percent of crude and 90 percent of LPG sourced from the Middle East. The UNDP’s socioeconomic analysis notes that 85 percent of India’s fertilizer imports originate in the region. The rupee weakened under import-bill pressure; inflation accelerated. New Delhi invoked emergency powers to redirect LPG from industry to households and secured a US Treasury 30-day waiver to purchase stranded Russian crude cargoes — a diplomatic improvisation that underscores just how thin the margins truly are. Higher energy prices are, as the World Economic Forum observed, “feeding inflation, weakening the rupee and threatening growth.”
Japan & South Korea — Emergency Measures Activated
South Korea imposed its first fuel price cap in nearly three decades and activated a 100 trillion won (approximately $68 billion) market-stabilisation programme. Korean Air entered “emergency mode,” focusing entirely on internal cost reduction. Japan began releasing strategic oil reserves. The exposure is structural: South Korea sources around 70 percent of its crude from the Middle East and routes more than 95 percent of that through Hormuz, leaving almost no slack. South Korea also makes much of the refined product — jet fuel, diesel — that sustains air travel and logistics across Southeast Asia and Oceania, meaning its own supply squeeze transmits regionally.
Southeast & South Asia — Recession-Level Risk
The region’s most acute vulnerabilities lie in its most reserve-thin, subsidy-dependent economies. Bangladesh faces recession-like conditions; universities were closed early ahead of Eid holidays to conserve fuel, and shopping centres were ordered to shut by 8 pm. Vietnam is weighing temporary cuts to fuel import tariffs. Thailand imposed a diesel price cap. The Philippines declared a state of emergency in late March. Pakistan, already under IMF-supervised austerity, faces a particularly compressed policy space. The UNDP is explicit: South Asia accounts for the largest share of the 8.8 million people at poverty risk in the region, reflecting “higher exposure to income and price shocks and more limited policy buffers.”
The Fertilizer-Food Nexus: An Invisible Crisis
One dimension of the Iran war’s economic impact on Asia that has received insufficient attention in financial media is the agricultural supply chain. Up to 30 percent of internationally traded fertilizers normally transit the Strait of Hormuz — primarily urea and ammonia from Gulf producers. With the strait closed and QatarEnergy having declared force majeure, fertilizer shortages have become a particular concern for agrarian economies, threatening Asian grain supplies just as spring planting cycles are underway. The knock-on to food prices — layered on top of already elevated energy costs — creates an inflationary compound that official models notoriously underestimate, because the agricultural price shock transmits with a lag of weeks to months into consumer food baskets.
Semiconductors, AI, and the Energy-Intensity Trap
The war has introduced a less-discussed vulnerability specific to this technological moment. Middle Eastern supply chain disruptions are tightening global helium supply — a critical input for semiconductor fabrication — potentially affecting chipmaking industries in Taiwan, South Korea, and Japan. Meanwhile, Asia’s rapidly expanding AI data-centre infrastructure is exceptionally energy-intensive. Higher electricity costs, driven by LNG price surges, directly increase the operational cost of the large-scale compute clusters that underpin the region’s technology ambitions. In an era when digital infrastructure is a strategic asset, energy price shocks are no longer merely an industrial problem — they are a competitiveness problem.
The Macroeconomic Damage: What the Numbers Say
The headline figures are stark. The United Nations Development Programme’s April 2026 report estimated that output losses for the Asia-Pacific region could range from $97 billion to $299 billion, equivalent to 0.3 to 0.8 percent of regional GDP. The range reflects two scenarios: rapid adaptation (drawing on reserves, securing alternative supplies, executing fast policy response) versus prolonged disruption that exhausts those buffers. As UNDP’s regional director for Asia and the Pacific, Kanni Wignaraja, put it with clinical precision: “You’re going to triple that if many of these countries run through these reserves and really have very little to fall back on.”
The Asian Development Bank revised its Asia-Pacific growth forecast down from 5.4 to 5.1 percent for both 2026 and 2027, with regional inflation projected to rise to 3.6 percent — a full 0.6 percentage points above 2025’s outturn. The ADB’s chief economist, Albert Park, called a prolonged conflict “the single biggest risk to the region’s outlook.” The IMF, in its April 2026 World Economic Outlook, quantified the transmission with precision: every sustained 10 percent increase in oil prices adds approximately 0.4 percentage points to global inflation and cuts worldwide output by up to 0.2 percent. Since oil prices rose roughly 47 percent from pre-conflict levels to the March average, the arithmetic is uncomfortably clear.
Beyond the aggregate GDP figures, the human dimension is where the shock truly registers. The UNDP estimates that 8.8 million people in the Asia-Pacific are at risk of falling into poverty as a direct consequence of the war’s economic fallout — part of a global total of 32 million at poverty risk. Losses are “most pronounced in South Asia,” the report notes, with women, migrant workers, and households in the informal economy carrying the sharpest edge of the crisis.
“A prolonged conflict in the Middle East is the single biggest risk to the region’s outlook, as it could lead to persistently high energy and food prices and tighter financial conditions.” — Albert Park, Chief Economist, Asian Development Bank, April 2026
Why Asia Bears a Disproportionate Burden
The asymmetry deserves direct examination, because it is not accidental — it is structural. The United States, transformed by the shale revolution into a modest net energy exporter, is in the peculiar position of being a country whose macro balance sheet benefits slightly from higher global oil prices, even as its consumers pay more at the pump. American gasoline prices surged — the national average hit $4 per gallon by March 31, a 30 percent surge — and that is real pain for American households. But it does not structurally impair America’s current account, its currency, or its capacity to service debt.
Asia’s arithmetic is inverted. The continent accounts for more than half of the world’s manufacturing output and is overwhelmingly dependent on imported hydrocarbons to run it. When oil prices rise, Asia’s terms of trade deteriorate. Import bills balloon in dollar terms while export revenues — primarily manufactured goods — do not rise commensurately. Currencies weaken. Inflation rises. Central banks face pressure to tighten even as growth falters. The spectre of stagflation is not rhetorical for Asia’s emerging economies. It is, in the worst scenario, the condition of 2026.
Compounding the structural disadvantage is the policy constraint. Advanced Asian economies like Japan and South Korea can deploy large fiscal stabilisation packages. But for Bangladesh, Pakistan, or Vietnam, fiscal space is thin, foreign reserves are finite, and subsidy commitments are already straining government budgets. As the World Economic Forum analysis observed, “in countries where energy subsidies remain extensive and government finances are already shaky, higher energy prices could unsettle bond markets.” A sovereign debt crisis in a major emerging Asian economy is not the base case — but it is no longer an extreme tail risk.
Two Scenarios: Short Shock Versus Prolonged Siege
Scenario A — Rapid Resolution (2–3 Months of Disruption)
If the current ceasefire holds and the Strait of Hormuz returns to near-normal traffic by mid-2026, Capital Economics forecasts Brent crude falling back toward $65 per barrel by year-end. Asian LNG prices would ease, though the Ras Laffan damage means the pre-war supply equilibrium in LNG is structurally impaired for years regardless. Growth downgrades in the region would be material but manageable — the 5.1 percent ADB forecast holds. Inflation peaks in Q2 before moderating. The 8.8 million poverty-risk figure represents a severe but temporary disruption, recoverable with targeted social protection and swift fiscal deployment.
Scenario B — Prolonged Conflict (6+ Months)
If the “dual blockade” — Iran restricting the strait, the US Navy blockading Iranian ports — persists through summer, the damage becomes qualitatively different. Capital Economics estimates Chinese growth could fall below 3 percent year-on-year. Brent crude could average $130–150 per barrel in Q2 alone. Sovereign spreads in vulnerable emerging markets blow out. The poverty count rises sharply as household energy and food subsidies are exhausted. The IMF’s severe scenario — oil prices 100 percent above the January 2026 WEO baseline, food commodity prices up 10 percent, corporate risk premiums rising 200 basis points in emerging markets — ceases to be a modelling exercise. At that point, the question is not whether Asia experiences stagflation, but how many economies tip into technical recession.
Even in the best case, IMF Managing Director Kristalina Georgieva has been explicit: “There will be no neat and clean return to the status quo ante.” The Ras Laffan damage alone has permanently reduced Qatar’s LNG production capacity for a multi-year window. Shipping companies are accelerating their rerouting calculus — longer, more expensive voyages around the Cape of Good Hope are already being priced into freight contracts. Chatham House’s economists warn that even a short war would leave Asian and European inflation roughly 0.5 percentage points above pre-conflict forecasts for the full year — a seemingly modest figure that, distributed across hundreds of millions of near-poor households, translates into meaningful welfare losses.
Long-Term Strategic Realignments: The Silver Linings Are Real, But Distant
Crises concentrate minds, and this one is already accelerating several structural adaptations that were moving too slowly in the years of cheap, reliable Gulf energy.
Renewable energy investment is surging. The war has done more in eight weeks to demonstrate the vulnerability of fossil-fuel dependence than a decade of climate negotiations. Asian governments are fast-tracking solar, wind, and storage capacity approvals. The long-run dividend — energy systems less exposed to a single maritime chokepoint — is real, though it accrues over years, not quarters.
Supply chain diversification is being institutionalised. The shock has forced a reckoning in corporate boardrooms from Tokyo to Mumbai. “Just-in-time” logistics, which assumes reliable, low-cost global supply chains, is being replaced by “just-in-case” thinking — higher inventory buffers, dual sourcing, and strategic reserves for critical inputs. This raises costs in the short term but reduces systemic fragility over time.
Alternative energy corridors are attracting investment. Oman’s deepwater ports at Duqm, Salalah, and Sohar — situated outside the strait in the Arabian Sea — have suddenly become critical strategic assets. The existing railway links from China through Central Asia to Iran underscore the geopolitical logic of overland connectivity as maritime insurance.
India’s strategic autonomy is under stress-test. New Delhi’s refusal to align categorically with either Washington or Tehran has been both asset and liability. The US Treasury emergency waiver allowing Indian access to Russian crude was an American concession that acknowledges India’s structural dependence. But analysts note that India’s closer relationship with Israel prior to the conflict has complicated its engagement with Tehran. Managing these tensions while securing energy supply is the defining foreign policy challenge for Indian diplomacy in 2026.
China’s mediation leverage has grown. Beijing’s decisive nudge reportedly played a role in Iran’s acceptance of the April 7 ceasefire. China’s formal neutrality, its deep economic entanglement with both Iran and the Gulf Arab states, and its status as the largest single destination for Gulf oil give it unique mediating currency. The war has, paradoxically, expanded China’s soft power in the region at a moment when American credibility among its Gulf allies is being intensely scrutinised.
The Policy Imperative: What Asia Must Do Now
For policymakers in Asian capitals, the crisis demands a response on three timeframes simultaneously.
In the immediate term, the priority is cushioning the household impact: targeted fuel price subsidies, food assistance, and social protection for the most vulnerable — the informal workers, migrant labourers, and near-poor households the UNDP identifies as carrying the greatest risk. Several governments have moved quickly; South Korea, Japan, Thailand, Vietnam, and Indonesia have all deployed market interventions. But the fiscal runway for sustained subsidisation is finite, and the political economy of subsidy withdrawal, when it eventually comes, is treacherous.
In the medium term, the crisis accelerates the urgency of energy security architecture — strategic reserve capacity, diversity of supply, and accelerated renewable deployment. The ADB and multilateral development banks have a clear role: concessional financing for energy security infrastructure in the most exposed economies should be treated as a geopolitical priority, not merely a development finance question.
In the long term, Asia needs a more sophisticated diplomatic framework for managing the risks that arise when its largest trading partner and its primary energy supplier are in conflict — and when the United States, which provides the security architecture for global maritime commerce, is simultaneously a belligerent party in a war disrupting that commerce. This is not an abstract geopolitical puzzle. It is the central structural tension of Asian economic security in the second quarter of the 21st century.
A Measured Verdict: The Bill Is Real, The Reckoning Is Unfinished
The US-Iran war is, at its core, a military and political conflict. But its most durable legacy — for Asia, at least — may be economic. A generation of Asian policymakers built growth models premised on cheap, reliable energy from the Gulf, frictionless maritime supply chains, and an American security umbrella that ensured both. All three premises are now in question simultaneously.
The immediate financial impact of the US-Iran war on Asia is quantifiable, if deeply uncertain in range: somewhere between $97 billion and $299 billion in output losses, 8.8 million people pushed toward poverty, growth forecasts revised downward across the region, and a continent navigating the worst energy shock since the 1970s with uneven policy buffers and inadequate strategic reserves. The human cost — measured in foregone school years, reduced caloric intake, deferred medical care — is harder to quantify but no less real.
What the numbers cannot fully capture is the subtler, more lasting damage: the erosion of confidence in the stability of the global trading system, the repricing of geopolitical risk across Asian supply chains, and the quiet acceleration of the region’s long, unfinished transition toward energy self-sufficiency. The war in Iran is, among many other things, a forcing function — brutal in its immediacy, but potentially clarifying in its long-run consequences for how Asia’s economies are structured, where its energy comes from, and how deeply it can afford to trust an international order whose most powerful guarantor is also, for now, the war’s primary author.
The markets will eventually stabilise. The strait will eventually reopen. But Asia’s relationship with the Hormuz chokepoint — and with the geopolitical vulnerabilities it represents — will not return to what it was on February 27, 2026. That may yet prove to be the conflict’s most consequential economic legacy.
Discover more from The Economy
Subscribe to get the latest posts sent to your email.

As primary dealers’ net Treasury inventories surge to their highest share of the market since 2007 — touching roughly $550 billion, or nearly 2% of the $31 trillion outstanding — the Trump administration’s deregulatory pivot is quietly reshaping who underwrites America’s debt. The shift promises better liquidity and deeper market-making capacity. It also reintroduces concentration risks that should not be papered over with optimism.
In the lexicon of financial markets, there are few numbers with as much quiet authority as the weekly primary dealer position data published by the Federal Reserve Bank of New York. Every Thursday afternoon, at approximately 4:15 p.m., the New York Fed releases figures that reveal how much of the world’s most important fixed-income market the largest banks are actively holding on their books. For much of the post-2008 era, those numbers told a story of retreat — of banks pulling back from Treasury market-making as a thicket of capital rules made the balance-sheet cost of holding government debt increasingly punitive relative to the returns on offer.
That story appears to be changing. According to Financial Times calculations based on New York Fed data, primary dealers’ net Treasury inventories have climbed to approximately $550 billion — their highest level, as a proportion of total Treasuries outstanding, since 2007. That figure, representing nearly 2% of a market that has ballooned to roughly $31 trillion, is not merely a statistical curiosity. It is a structural signal: Wall Street banks are returning to their traditional role as the central nervous system of American government finance, propelled in large part by the most consequential regulatory reform to hit the banking sector since the Dodd-Frank era.
A Market That Outgrew Its Intermediaries
To understand why this moment matters, it is necessary to appreciate just how dramatically the Treasury market’s growth has outpaced the capacity of its traditional intermediaries. As the Bank Policy Institute has documented, since 2007 the stock of outstanding Treasury securities has grown nearly fourfold relative to primary dealer balance sheets. The U.S. government now borrows far more than the financial system was designed — post-crisis — to efficiently intermediate.
The arithmetic of this mismatch is stark. From $2.1 trillion outstanding in 1990, the Treasury market expanded to $5.8 trillion in 2008 and approximately $21 trillion by 2020. Today it approaches $31 trillion. Meanwhile, dealer intermediation capacity — measured not by raw holdings but by their ability to warehouse risk relative to market size — stagnated, constrained by post-crisis rules that treated U.S. government debt with much the same regulatory suspicion as any other leverage-intensive exposure.
This seemingly contradictory situation — where dealers’ market-making capacity decreased while banks’ Treasury holdings increased — can be explained by the dual impact of post-crisis regulations. While capital requirements constrained dealers’ ability to actively intermediate in the Treasury market, liquidity regulations simultaneously incentivized banks to hold more high-quality liquid assets, including Treasuries. As a result, although large banks held more Treasuries, their capacity to provide liquidity and depth to the market did not keep pace with the growth in outstanding Treasury securities. Bank Policy Institute
The consequence was a market that appeared deep — daily turnover reaches some $750 billion according to SIFMA — but proved intermittently fragile, as the March 2020 “dash for cash” catastrophically illustrated. That episode, in which the supposedly most liquid market in the world briefly seized up, forcing the Federal Reserve into an emergency $1.6 trillion intervention, was the clearest possible demonstration that the structural plumbing of the Treasury market had become inadequate.
The eSLR Pivot: Deregulation With a Purpose
The proximate cause of the current inventory surge is identifiable: the enhanced Supplementary Leverage Ratio reform, finalized by the Federal Reserve, the OCC, and the FDIC in late November 2025. The final rule includes an effective date of April 1, 2026, with the optional early adoption of the final rule’s modified eSLR standards beginning January 1, 2026. Federal Register
The eSLR, established in 2014, was conceived as an additional capital buffer for America’s globally systemically important banks — the eight institutions whose failure would, in the regulators’ estimation, send shockwaves through the entire financial system. The logic was sound in the immediate post-GFC environment. But the rule’s blunt architecture — it treated all assets equally, regardless of their riskiness — produced a perverse disincentive. A leverage ratio constraint that is more stringent than any applicable risk-based standards may discourage a bank from engaging in low-risk activities, such as Treasury market intermediation. OCC
The reform recalibrates this. The current fixed two percent eSLR buffer standard for GSIBs is recalibrated to equal 50 percent of a GSIB’s Method 1 surcharge calculated under the GSIB surcharge framework. In plain terms: the largest U.S. banks — JPMorgan Chase, Goldman Sachs, Bank of America, Morgan Stanley, and their peers — now face meaningfully lower capital requirements for engaging in Treasury market-making. FDIC staff estimated that the final rule would lead to an aggregate reduction in Tier 1 capital requirements of $13 billion, or less than 2%, for GSIBs, and a $219 billion reduction, or 28%, in Tier 1 capital requirements for major bank subsidiaries. KPMGABA Banking Journal
That $219 billion reduction at the bank subsidiary level is the operational number that matters most for Treasury market-making. It directly expands the balance sheet capacity available to the dealer desks that sit inside those subsidiaries. A key benefit of the final rule is that it would remove unintended disincentives for banking organizations to engage in low-risk activities, such as U.S. Treasury market intermediation, and reduce unintended incentives, like engaging in higher-risk activities. Davis Wright Tremaine
The Trump administration — and, to their credit, regulators appointed with explicit mandates to revisit post-crisis rules — deserve recognition for acting on what had become, in regulatory circles, an open secret: the eSLR was quietly undermining the functioning of the world’s most systemically critical fixed-income market. The agencies state the changes are intended to serve as a backstop to risk-based capital requirements and to encourage these organizations to engage in low-risk, balance-sheet intensive activities, including during periods of economic or financial market stress. KPMG
What $550 Billion in Net Inventories Actually Means
The approximately $550 billion in net primary dealer Treasury holdings — up from well below $400 billion in much of 2025 — represents genuine re-privatization of a function that had been, by default, increasingly outsourced either to the Federal Reserve (through QE) or to non-bank intermediaries whose capacity to absorb shocks is structurally different from that of regulated banks.
Net inventory, as opposed to gross positions, strips out hedged or offsetting positions and measures the actual directional risk that dealers are absorbing from the market. A higher net inventory means dealers are more willing to be price-makers rather than merely conduits — they are warehousing duration and credit risk on behalf of clients, an activity that requires balance sheet and, critically, regulatory appetite.
Since the beginning of the Federal Reserve’s balance sheet normalization in June 2022, dealers’ intermediation activities in the Treasury and MBS markets have increased. Dealers’ SLR constraints have become less binding as Tier 1 capital generally grew more quickly than total leverage exposure. The eSLR reform accelerates and institutionalizes this trend. Federal Reserve
This matters enormously given what lies ahead on the issuance calendar. The United States faces a staggering wall of debt refinancing over the next several years — trillions in Treasuries maturing and requiring rollover, on top of ongoing deficit financing that shows no credible signs of abating. A Treasury market in which primary dealers have greater balance sheet capacity to absorb new supply is unambiguously better equipped to handle this reality without repeated bouts of yield dislocation.
The Shadow in the Room: Hedge Fund Leverage and Basis Trade Risk
Improved dealer capacity is genuinely good news. It is not, however, a complete story — and intellectually honest analysis requires acknowledging what surrounds this structural improvement.
The decade since post-GFC regulation constrained bank balance sheets has not been a period of reduced risk in the Treasury market; it has been a period of risk migration. The activity that dealers could not profitably conduct moved, as it tends to do in finance, to entities subject to less regulatory friction. In the Treasury market, that migration produced the spectacular — and partly terrifying — growth of the hedge fund basis trade.
As of 2025, Treasury basis trades are estimated to account for $1 to $2 trillion in gross notional exposure, with a significant concentration among large hedge funds. The mechanics are straightforward: hedge funds buy Treasury bonds in the cash market while simultaneously shorting the corresponding futures contract, financing the long position through the repo market and extracting the spread between cash and futures prices — typically a few basis points — amplified through leverage. Data suggests that hedge fund leverage in this market can range from 50-to-1 up to 100-to-1. WikipediaBetter Markets
According to the Fed’s most recent Financial Stability Report, average gross hedge fund leverage has reached historically high levels since the data first became available in 2013 and is highly concentrated. The top 10 hedge funds account for 40 percent of total repo borrowing and have leverage ratios of 18 to 1 as of the third quarter of 2024. Hedge funds now represent approximately 8% of all assets in the U.S. financial sector, but their footprint in the Treasury market — through cash positions, futures, and repo — is disproportionately large. Federal Reserve Bank of Cleveland
The interaction between a more capacitated dealer sector and a heavily leveraged hedge fund sector is not purely benign. Dealers are the prime brokers who finance most of the repo lending that sustains the basis trade. A dealer sector newly emboldened by eSLR reform may, paradoxically, become more willing to extend leverage to basis traders — adding a layer of procyclical amplification to the very market they are meant to stabilize. A rapid unwinding of leveraged positions could create a feedback loop: selling pressure drives price dislocations, which in turn triggers further deleveraging. Hedgeco
The March 2020 episode remains instructive. When volatility spiked and repo conditions tightened, hedge funds were forced to unwind basis positions simultaneously, transforming a liquidity-enhancing strategy into a liquidity-consuming crisis. The Fed’s emergency intervention prevented a complete seizure — but it also reinforced the moral hazard implicit in the market’s current architecture: the Treasury market is too important to fail, and everyone in it knows it.
A Geopolitical Dimension: Who Underwrites the Safe Asset
This debate does not occur in isolation from global capital flows and the geopolitics of the dollar’s reserve currency status. For decades, the implicit assumption was that demand for U.S. Treasuries — from foreign central banks, sovereign wealth funds, and global investors seeking the ultimate safe asset — would reliably absorb U.S. issuance at reasonable yields. That assumption is under pressure.
Foreign holdings of U.S. Treasuries, while still substantial in absolute terms, have been declining as a share of the market. The share held by the Federal Reserve has also contracted sharply as quantitative tightening proceeded. The result is a market increasingly reliant on domestic private investors — which is to say, increasingly reliant on precisely the primary dealers and non-bank intermediaries whose capacity the eSLR reform is designed to expand.
In this context, the re-privatization of Treasury market-making represented by the $550 billion in dealer inventories is not merely a domestic banking story. It reflects a structural rebalancing of who underwrites American sovereign debt — away from foreign central banks and the Federal Reserve, toward Wall Street firms operating under incentive structures that are ultimately profit-driven rather than policy-driven.
This matters particularly for the longer-dated end of the yield curve. Primary dealers, unlike the Federal Reserve or long-term foreign investors, are not natural buy-and-hold owners of thirty-year bonds. They are intermediaries who manage duration risk actively. A market more dependent on dealer intermediation is a market more sensitive to the balance sheet cost of holding duration — which means it is a market more sensitive to the regulatory environment that determines that cost. The current eSLR may limit banks’ ability to buy U.S. Treasuries at moments of market distress, particularly as the amount of U.S. debt continues to balloon. Brookings
Benefits Are Real, But They Are Not Risk-Free
It would be intellectually unfair to portray the eSLR reform as a deregulatory gift to Wall Street dressed in public-interest clothing. The case for reform is, in important respects, genuinely compelling — and has been made not merely by bank lobbyists but by serious scholars of financial market structure, including former Federal Reserve regulators.
As the Brookings Institution’s Daniel Tarullo argued — notably, a former Fed governor not known for regulatory permissiveness — the eSLR as designed created real disincentives for the largest banks to perform their intended function in the Treasury market, particularly during stress episodes when their capacity was most needed. The reform addresses a genuine structural flaw, not merely a banker’s wish.
The Federal Reserve’s own analysis confirmed that dealer intermediation capacity was projected to be tested by the ongoing increase in Treasury supply. Every additional billion dollars of dealer balance sheet capacity directed toward Treasury market-making is, in a meaningful sense, a contribution to the smooth functioning of the mechanism through which the U.S. government finances itself — and, by extension, through which the global dollar system maintains its coherence.
The risks are real, however. Concentration risk — the clustering of market-making capacity in a small number of very large institutions — does not disappear simply because those institutions now face lower capital charges. The interaction with the basis trade’s leverage ecosystem remains a source of systemic fragility. And the eSLR reform is, as regulators themselves have acknowledged, a first step in a broader sequence of capital recalibrations that could, if not carefully managed, erode the genuine resilience that post-GFC regulation achieved.
What Comes Next: The Test Will Be in the Stress
The surge in primary dealers’ net Treasury inventories to their highest share of the market since 2007 is, on balance, a structurally constructive development for the world’s most important fixed-income market. It represents a meaningful correction to a regulatory framework that had become misaligned with the realities of a $31 trillion Treasury market, and it comes at precisely the moment when the U.S. government’s borrowing needs are most acute.
But the lesson of the past two decades in financial markets is that structural improvements can also create conditions for structural complacency. The real test of this re-privatization will not come in the benign equilibrium of 2026, when balance sheets are expanding and regulatory headroom is fresh. It will come in the next episode of acute market stress — the next March 2020, the next moment when the basis trade unwinds and repo markets freeze and duration holders seek the exits simultaneously.
In those moments, the question will not be whether Wall Street banks increased their Treasury holdings when times were good. It will be whether they maintained their intermediation function when maintaining it was expensive, risky, and deeply uncomfortable. The eSLR reform gives them the capacity to do so. Whether they will choose to is a question that capital regulation, incentive design, and ultimately financial culture will answer together — and not in advance.
Discover more from The Economy
Subscribe to get the latest posts sent to your email.
Analysis
When the World Burns: Will the IMF Blink on Pakistan’s Fuel Subsidies Amid the Strait of Hormuz Crisis?
The war in the Middle East has rewritten the rules of global energy markets. For Pakistan, the question is whether Washington’s premier lender will rewrite the rules of fiscal discipline—and whether doing so would actually help.
The morning commute in Karachi tells you everything macroeconomic models cannot. On Shahrah-e-Faisal, rickshaw drivers pause to do the math in their heads—fuel costs up, fares contested, margins evaporating. At the city’s truck terminals, hauliers who move food from Sindh’s agricultural belt to urban markets are quietly adding surcharges that will ripple through every vegetable market from Lyari to Gulshan. The war in the Middle East, detonated by the February 28, 2026 joint US-Israeli air campaign against Iran and Iran’s subsequent closure of the Strait of Hormuz, has not remained a distant geopolitical abstraction. It has arrived at the petrol pump, in the grocery bill, and now—most consequentially—inside the negotiating rooms where Pakistan and the International Monetary Fund are working through the terms of the country’s $7 billion Extended Fund Facility.
The question gaining urgency among Islamabad’s policymakers, economists, and the public alike is a deceptively simple one: given an energy shock of unprecedented historical scale, will the IMF relax its strict conditions on fuel subsidies for Pakistan? The honest answer, grounded in both economics and political reality, is: modestly, carefully, and only at the margins. And that is almost certainly the right call—even if it makes for uncomfortable politics in a country where energy prices are already a flashpoint.
An Energy Shock With No Historical Precedent
To understand why Islamabad is under such enormous pressure, one must first grasp the scale of what has happened to global oil markets since late February. The closure of the Strait of Hormuz—through which roughly 27% of the world’s seaborne oil trade and 20% of global LNG volumes transited before the conflict—represents, in the words of the International Energy Agency’s Executive Director, “the greatest threat to global energy security in history.” This is not rhetorical escalation. It is arithmetic.
Crude and oil product flows through the Strait plunged from around 20 million barrels per day before the war to just over 2 million by mid-March. Gulf countries, with storage filling rapidly and exports stranded, have cut total output by more than 14 million barrels per day. Brent crude, which traded at $71.32 per barrel on February 27, 2026, surged more than 55%, briefly touching nearly $120 a barrel at its peak—a pace of appreciation that March 2026 will record as one of the largest single-month oil price jumps in market history. As of late April, with the Strait’s status oscillating between partial reopening and fresh episodes of Iranian interdiction, Brent remains anchored in the $80–$92 range with no durable resolution in sight, and commodity analysts warn that sustained supply chain bottlenecks could keep markets tight regardless of any ceasefire.
For energy-importing developing nations, the IMF itself frames this precisely. In a landmark March 30 blog signed by eight of the Fund’s regional directors—including Western Hemisphere Director Rodrigo Valdés—the authors warn that “all roads lead to higher prices and slower growth,” with energy-importing economies in Asia and Africa facing the effect of a “large, sudden tax on income.” Pakistan, almost entirely dependent on imported crude and LNG, sits squarely in the crosshairs.
Pakistan’s Fiscal Tightrope: The Numbers Behind the Negotiations
Against this backdrop, Pakistan’s position is structurally precarious. The country carries a fiscal deficit projected at approximately 3.2% of GDP for FY26 and FY27, with government revenues expected to remain roughly stable at 15.8% of GDP—a ratio that leaves vanishingly little room for unbudgeted expenditure shocks. Public debt remains elevated. Foreign exchange reserves, though recovering relative to the 2022–23 crisis lows, are still fragile enough that the IMF has explicitly stated that exchange rate flexibility should remain the primary shock absorber against Middle East spillovers—a polite way of saying Islamabad cannot afford to defend the rupee while simultaneously subsidizing petrol.
The political impulse to do exactly that has nonetheless proven irresistible. Prime Minister Shehbaz Sharif’s government has, over recent months, reintroduced fuel subsidies—cutting petrol prices by Rs80 per litre at one point—and held the Petroleum Development Levy (PDL) on diesel at effectively zero, against a budgeted target of Rs80 per litre. Fuel subsidies had risen to Rs125 billion by April 3, 2026, with the government committing to a Rs152 billion cap and scrambling to find fiscal offsets through cuts to the development budget and Rs27 billion in savings from reduced government fuel allowances.
The IMF, for its part, is not unmoved by the humanitarian dimension—but it remains unyielding on the fiscal logic. Mission Chief Iva Petrova stated explicitly at the conclusion of the March third-review discussions that “energy price subsidies should be avoided due to their high fiscal cost and distortionary effects,” and that “sustainability is maintained through timely tariff adjustments that ensure cost recovery.” The staff-level agreement for the third review, reached on March 27 and scheduled for Executive Board approval on May 8 to unlock approximately $1.2 billion in disbursements, was reached against a backdrop of ongoing negotiations over fuel pricing parameters that are expected to shape the upcoming federal budget.
The IMF’s April 2026 Fiscal Monitor, meanwhile, advised Pakistan to gradually phase out fuel subsidies, address contingent liabilities, and expand its tax base to ensure medium-term fiscal sustainability. The Fund warned that sustained fiscal consolidation would require structural reforms, including broadening the tax base and reducing reliance on subsidies, and that Pakistan’s primary surplus—estimated at 2.5% of GDP for FY26—is projected to decline to just 0.1% by FY31 without further reform action. These numbers tell a story of structural fragility that no amount of war-emergency rhetoric can paper over.
The Case Against Broad Subsidies: Why the IMF Is Right to Hold Firm
Fuel subsidies are, from an economist’s perspective, almost perfectly designed instruments for achieving the wrong outcomes. They are regressive—higher-income households, who own more vehicles and consume more fuel per capita, capture a disproportionate share of the benefit. They distort price signals, discouraging conservation and investment in alternatives precisely when the supply shock argues for both. They are fiscally corrosive: Pakistan’s government revenues running at 15.8% of GDP cannot sustainably absorb an open-ended commitment to international oil prices while simultaneously funding the security, education, and health expenditures a 240 million-person nation requires.
There is, moreover, a cautionary precedent from a strikingly similar juncture. When Russia’s 2022 invasion of Ukraine triggered global commodity price surges, a number of emerging markets—from Egypt to Sri Lanka to Pakistan itself—responded with broad-based fuel subsidies. In every case, the fiscal cost proved larger than anticipated, the inflationary feedback loop proved faster than modelled, and the political economy of subsidy removal proved dramatically more costly after a period of entrenchment than it would have been with targeted relief from the outset. Sri Lanka’s fiscal collapse, in particular, demonstrated how subsidy-driven balance-of-payments deterioration can accelerate from a manageable deficit challenge to a full-scale reserve crisis with frightening speed. Pakistan, in 2022, required emergency IMF intervention partly because of this dynamic. Repeating the experiment with a weaker fiscal position and a larger external shock would be economically reckless.
The IMF Fiscal Monitor’s warning that “revenue growth has likely peaked” carries particular weight in this context. If Pakistan’s tax-to-GDP ratio, already among the lowest in South Asia at roughly 10-11%, cannot be meaningfully raised in coming years, then subsidy expenditures crowd out the very social investments—health, education, early childhood development—that translate economic growth into human development. The war emergency does not suspend this structural logic; it intensifies it.
What the IMF Should Do—and What Islamabad Should Ask For
The argument that broad fuel subsidies are counterproductive does not imply that the IMF should ignore the human reality on Karachi’s streets. There is a meaningful distinction, however, between comprehensive price suppression—which primarily benefits the non-poor—and targeted, temporary relief for vulnerable households. And here, encouragingly, both the IMF and Pakistan’s government have identified the right mechanism, even if the sequencing and scale remain contested.
The Benazir Income Support Programme (BISP) is among the better-designed cash transfer systems in South Asia. As part of the new programme conditions, the IMF has already asked Pakistan to increase BISP quarterly payments by 35%—raising stipends from Rs14,500 to Rs19,500 starting January 2027—a meaningful improvement, though one that may not fully offset middle-income household burden. Islamabad should push, firmly and with economic evidence, for a faster and more generous BISP uplift. This is the correct instrument for a war-emergency response: fiscally bounded, targeted to those who actually need relief, and capable of being wound down as the oil shock dissipates without creating the entrenched price distortions that fuel subsidies inevitably generate.
The IMF, for its part, should show flexibility in how fiscal targets are achieved during an external shock of this magnitude, even while holding firm on whether they are achieved. There is genuine economic justification for allowing some degree of automatic stabiliser functioning—accepting a temporary deficit overshoot if revenues fall short due to slower growth, rather than demanding pro-cyclical fiscal tightening in the middle of an energy crisis. The Fund’s own Fiscal Monitor acknowledges that the Middle East conflict “could lead to higher energy prices, tighter financial conditions and increased inflationary pressures” that strain government finances. Acknowledging this in the programme design—with explicit clauses for temporary deviation if oil prices remain above a defined threshold—would be a sophisticated policy response. It would also be consistent with IMF practice during the COVID emergency waivers of 2020–2021.
Concrete policy recommendations for Islamabad:
- Accelerate BISP expansion now, rather than after January 2027; propose a dedicated emergency supplementary tranche for the war-shock period, financed by the fiscal savings already generated from development budget rationalisation.
- Maintain petroleum levy on petrol at the Rs100/litre level and work with provinces to restore the diesel levy to the Rs55/litre target on a time-bound schedule, insulating revenue flows from the war’s uncertainty.
- Negotiate an oil price contingency clause within the EFF framework: if Brent remains above $95 per barrel for more than 60 consecutive days, a pre-agreed, temporary widening of the deficit target—funded by provincial surplus sharing rather than central bank financing—takes effect automatically.
- Fast-track tariff rationalisation in the power sector to reduce circular debt accumulation; the energy sector’s fiscal drag is structurally more damaging than the current fuel subsidy debate.
- Resist the political pressure to freeze petrol prices indefinitely. Each month of price freeze embeds a larger future adjustment, and experience shows that deferred adjustment is always more painful—economically and politically—than managed, incremental change.
The Geopolitical Dimension: Leverage, Moral Hazard, and the Long Game
There is an argument, sometimes advanced in Islamabad’s policy circles, that Pakistan’s geopolitical weight—its nuclear status, its strategic location, its diplomatic role in US-Iran mediation talks (with US Vice President JD Vance and Steve Witkoff reportedly transiting Islamabad for negotiation rounds)—gives it leverage to extract more lenient IMF terms. This argument deserves neither complete dismissal nor uncritical acceptance.
It is true that the Fund operates in a political economy, and that strategically significant states have historically received more patient treatment than smaller, less geopolitically consequential debtors. It is equally true, however, that moral hazard is a serious constraint on IMF flexibility. If Pakistan secures significant subsidy-related waivers on the basis of war-emergency argumentation, it establishes a precedent—for itself in future programme negotiations, and for other emerging markets observing the dynamic—that external shocks are sufficient to suspend fiscal conditionality. The long-run cost of that precedent almost certainly exceeds the short-run benefit of a relaxed petroleum levy target.
The IMF’s own research—including the March 30 blog by Rodrigo Valdés and colleagues—is explicit that the war shock is asymmetric: it hurts energy importers more than exporters, and poorer countries more than richer ones. But the Fund’s recommended response to this asymmetry is not price suppression—it is enhanced social protection, exchange rate flexibility, and where available, additional concessional financing. Pakistan has access to the Resilience and Sustainability Facility, which is precisely designed for climate and external shock resilience. Islamabad should explore whether the RSF’s parameters can be stretched to address a conflict-driven energy emergency, a creative use of existing instruments that might yield more than a pitched battle over petroleum levy targets.
The Forward Path: Resilience Requires Reform, Not Relief
The immediate crisis will pass—eventually. Commodity analysts already note that any durable reopening of the Strait of Hormuz would likely trigger an immediate $10–$20 per barrel drop in crude prices, with Brent likely settling in the $80–$90 range even with lingering supply chain disruption. Pakistan’s current account pressures should ease materially when that happens. The question that will define Pakistan’s medium-term economic trajectory, however, is what structural architecture remains in place when the storm breaks.
The IMF’s next-programme thinking—already forming as the current EFF winds down—targets a 2% primary surplus, broader taxation of agriculture, exporters, IT, real estate and retail, and the definitive phase-out of fuel subsidies. These are not punitive demands. They are the minimum structural conditions for a country with Pakistan’s demographic profile and development aspirations to maintain any semblance of fiscal sovereignty. A government that can shelter its poorest citizens through well-targeted transfers, collect taxes from all productive sectors of its economy, and price energy at cost-reflective levels is a government that does not need to go cap-in-hand to Washington every two years. That is, ultimately, what genuine economic independence looks like.
The war in the Middle East is a tragedy measured in lives, livelihoods, and the slow-motion unravelling of a regional order that—whatever its imperfections—sustained the energy infrastructure on which billions of people depend. For Pakistan, it is also a test: of the political maturity to distinguish between legitimate emergency relief and structural dependence; of the administrative capacity to deliver targeted cash transfers faster than political pressure demands across-the-board price freezes; and of the diplomatic skill to negotiate flexibility within a programme framework without triggering a breakdown that would cost far more than the subsidy revenue being contested.
The rickshaw driver on Shahrah-e-Faisal deserves protection from an energy price shock he had no hand in causing. He deserves it through a direct transfer to his pocket—not through a subsidy that flows, at perhaps five times the fiscal cost, to the executive at Clifton who fills up his Fortuner. Getting that distinction right, under pressure, in the middle of a war, is the task before Pakistan’s policymakers and their IMF interlocutors alike. It will not be easy. But it is the only path that ends somewhere better than another crisis.
Discover more from The Economy
Subscribe to get the latest posts sent to your email.
-

 Markets & Finance4 months ago
Top 15 Stocks for Investment in 2026 in PSX: Your Complete Guide to Pakistan’s Best Investment Opportunities
-

 Analysis3 months ago
Brazil’s Rare Earth Race: US, EU, and China Compete for Critical Minerals as Tensions Rise
-

 Analysis2 months ago
Top 10 Stocks for Investment in PSX for Quick Returns in 2026
-

 Investment4 months ago
Top 10 Mutual Fund Managers in Pakistan for Investment in 2026: A Comprehensive Guide for Optimal Returns
-

 Banks3 months ago
Best Investments in Pakistan 2026: Top 10 Low-Price Shares and Long-Term Picks for the PSX
-

 Global Economy4 months ago
Pakistan’s Export Goldmine: 10 Game-Changing Markets Where Pakistani Businesses Are Winning Big in 2025
-

 Global Economy4 months ago
15 Most Lucrative Sectors for Investment in Pakistan: A 2025 Data-Driven Analysis
-

 Asia4 months ago
China’s 50% Domestic Equipment Rule: The Semiconductor Mandate Reshaping Global Tech