
Analysis
Iran Activates Its ‘Resistance Economy’ to Survive the War: How Tehran Is Rewriting the Rules of Economic Warfare in 2026
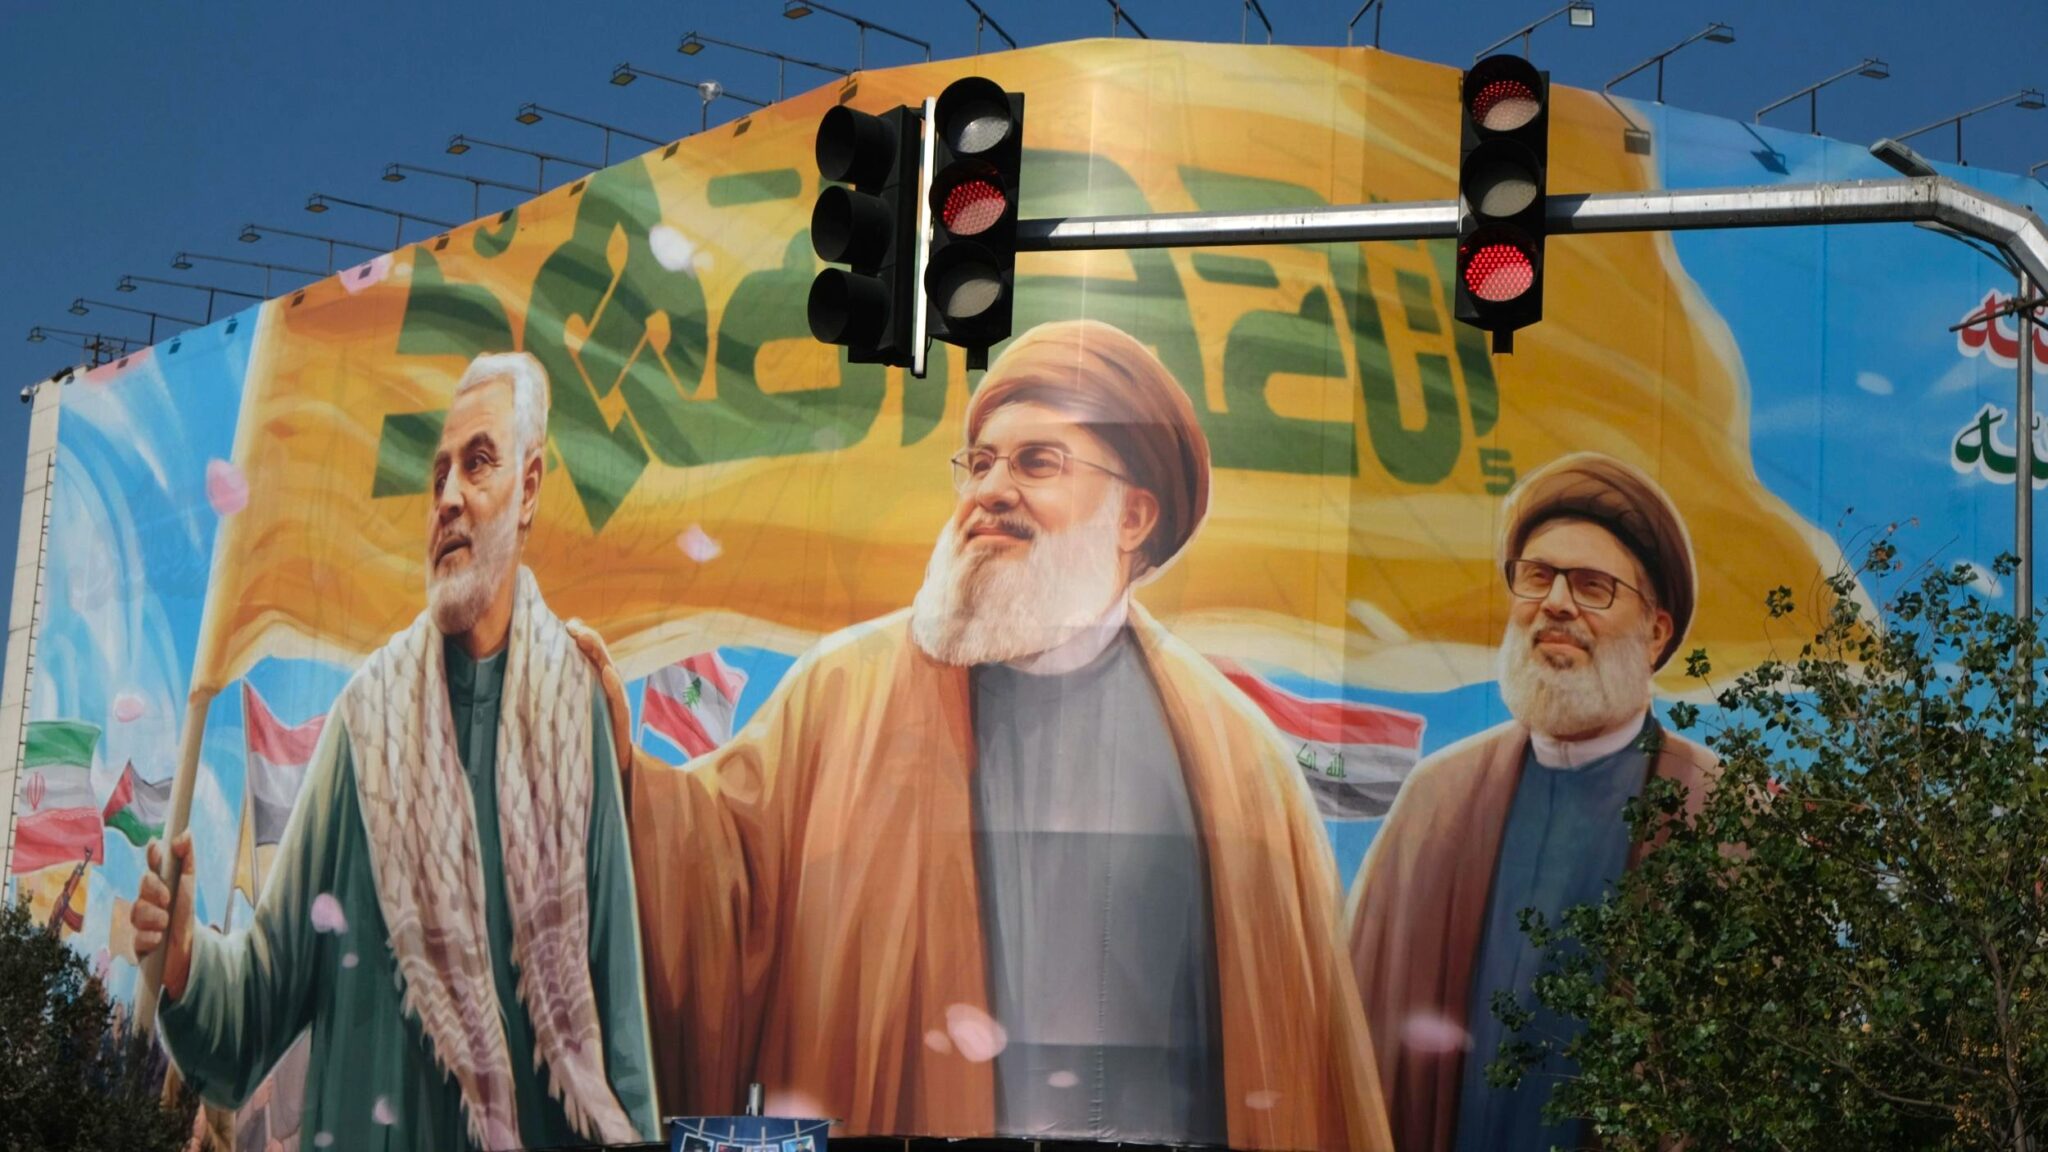
On the morning of Nowruz — Persian New Year, March 20, 2026 — a state television anchor read aloud a written statement from a man whose face the world has scarcely seen. Iran’s new Supreme Leader, Mojtaba Khamenei, had not appeared in public since ascending to the position following the assassination of his father, Ayatollah Ali Khamenei, at the start of a devastating US-Israeli military campaign on February 28. Yet his words carried enormous weight. He named the incoming year’s governing slogan: “Resistance Economy in the Shadow of National Unity and National Security.” At the very moment that Brent crude was trading above $100 a barrel — and the International Energy Agency was characterizing the Strait of Hormuz closure as the “greatest global energy security challenge in history” — Tehran had chosen not retreat, but doctrine.
This is not a crisis-management gambit. It is an ideology finding its moment.
The Origins and Evolution of Iran’s Resistance Economy
The phrase iqtisad-e moqavemati — resistance economy — has circulated in Iranian political discourse for over a decade. Ali Khamenei first introduced it formally around 2012, at the height of what Tehran characterized as the “economic war” waged by the Obama administration’s crippling oil embargo. The concept drew on a distinctly Iranian blend of revolutionary theology, post-war reconstruction memory, and third-world anti-imperialism: the idea that external pressure could be converted, almost alchemically, into self-sufficiency.
But for most of the decade between 2012 and 2022, the resistance economy remained closer to aspiration than architecture. Iranian economic policymakers — influenced by business lobbies and, during the Rouhani years, by a genuine belief that integration with the West was achievable — declined to implement the measures the doctrine implied: capital controls, import substitution industrialization, state-directed strategic reserves, and the dismantling of dollar dependency in trade settlement. What resilience the economy demonstrated was largely bottom-up: bazaaris improvising supply chains, engineers reverse-engineering sanctioned components, ordinary Iranians converting salaries into gold and dollars the moment they were paid.
The World Bank has documented what this failure to truly build the resistance economy produced: a “lost decade” of per-capita GDP growth between 2011 and 2020, contracting at an average annual rate of 0.6%. By early 2026, an estimated 22% to 50% of Iranians lived below the poverty line, while the Ministry of Social Welfare acknowledged that 57% of the population was experiencing some level of malnutrition. The rial, which traded at 70 to the dollar before the 1979 revolution, surpassed one million rials to the dollar in March 2025 — the least valuable currency on earth at that moment.
Then came the war. And with it, the pressure to finally build what had only been promised.
How the Post-12-Day War Reality Is Forcing Activation
The June 2025 “12-Day War” — Israel’s Operation Rising Lion and Iran’s retaliatory strikes — was devastating in ways that go beyond the military ledger. It targeted Iran’s nuclear infrastructure, killed senior commanders and scientists, and, alongside the January 2026 domestic protests that convulsed all 31 provinces, pushed an already fragile economy to the edge. The World Bank had projected Iran’s GDP would shrink 2.8% in 2026 before the full-scale war began on February 28. Now, with the Strait of Hormuz closed and oil supply disrupted by an estimated 8 million barrels per day, those forecasts are academic.
What the post-February 28 reality has done is collapse the ambiguity that previously surrounded Iran’s economic model. Before, there were two coexisting systems: a formal economy nominally integrated into global supply chains, and an informal IRGC-linked parallel economy operating through sanctions evasion. Now, with international marine insurers — the International Group of 12 P&I Clubs, covering 90% of ocean-going tonnage — having withdrawn cover for Hormuz transits, the formal economy has effectively been severed. What remains is the parallel system, now declared, by the Supreme Leader himself, to be the national model.
The macroeconomic data is harrowing. Inflation has surged to 45–60% in 2026, according to a mixed-methods analysis drawing on IMF, World Bank, and Central Bank of Iran data. Iran’s fiscal deficit now exceeds 10% of GDP. Food price inflation reached 105% by mid-March. The Central Bank issued its largest denomination banknote ever — 10 million rials — a monument to purchasing-power collapse. In Tehran’s Grand Bazaar, the commercial nerve center that has served as Iran’s economic barometer since the Safavid era, merchants whisper about a city divided: those with dollar accounts and IRGC connections, and everyone else.
Yet the regime has not collapsed. Understanding why requires looking at the other economy — the one that was never meant to be seen.
IRGC’s Shadow Empire: Sanctions Evasion 2.0
The Islamic Revolutionary Guard Corps controls approximately 50% of Iran’s oil export revenue, according to multiple independent analyses. That figure is the central fact of Iran’s wartime political economy. It explains why the civilian economy and the war machine now operate as two entirely separate systems — one visibly deteriorating, the other remarkably intact.
Since February 28, Iranian crude has continued flowing to China via what the Atlantic Council’s GeoEconomics Center calls the “Axis of Evasion”: a network of shadow fleet tankers operating with transponders disabled, flags altered, and GPS spoofed. Tanker-tracking data show that roughly 11.7 million barrels of Iranian crude reached Chinese refineries between February 28 and March 15 alone — none of it settled in dollars. Every barrel was cleared through China’s Cross-Border Interbank Payment System (CIPS), which processed the equivalent of $245 trillion in yuan-denominated transactions in 2025, a 43% increase from the prior year.
China absorbs roughly 90% of Iran’s oil exports. The buyers are not, for the most part, China’s major state oil companies, which remain wary of secondary sanctions. Instead, they are the “teapot” refineries — small, nominally independent processors clustered in Shandong province — which provide Beijing a degree of plausible deniability while maintaining deep operational links to state enterprises. The arrangement functions as a geopolitical subcontract: China gets discounted oil, Iran gets a lifeline, and the US Treasury’s secondary sanctions fall on entities too small to cause systemic bilateral damage.
The IRGC’s role in structuring these flows goes beyond logistics. Sanctioned shipping networks traced by Kharon researchers reveal elaborate webs of Hong Kong front companies, Shanghai ship management firms, and Barbados-flagged tankers operating as a coherent system — not a collection of opportunistic actors. Meanwhile, the Atlantic Council documents how Iran’s missile and drone production is sustained by Chinese chemical companies supplying precursors for solid rocket fuels through the same shadow supply chains that move crude. The resistance economy is not merely financial; it is industrial.
There is an older template here worth recalling. During the Iran-Iraq War of 1980–1988, the IRGC’s economic role expanded dramatically out of wartime necessity — and never contracted. The post-war privatizations of the 1990s, intended to modernize the economy, instead delivered state assets to IRGC-affiliated conglomerates, most notably Khatam al-Anbiya, the corps’ vast engineering arm. Each subsequent sanctions wave — 2012, 2018, 2025 — repeated the pattern: as foreign firms exited and private companies struggled, IRGC entities, with their currency access, informal trade routes, and political protection, were positioned to absorb what remained. The resistance economy is, in significant part, the IRGC economy with a new name.
Economic Trade-Offs: Survival vs. Collapse
The distinction between regime survival and national economic wellbeing has never been sharper. The IRGC’s parallel economy — oil revenues flowing through shadow infrastructure, yuan settlement systems, barter arrangements with Russia and Venezuela — can sustain the security apparatus and military operations for months, perhaps longer. But it cannot reverse the structural collapse of the civilian economy or prevent the poverty trap from deepening.
Data Box: Iran’s Economic Vital Signs, March 2026
- Inflation: 45–60% (IMF/World Bank estimates); food inflation at 105%
- Rial exchange rate: Above 1.4 million to the US dollar (pre-war 2026); crossed 1 million rials/USD in March 2025
- Fiscal deficit: Exceeding 10% of GDP
- GDP projection: Contraction of 2.8% in 2026 (pre-war; current estimates substantially worse)
- Oil export revenue (IRGC-controlled share): ~50%
- Iranian crude reaching China (Feb 28–Mar 15): ~11.7 million barrels
- Chinese crude imports from Iran (Jan–Feb 2026): ~1.13–1.20 million barrels/day
- Poverty rate: 22–50% of population below poverty line (March 2025 estimates)
- Malnutrition: 57% of Iranians experiencing some level of food insecurity (Ministry of Social Welfare)
What Mojtaba Khamenei’s Nowruz slogan is attempting is a political reframing of this bifurcation — presenting the civilian economy’s hardship not as evidence of state failure, but as collective sacrifice in a national security emergency. The framing has precedent: during the eight-year Iran-Iraq War, genuine popular solidarity was mobilized behind extraordinary material deprivation. Khamenei’s message explicitly invoked this memory, praising citizens who “combined fasting with jihad and established an extensive defensive line across the country.”
The critical variable is whether that solidarity holds. The January 2026 protests — which spread to all 31 provinces, driven initially by rial devaluation and food prices — demonstrated that the social contract is under severe stress. Those protests were suppressed by force. But the economic pressures that ignited them have intensified, not eased. Senior economist Masoud Nili, advisor to former president Rouhani, described the Iranian economy in April 2025 as “fundamentally broken from decades of corruption, lack of productivity, and over-reliance” on oil — a diagnosis that wartime mobilization cannot address.
The regime’s enduring wager, as one analyst put it precisely, is that the IRGC’s loyalty can be secured financially even as the civilian population bears the hardship. That calculation holds as long as shadow oil revenues continue to flow. Should the United States succeed in decisively disrupting the China-Iran oil corridor — through expanded secondary sanctions on Chinese entities or operational pressure on the shadow fleet — the arithmetic changes fundamentally.
What This Means for Global Energy, Oil Prices, and the New Multipolar Order
The closure of the Strait of Hormuz — through which roughly 20% of global oil supplies and significant LNG volumes normally transit — has produced what the IEA characterizes as the single largest supply disruption in the history of global oil markets. Brent crude surged from approximately $60 per barrel in January 2026 to above $100 within weeks of the February 28 outbreak of full-scale war. The IEA’s emergency release of 400 million barrels from strategic reserves — the largest such intervention in the agency’s history — has stabilized but not normalized markets.
The geopolitical implications extend well beyond oil prices. Tehran’s decision to allow Chinese tankers passage through the Strait while excluding Western shipping — and its reported consideration of opening the waterway to vessels agreeing to settle oil trades in yuan rather than dollars — represents the most operationally specific challenge to petrodollar dominance since that system was established in the 1970s. Previous de-dollarization discussions were theoretical. This one comes with a chokepoint, an operational shadow fleet, a functioning alternative payment infrastructure in yuan, and a geopolitical crisis without a clear resolution timeline.
China’s CIPS processed $245 trillion in 2025. The mBridge multi-CBDC platform — involving China, Hong Kong, Thailand, UAE, and Saudi Arabia — had surpassed $55 billion in transaction volume by early 2026. These are not yet existential challenges to the dollar-dominated system, which still handles roughly 89% of global foreign exchange trading. But they create the “leakage” infrastructure that complicates sanctions enforcement and, critically, demonstrates to middle powers watching the crisis that alternatives exist.
For Gulf states, the calculus is particularly complex. Saudi Arabia and the UAE have alternative, albeit limited, export routes that bypass Hormuz. But the damage to regional energy facilities and strategic commercial ports could cost $25 billion to repair, and the war risk premiums being absorbed by Asian importers — China, Japan, South Korea, and India account for 75% of the strait’s oil exports and 59% of its LNG — are already reshaping long-term supply contracts and accelerating the search for both alternative routes and alternative energy sources.
The 1970s energy crisis analogy is instructive but imperfect. That shock was primarily about price. This one involves price, sanctions architecture, payment system legitimacy, and great-power positioning simultaneously — a compound crisis that will outlast any ceasefire.
Can the Resistance Economy Outlast the Next Round of Maximum Pressure?
The answer depends on three variables whose trajectories are currently unknowable with precision.
First: the China-Iran oil corridor. Tehran is not surviving on ideology. It is surviving on approximately 1.1–1.5 million barrels per day of crude flowing to Chinese refineries, settled in yuan, through shadow infrastructure. US Treasury Secretary Scott Bessent signaled in mid-March 2026 that Washington might consider easing sanctions on some Iranian oil to relieve global energy pressures — a remarkable acknowledgment that the leverage operates in both directions. If the US tightens enforcement sufficiently to disrupt this corridor, the IRGC’s parallel economy begins to fracture. If it cannot, Iran sustains Hormuz pressure through the summer refill season and beyond.
Second: domestic political cohesion. Mojtaba Khamenei’s Nowruz message is as much a political document as an economic one. Analysts at the Eurasia Review note that his framing of the resistance economy is “overtly political — going beyond a mere mobilizing slogan” to “transform the economy into a function of internal steadfastness during wartime.” His legitimacy depends on persuading Iranians that this hardship is meaningful sacrifice, not elite mismanagement. A new supreme leader who has never appeared in public video since assuming power, consolidating authority after a dynastic succession that many Iranians view skeptically, faces an unusually fragile political foundation from which to ask for patience.
Third: the sanctions playbook of other pariah states. Iran is observing, and presumably learning from, Venezuela — whose president Nicolás Maduro was captured by the United States in January 2026, disrupting another important node in Iran’s sanctions evasion network. Russia’s experience — sustaining a war economy under sanctions by deploying similar shadow fleet tactics, yuan settlement, and BRICS payment infrastructure — offers both a model and a cautionary tale. Moscow’s resilience has been real but costly; its long-term growth trajectory has been fundamentally damaged.
Scenario Table: Iran’s Economic Trajectories, 2026–2028
| Scenario | Trigger Conditions | Economic Outcome | Probability Assessment |
|---|---|---|---|
| Managed Survival | Shadow oil flows intact; ceasefire within 6 months; partial Hormuz reopening | Inflation stabilizes 40–50%; GDP contracts 3–5%; IRGC economy intact | Moderate |
| Prolonged Attrition | Hormuz partially open; secondary sanctions tighten but don’t sever China corridor | Inflation 55–70%; GDP contracts 6–9%; civilian economy deteriorates sharply | Moderate-High |
| Escalation Spiral | Hormuz fully closed 6+ months; Chinese entities sanctioned; shadow fleet disrupted | GDP contraction 12–15%; IRGC economy fractures; social stability threatened | Low-Moderate |
| Negotiated Off-Ramp | US-Iran back-channel deal; partial sanctions relief for Hormuz opening | Inflation relief; oil export recovery; structural IRGC dominance unchanged | Low (near-term) |
Implications for 2026–2028
Tehran is not merely surviving. It is adapting in ways that will reshape the global sanctions playbook — and the task for policymakers, investors, and strategic analysts is to understand the adaptation, not merely to condemn the crisis.
For global energy markets: The Hormuz disruption has demonstrated the extraordinary fragility of the physical infrastructure underlying the global oil system. The political will to rebuild credible naval deterrence in the Gulf — already strained before the war — will face sustained testing. European energy security, already reshaped by Russia’s 2022 invasion of Ukraine, faces another structural adjustment: the realistic possibility that Hormuz transit could be weaponized again, on shorter notice, in future crises.
For the dollar-based financial system: The yuan oil settlement experiment is not a revolution. The dollar’s structural advantages — deep capital markets, rule of law, network effects — remain overwhelming. But Iran has demonstrated that the yuan-CIPS-mBridge infrastructure is operationally ready for crisis conditions. Each future sanctions confrontation will have this precedent available to actors seeking to evade dollar-denominated pressure. The marginal cost of sanctions evasion has fallen.
For the IRGC’s economic empire: The war has almost certainly accelerated the IRGC’s capture of what remains of Iran’s formal economy. As private businesses collapse under inflation and supply chain disruption, IRGC-linked entities — with their shadow trade routes, currency access, and political protection — absorb the wreckage. Post-war reconstruction, whenever it comes, will flow through the same institutions. The long-term growth trap this creates — an economy dominated by rent-seeking military-commercial conglomerates rather than competitive private enterprise — is the structural wound that no slogan, however elegantly framed, can heal.
For Iran’s people: The resistance economy’s deepest trade-off is rarely stated plainly in official communications. Self-sufficiency built on IRGC monopolies is not the same as national economic resilience. An economy in which 57% of citizens face malnutrition, the currency has lost 20,000 times its pre-revolutionary value, and food inflation runs at 105% is not resisting. It is enduring. The distinction matters enormously for the 90 million Iranians whose daily experience of the resistance economy is hunger, unemployment, and rolling blackouts — not the conceptual elegance of yuan settlement systems and shadow fleet logistics.
Mojtaba Khamenei, reading out his Nowruz message through a state television anchor while the world wondered whether he was even physically present, declared that his enemies had “been defeated.” The rial, the empty shelves, and the 7 million Iranians reported to have gone hungry tell a different story — one that the resistance economy, in all its strategic ingenuity, has yet to answer.
Discover more from The Economy
Subscribe to get the latest posts sent to your email.


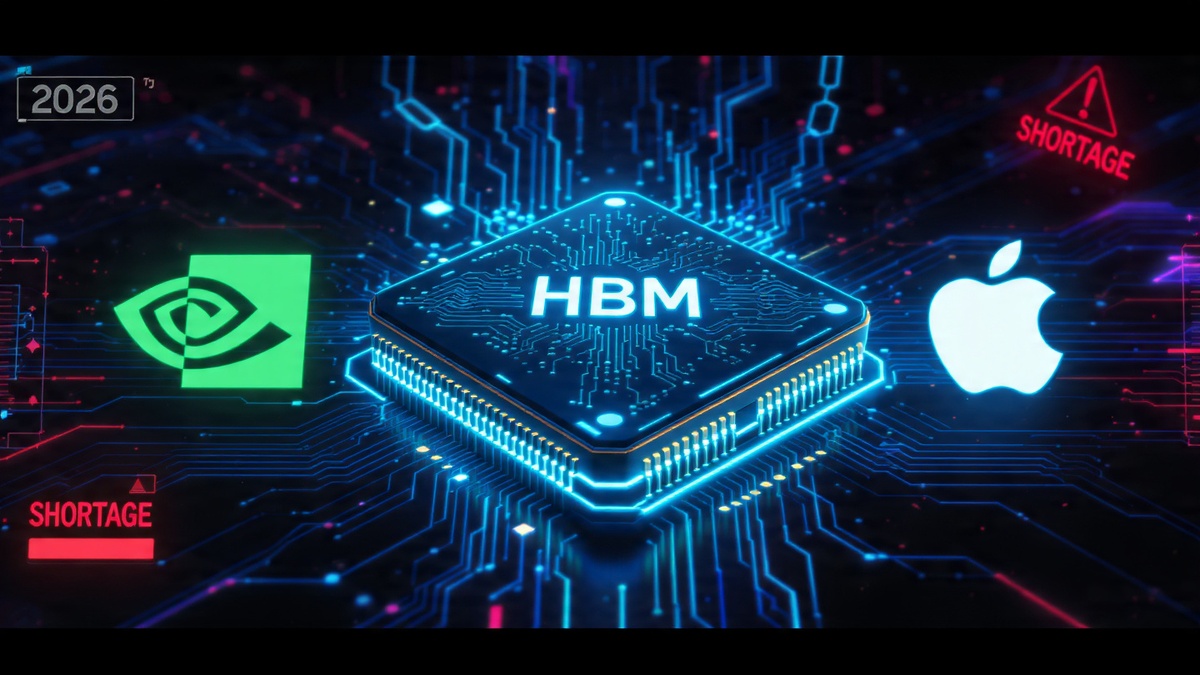
A global memory chip shortage is hitting AI hyperscalers, tanking Nvidia and Apple shares, and triggering a Wall Street rotation. Here’s what the AI sector’s supply crisis means for investors.The artificial intelligence boom that has driven Wall Street’s most extraordinary bull run in a generation is running headlong into a physical constraint: the world cannot produce memory chips fast enough to feed it.
On Friday, June 26, 2026, technology stocks extended a brutal weekly decline even as the broader market stabilized and advancing shares outnumbered declining ones. Nvidia slipped another 1% in early trading and was on pace for an 8% weekly loss—its worst five-day stretch in more than a year. Apple dived after announcing price increases for several iPad and Mac models, citing higher costs from memory chip shortages. Oracle and CoreWeave fell after the New York Times reported that OpenAI was considering delaying its initial public offering to as late as 2027.
What the headlines share is a single underlying cause: the cost of the memory chips that power AI infrastructure is rising faster than even the most aggressive hyperscaler budgets assumed, and the shortage driving that cost increase is not expected to ease before 2028.
The Architecture of the Crisis
Memory chips—specifically the high-bandwidth memory, or HBM, used in AI accelerators—are produced by a small number of manufacturers: SK Hynix, Micron, and Samsung. Demand for HBM has exploded because each new generation of Nvidia’s AI chips requires substantially more of it. As Nvidia pushes its product cycle faster to maintain competitive advantage, each cycle pulls forward enormous new demand for chips that take 18 to 24 months to ramp in production.
Micron reported strong quarterly earnings—its results have been spectacular—but the very strength of those results is the problem for the rest of the tech sector. Micron’s margins are rising because memory is scarce and expensive. The companies buying that memory—Microsoft, Amazon, Alphabet, Meta, and the rest of the hyperscaler complex—are absorbing higher input costs on a scale that is beginning to show up in margin guidance.
Analysts at Charles Schwab noted a “growing wedge” in the technology sector between memory producers like Micron—which is posting massive gains—and the hyperscaler stocks that are watching their AI infrastructure economics deteriorate. The latter group includes names like Microsoft, Amazon, and Alphabet, which are collectively projected to spend between $660 billion and $700 billion on AI infrastructure in 2026, according to research from Fair Observer.
Nvidia’s Problem Is a Market Concentration Problem
Nvidia entered 2026 having crossed a $5 trillion market capitalization—larger by GDP comparison than all but four national economies. That concentration made the stock not merely a bet on AI but a systemic weight in the S&P 500. Nvidia and its mega-cap technology peers now account for roughly 30% of the entire index—the highest concentration in half a century.
When Nvidia corrects, it does not correct in isolation. It reprices the risk premium of every fund manager with an S&P 500 benchmark, which is nearly every institutional investor in the world. The 8% weekly decline in late June—attributed to a combination of rising memory costs, margin anxiety among hyperscaler customers, and a broader rotation away from high-multiple AI stocks—had ripple effects across semiconductor infrastructure names including Lumentum, Marvell Technology, and Corning.
Apple Raises Prices—and Reveals the Exposure
Apple’s announcement of price increases for iPad and Mac models was notable for two reasons. First, Apple’s supply chain is among the most sophisticated on earth; if Apple could not absorb memory cost increases without raising consumer prices, the margin pressure is acute. Second, Apple’s pricing decision revealed an exposure that consumer electronics companies had managed to keep largely invisible through inventory buffers.
Those buffers, built up when memory was cheap, are now depleted. The shortage is forecast to persist through 2027 and potentially into 2028, driven by Nvidia’s accelerated chip release cadence and the insatiable demand of AI data centers for high-bandwidth memory. Analysts at Briefing.com noted that higher memory costs are seen “persisting throughout 2027 and perhaps into 2028, driven by increasing data center demand and Nvidia’s rapid introduction of updated AI chips.”
OpenAI Delays Its IPO—Absorbing the Lesson From SpaceX
The reported delay in OpenAI’s public offering is a direct consequence of two market developments: the broader tech weakness driven by the memory supply crisis, and the troubled IPO debut of SpaceX earlier in June, whose shares suffered heavy losses in the days following listing as global markets repriced risk.
OpenAI executives, who had targeted 2026 for a public offering, are now said to be evaluating a 2027 launch—giving markets time to stabilize and giving the company time to demonstrate that its AI infrastructure economics are sustainable at the scale that a public market valuation would demand.
The Rotation That May Define the Rest of 2026
The most significant market dynamic emerging from the memory chip crisis is not the decline in any single stock but the rotation it is enabling. As the mega-cap AI trade faces margin headwinds, investors are moving into financial and industrial companies, healthcare, and energy—sectors that had been overshadowed for years by the AI growth narrative. The Dow, weighted toward those steadier names, was holding up even as the Nasdaq declined through the final week of June.
That divergence—Dow up, Nasdaq down—is a familiar pattern in sector rotation cycles. It does not necessarily signal a bear market. It may signal the beginning of a more broadly distributed bull market, one less concentrated in five or seven names. The memory supply crisis, in that reading, is not the end of the AI boom—it is the first serious test of whether the boom’s economics are durable enough to survive contact with physical constraints.
Discover more from The Economy
Subscribe to get the latest posts sent to your email.
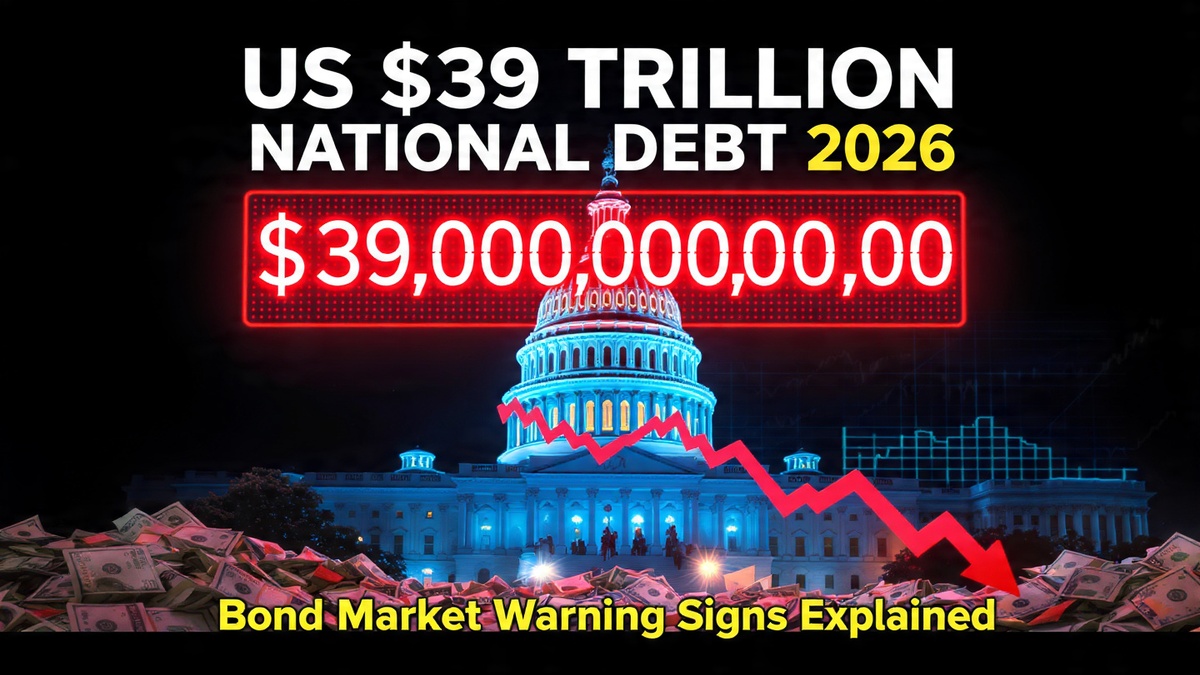
US national debt has crossed $39 trillion, bond yields are spiking, and Treasury auctions are showing soft demand. Here is what the bond market knows that Washington refuses to acknowledge.The United States crossed a number this year that no country in history has ever reached: $39 trillion in total federal debt. Not in inflation-adjusted terms. Not as a percentage of GDP. In raw dollars, the figure that sits on the public ledger of the world’s largest economy grew by $1 trillion in five months and $2 trillion in seven and a half months—and it is not slowing down.
What makes the velocity of that accumulation remarkable is the context in which it occurred. The Iran war added direct military expenditure at a pace that budget analysts said was accelerating. The 2025 tax cuts continued to erode revenue. And rising interest rates—the same rates the Federal Reserve is now signaling it may push higher still—are compounding the cost of servicing all that outstanding debt in a feedback loop that the bond market has quietly begun to price.
What the Auctions Are Saying
The most direct readout of market confidence in U.S. fiscal sustainability is the Treasury auction market, where the government sells new debt every week. Recent auctions have produced signals that bond investors usually describe in muted, technical language—but the direction is consistent.
A recent three-year Treasury auction cleared at 4.192%, well above the 3.965% at the prior auction. Yields rise when demand is soft. Soft demand at U.S. Treasury auctions is not a crisis signal—these are still among the most liquid securities in the world—but the trend line is one that fixed-income analysts at institutions ranging from J.P. Morgan to the Council on Foreign Relations have flagged as requiring close attention.
Foreign investors currently hold just above 30% of the Treasury market. Alarm bells rang briefly after April 2025’s Liberation Day tariffs—when U.S. bonds, equities, and the dollar all sold off together, the rarest of Wall Street trifectas—but subsequent data showed no dramatic reallocation away from Treasuries by foreign holders. That relative stability, however, depends on the continuation of conditions (a strong dollar, a functioning petrodollar system, geopolitical faith in U.S. institutions) that several of those conditions’ own architects now question.
The Interest Payment Problem
Of that $39 trillion, roughly $31.4 trillion is held by the public—the portion traded in financial markets globally. At current yields, the annual interest cost the U.S. government pays is on track to exceed $1 trillion for the first time in the country’s history. That figure is not a forecast. It is an arithmetic consequence of the debt level and the rate environment.
For context: U.S. defense spending in 2026 is approximately $900 billion. The federal government will spend more on interest payments than on the entire military. More than on Medicaid. More than on all discretionary non-defense programs combined. That structural reality constrains fiscal policy in ways that economists at the Deloitte Center for Financial Services have described as the most significant long-term challenge facing the U.S. economy.
“Higher bond yields affect U.S. fiscal dynamics in a number of ways,” analysts at the Council on Foreign Relations noted in their examination of tariff and Treasury interactions. “As interest payments on debt increase and use a greater share of available government funds, policymakers become more constrained around other fiscal priorities. They also can be more challenged when they need to respond to economic shocks.”
Three Credit Downgrades, Zero Course Correction
The United States has now been downgraded by all three major credit ratings agencies: S&P in 2011, Fitch in 2023, and Moody’s in May 2025. Each downgrade arrived with similar language—concerns about fiscal trajectory, political dysfunction over the debt ceiling, and a structural unwillingness to match revenues with spending. Each was followed by a brief market convulsion and then, effectively, nothing. Congress did not respond. The debt continued growing.
That pattern—of consequences being absorbed rather than heeded—is what makes the current moment structurally different from prior debt discussions, according to analysts who study sovereign fiscal crises. In those prior episodes, the U.S. still had room to maneuver: rates were low, the global appetite for dollar-denominated safe assets was rising, and alternative reserve currencies were even less credible than they are today. The margin for error has narrowed on all three dimensions.
The Political Ceiling on Solutions
The challenge is not primarily economic—it is political. Addressing a $39 trillion debt requires some combination of higher revenues, lower spending, or both. In the current Washington environment, tax increases are politically radioactive for one party and spending cuts face equivalent resistance from the other—particularly for the entitlement programs (Social Security, Medicare, Medicaid) that account for the largest share of mandatory outlays.
Markets have not yet priced the national debt as an immediate crisis, as analysts at U.S. Bank noted in their midyear market review: investors continue to watch whether rising debt eventually requires higher interest rates to attract enough Treasury buyers. The passive construction of that sentence—”continue to watch”—captures the market’s posture precisely. It is waiting. It is not yet acting.
The bond market’s message, in the language of Treasury yields and auction results, is being sent in increments rather than in a single shock. Washington is not listening. The question is not whether the message will eventually become impossible to ignore—it is how high rates must rise, and how much growth must slow, before the political system treats the ledger as a constraint rather than an abstraction.
Discover more from The Economy
Subscribe to get the latest posts sent to your email.
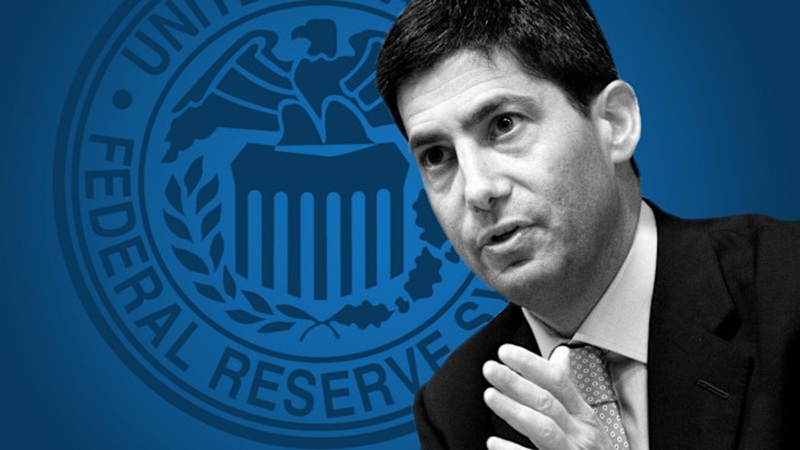
New Fed Chair Kevin Warsh surprised markets with a hawkish stance at his first FOMC press conference. Here’s how his rate-hike signals are rippling through stocks, bonds, mortgages, and gold. The Federal Reserve’s first policy meeting under new Chair Kevin Warsh sent shockwaves through global financial markets on June 17, 2026—not because policymakers moved rates, but because of what nine of them signaled they might do next.
Warsh, appointed by President Trump after months of public attacks on his predecessor Jerome Powell, arrived in Washington carrying expectations of a dovish turn. He had championed rate reductions while angling for the chairmanship, and the White House broadly supported looser monetary conditions. What markets got instead was a coldly hawkish institution that spent the better part of two hours dismantling those assumptions in real time.
The Meeting That Changed the Calculus
The Federal Open Market Committee held the federal funds rate unchanged at its existing range, but nine of 18 committee members penciled in at least one rate hike before year-end in the central bank’s updated Summary of Economic Projections—the dot plot. Six of those nine indicated support for two quarter-point increases. The shift represented a dramatic departure from the March projections, in which no policymaker had envisioned a hike, and the committee as a whole had forecast one cut.
The Dow Jones Industrial Average fell 507 points, or 0.98%, in the session. The S&P 500 lost 1.21% and the Nasdaq Composite dropped 1.34%. Two-year Treasury yields—the instrument most sensitive to near-term rate expectations—jumped 16 basis points to 4.21%, their highest reading in more than a year. Traders scrambled to reprice Fed futures, with CME FedWatch data showing the probability of a September hike jumping to 49% from 27% the previous session.
Warsh’s Statement Was Deliberately Brief—and Deliberately Alarming
The published FOMC statement was unusually short. Warsh stripped language that had previously signaled the Fed’s next move would be a cut and replaced it with a blunt acknowledgment that inflation remains “elevated”—a legacy partly of energy “supply shocks” stemming from the conflict in the Middle East.
“We’ve missed on inflation for five years and we’re going to fix that,” Warsh told reporters. “When we deliver on our price stability objectives—which we will—the American people will feel as though the hardships they’ve been living through are in the rear-view mirror.”
U.S. inflation hit 4.2%—double the Fed’s 2% target and its highest level in three years—leaving the committee little political room to stay passive. Warsh declined to submit a personal rate forecast to the dot plot, an unusual act of institutional reticence that some analysts read as an attempt to preserve maximum flexibility.
Bank of America Changes Its Forecast
Within days, Bank of America overhauled its rate outlook. Analysts at the bank predicted the Fed would raise the benchmark rate by a quarter point three times in 2026, lifting it from the current 3.5%–3.75% range to 4.25%–4.5%. The bank’s prior base case had been for rates to hold steady all year.
“The risk that they might need to raise rates has clearly risen,” said Matthew Luzzetti, chief U.S. economist at Deutsche Bank. BofA analysts acknowledged that Warsh could still be “strategically hawkish”—gaining anti-inflation credibility while actually buying time to cut later—but said the door to that interpretation was closing as incoming data showed persistent price pressure.
The hawkish turn unfolded against an unusual institutional backdrop. Warsh became the first new Fed chairman in more than 70 years to inherit an active predecessor on the governing board. Powell, whose term as chair Warsh replaced, remained as a board governor and voted at the June meeting—a fact that gives every subsequent public utterance from the former chair a level of market weight that Warsh’s team cannot easily ignore.
The Housing Market Reads a New Era
The rate signals carried immediate consequences for American homebuyers. Chen Zhao, head of economics research at Redfin, called it “a new era” and warned that mortgage rates were unlikely to retreat significantly in the near term. Bill Banfield of Rocket Mortgage noted that home sales were responding more to labor market strength than to rate movements and that determined buyers would continue entering the market—though the affordability calculus had shifted.
Vishal Garg, CEO of AI mortgage platform Better, cut to the practical point: “The Fed doesn’t set mortgage rates, but mortgage rates track long-term Treasury yields, which move based on investor expectations for inflation, growth, and the Fed’s next step.”
Warsh has separately announced five internal task forces to examine the Fed’s communication practices, data sources, and inflation-analysis frameworks—a structural reform effort that signals he intends a longer-term overhaul of the institution rather than a cosmetic change of tone.
What Comes Next
The path forward for markets hinges on three variables: whether consumer prices moderate fast enough to make hikes unnecessary, whether the labor market stays strong enough to absorb higher borrowing costs, and whether Warsh can maintain independence from a White House that publicly installed him to cut.
Kristina Hooper, chief market strategist at Man Group, summed up the market’s posture after the meeting: “Markets were holding out hope that Chair Warsh would throw them some kernels of real dovishness that they obviously felt they didn’t get.”
With BofA now projecting a rate corridor that would be the highest since 2007, and with inflation stubbornly running at twice the Fed’s target, the calculation Warsh faces is one no new Fed chair has confronted in a generation: tighten into a White House headwind or validate exactly the critics who warned his appointment was political.
Discover more from The Economy
Subscribe to get the latest posts sent to your email.

Trump Tariffs 2026: Economic Impact, Household Costs & Trade War Outlook

China Economy 2026: Export Boom Masks Property Crisis & Investment Slump

US Inflation 4% May 2026: Is the Worst Over? Fed, Oil Prices

AI Memory Chip Shortage 2026: Nvidia, Apple & What Comes Next

US $39 Trillion National Debt 2026: Bond Market Warning Signs Explained

Ray Dalio US Suez Moment 2026: Dollar Decline, $39 Trillion Debt & Empire’s End

Kevin Warsh Fed Rate Hike 2026: What His Hawkish Pivot Means for Markets

Gold Price 2026: Will Gold Hit $6,000? JPMorgan Forecast, Drivers & Investment Guide

US Recession 2026: Four Key Threats, Warning Signs & How to Protect Your Portfolio

AI Energy Demand 2026: Data Centres, Power Grids & the $725B Infrastructure Boom

AI Semiconductor Selloff 2026: Micron Crash, Nasdaq Pullback & What Comes Next

US Tariffs 2026: How Trump’s 11.7% Effective Rate Is Reshaping Global Trade & Inflation

Global Stock Markets 2026: S&P 500 at Record Highs Amid War, Inflation & Rate Risk

Spain Near 100M Tourists: A Structural Travel Map Shift : Booming Travel Economy

KPMG Australia CEO Resigns After Whistleblower Claims Exposed Investigation Failures

PwC China Partner Payouts Cut Amid Evergrande Audit Fraud

Broadcom Market Value Loss: Revenue Forecast Disappoints

Investors Pile Into Bullish Dollar Bets as ‘US Exceptionalism’ Trade Returns

Here’s How Much It’ll Cost You to Be Part of SpaceX’s Record-Breaking $75 Billion IPO

Nasdaq Tumbles 4% as Chip and Memory Stocks Sink: A $1.2 Trillion Wipeout

How to Fix Pakistan’s Debt Economy: A Structural Blueprint

Smash Capital Leads $200M Funding for Allen Control Systems

Democrats Draw a Red Line Around Military AI — And the Pentagon Is Already Pushing Back

New Investment Super-Cycle: AI, Green Energy & Re-Shoring

Russia Overspends on Putin’s War in Ukraine by $28bn

Xponential Fitness Franchise Lawsuit: The $3.97M Judgment

Middle East Conflict Oil Prices: The $4 Surge Explained

The End of the Chatbot: Why OpenAI is Tearing Up Its Most Successful Product
-

 Markets & Finance6 months ago
Top 15 Stocks for Investment in 2026 in PSX: Your Complete Guide to Pakistan’s Best Investment Opportunities
-

 Analysis4 months ago
Top 10 Stocks for Investment in PSX for Quick Returns in 2026
-

 Analysis5 months ago
Brazil’s Rare Earth Race: US, EU, and China Compete for Critical Minerals as Tensions Rise
-

 Analysis4 months ago
Johor’s Investment Boom: The Hidden Costs Behind Malaysia’s Most Ambitious Economic Surge
-

 Banks5 months ago
Best Investments in Pakistan 2026: Top 10 Low-Price Shares and Long-Term Picks for the PSX
-

 Investment6 months ago
Top 10 Mutual Fund Managers in Pakistan for Investment in 2026: A Comprehensive Guide for Optimal Returns
-

 Global Economy6 months ago
15 Most Lucrative Sectors for Investment in Pakistan: A 2025 Data-Driven Analysis
-

 Global Economy6 months ago
Pakistan’s Export Goldmine: 10 Game-Changing Markets Where Pakistani Businesses Are Winning Big in 2025