
Analysis
Eurozone Borrowing Costs Surge to Multi-Decade Highs as Iran Shock Threatens a Fiscal ‘Vicious Circle’
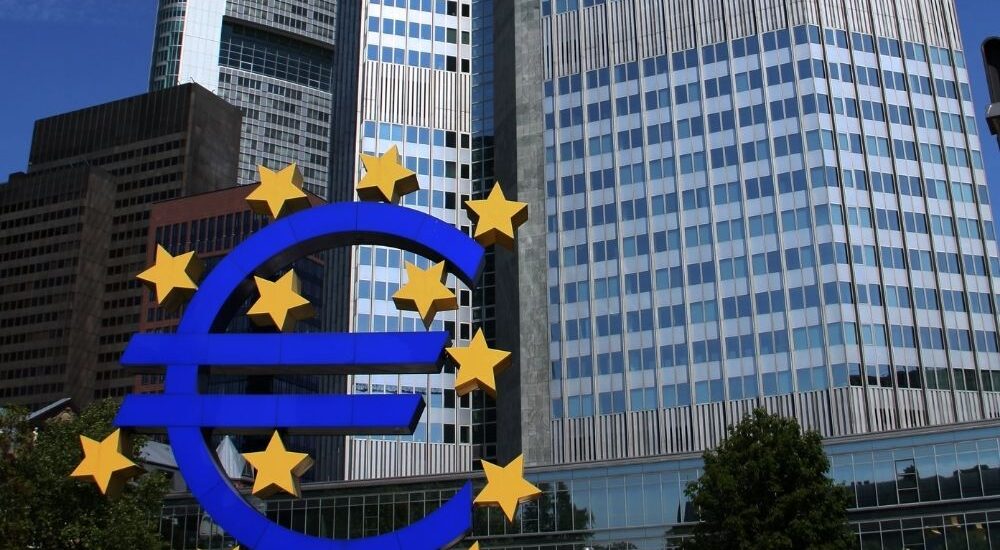
Government bonds are heading for one of their worst months in a decade. With Brent crude above $112, the ECB signalling it may hike despite stalling growth, and high-debt sovereigns facing a brutal double squeeze, investors are warning of a structural ‘deterioration’ in public finances — and this time, the geopolitical trap may be harder to escape than 2022.
There is a scene that European debt traders know too well: the slow, sickening realisation that the rules of the game have changed overnight. It happened when Lehman collapsed, when Greece buckled, when Russia invaded Ukraine. Now, as March 2026 draws to a close, it is happening again — this time triggered not by a bank’s balance sheet or a land war in Europe, but by a chokehold on the world’s most important maritime artery: the Strait of Hormuz.
Eurozone borrowing costs have hit levels not seen since the height of the sovereign debt crisis fifteen years ago. Germany’s 10-year Bund, the safe-haven benchmark for the entire euro area, was trading above 3.13% on Friday — its highest print since May 2011 — and on course for a monthly rise of 47 basis points, the largest since December 2022. German Bund yields at 15-year highs signal a structural repricing, not a mere sentiment wobble. The pain is sharper further along the risk spectrum: French OATs have vaulted past 3.7%, approaching 17-year peaks, while Italian BTPs now yield above 3.9% — both markets registering their worst monthly performances in well over a decade.
“Yields are waking up to the economic Dunkirk that faces the global economy thanks to the war in Iran,” Chris Beauchamp, chief market analyst at IG, told CNBC. The analogy is apt. What began on 28 February 2026 as a series of US-Israeli strikes on Iranian nuclear and military infrastructure has metastasised, via Tehran’s near-total closure of the Strait of Hormuz, into a global supply shock of the first order. Brent crude has surged from $72 to above $112 in a single month — a 55% jump that is being felt in petrol stations from Lisbon to Warsaw, in factory energy bills across the Rhine Valley, and, with a vengeance, in sovereign bond markets that had only recently exhaled after years of post-pandemic turbulence.
The Anatomy of the Sell-Off: Bear Flattening and the Fiscal Squeeze
Understanding the precise shape of the sell-off matters as much as its magnitude. The 2-year yields have risen faster than their 10-year counterparts across the eurozone — a textbook “bear-flattening” move, reflecting hawkish monetary policy repricing. In Germany, the 2-year Schatz has climbed from roughly 2% before the conflict erupted to 2.65%. In France, 2-year OATs have surged from 2.1% to above 2.8%. In Italy, the equivalent note has jumped from around 2.15% to 3%. This is not a long-run pessimism trade; it is the market demanding that the European Central Bank act, and act soon.
“The aggressive bear flattening of yield curves reflects a hawkish monetary policy repricing in response to inflation fears stemming from the Iran war,” Robert Timper, Chief Fixed Income Strategist at BCA Research, told Euronews. The longer end, meanwhile, tells its own story. The rise in 20- and 30-year yields across the bloc signals something more troubling than near-term rate expectations: a deteriorating confidence in the long-term growth prospects of Europe’s major economies.
Pre- vs Post-Conflict Yield Levels: The Scale of the Repricing
| Sovereign | Pre-Conflict 10Y Yield | Current 10Y Yield | Monthly Rise (bps) | Last at This Level |
|---|---|---|---|---|
| Germany (Bund) | 2.65% | ~3.13% | +47 | May 2011 |
| France (OAT) | 3.20% | >3.70% | +50 | 2009 |
| Italy (BTP) | 3.30% | >3.90% | +60 | Early 2024 |
| Spain (Bonos) | ~3.00% | ~3.60% | +60 | 2014 |
| UK (Gilt, 10Y) | ~4.25% | >5.07% | +83 | 2008 |
Sources: CNBC, Euronews, Bloomberg, RTE, as of 27–28 March 2026. Pre-conflict levels as of late February 2026.
The tally is brutal. But it is in the fiscal arithmetic — the hidden second-order shock — that the Iran crisis reveals its most dangerous dimension.
Why This Is More Dangerous Than 2022’s Energy Shock
The instinct among veteran European policymakers has been to draw parallels with Russia’s invasion of Ukraine four years ago. The ECB itself has reached, sometimes somewhat defensively, for reassurance. Lagarde acknowledged that “the initial shock has so far still been smaller” than 2022, citing a more “benign” economic backdrop — lower pre-existing inflation, a less tight labour market, and no post-pandemic demand overhang. But the comparison, for all its comfort, obscures three features of the 2026 crisis that make it structurally more dangerous for fiscal sustainability.
First, the monetary policy trap is tighter. In 2022, the ECB was starting from near-zero rates, which meant that hiking — however belatedly — did not immediately translate into ruinous debt-service costs for governments. Now, with the ECB’s deposit rate at 2% and markets fully pricing in two to three additional 25-basis-point hikes by September 2026, the sovereign debt-service burden rises in a system that is already levered. Financial investors now expect two to three rate hikes from the ECB this year, seeing inflation above the 2% target for several years. Every 25-basis-point move feeds directly into the refinancing cost of governments rolling over short-duration debt. For France, which carries a debt-to-GDP ratio of 114%, and Italy, at nearly 138%, that is not an abstraction — it is a measurable fiscal drag arriving at the worst possible moment.
Second, the growth destruction is compounding the revenue squeeze. The OECD has warned that the conflict poses a “real risk of a stagflationary shock” — cutting an estimated 0.6 percentage points off EU GDP in 2026 and 2027 in a prolonged-conflict scenario. The ECB revised its 2026 eurozone growth forecast down to just 0.9% in its March meeting — barely above stagnation — while simultaneously revising inflation up to 2.6% in the baseline and potentially as high as 4.4% in a severe scenario where energy disruption persists. EU composite PMIs have already slid, with the services sector nearly stalling at 50.1 and new orders contracting for the first time in eight months. Weak growth means lower tax revenues; lower tax revenues mean wider deficits; wider deficits mean more bond issuance; more bond issuance means more upward pressure on yields. The fiscal-geopolitical vicious circle begins to spin.
Third, and most insidiously, the shock is arriving as Europe is simultaneously ramping up defence spending. Germany’s historic debt brake loosening — designed to fund both infrastructure and defence — was meant to be a well-managed reflation of the eurozone’s largest economy. Instead, it is now competing for investor capital with energy-crisis borrowing and social protection spending, all in a market where global 10-year yields are climbing to their highest since May 2024. The term premium — the compensation investors demand for locking up capital over years rather than months — is rising as uncertainty about the conflict’s duration multiplies. Only about a fifth of the yield rise in long-dated bonds is accounted for by near-term inflation expectations; the rest represents a growing risk premium for fiscal and geopolitical uncertainty.
The Periphery Under Pressure: Italy, France, and the Transmission Risk
The question shadowing every discussion of eurozone bond markets is, as ever, how much stress the periphery can absorb before the spread dynamics become self-reinforcing. Italy’s 10-year BTP-Bund spread has widened materially, though it remains far from the crisis-era peaks of 300 basis points. More immediately concerning is France, which entered the crisis with its own political fragility — Prime Minister Bayrou’s government narrowly survived a confidence vote on its austerity budget just months ago — and a debt-to-GDP ratio that makes bond market discipline a genuinely binding constraint.
The ECB’s Transmission Protection Instrument (TPI) remains the conceptual backstop against disorderly spread widening, but its activation conditions are murky, particularly for France, which is formally subject to the EU’s Excessive Deficit Procedure. If OAT spreads over Bunds were to widen so sharply as to impair the transmission of monetary policy, the ECB would face an impossible choice: deploy the TPI and risk moral hazard, or hold back and watch fiscal contagion spread.
Spain’s flash inflation reading — 3.3% for March, the first eurozone print to emerge since the conflict began — came in below the 3.7% consensus, offering a sliver of relief. But it also confirmed that the inflationary pass-through of $112 oil is real and gathering momentum. Markets are currently pricing in more than a 90% probability of an ECB rate hike by June, with traders fully pricing three 0.25-percentage-point moves by September. That is a remarkable pivot in a matter of weeks. And it is one that creates an acute problem for high-debt governments that were counting on continued ECB accommodation to manage their refinancing calendars.
Lagarde’s Tightrope: The 2022 Playbook Cannot Be Simply Recycled
Christine Lagarde has spent considerable energy since the Iran conflict began making clear that the ECB has learned from its 2022 mistakes. At “The ECB and Its Watchers” conference in Frankfurt on 25 March, she was unusually direct: the bank will not be “paralysed by hesitation” and stands ready to act “at any meeting”. “If the shock gives rise to a large, though not-too-persistent, overshoot of our target,” she said, “some measured adjustment of policy could be warranted.”
She is right to be vigilant. But the uncomfortable truth is that the ECB’s toolkit for this crisis is less clean than it was in 2022. When Russia invaded Ukraine, the ECB’s principal challenge was one-dimensional: fight inflation, even at the cost of growth. Now, the bank faces a genuinely bifurcated mandate — arrest inflation expectations before second-round wage and service-price effects embed, while simultaneously not tipping a growth-impaired eurozone into outright recession through premature tightening. In the ECB’s “severe” scenario, where higher energy prices persist through 2027, annual inflation could deviate from the baseline by almost three percentage points — and would not return to target within the projection period. That is not a scenario the ECB can “look through.”
The governing council’s internal compass has shifted. Philip Lane, the ECB’s chief economist, flagged companies’ price-hike expectations and new-hire wage settlements as the two key early-warning indicators of second-round effects. If either starts to move meaningfully in the coming weeks — as firms attempt to pass through energy costs and workers demand compensation — the case for a May hike hardens considerably. One senior bond manager at a Paris-based asset manager, speaking privately, put it plainly: “A hike in April would have been unthinkable six weeks ago. A hike by June is now our base case. The ECB has to be seen to be acting.”
The Fiscal-Geopolitical Vicious Circle: A Proprietary Framework
What makes the 2026 bond sell-off particularly treacherous is the feedback loop it generates — what this analysis terms the fiscal-geopolitical vicious circle. The mechanism works as follows: the Iran shock raises energy prices, which raises inflation, which forces the ECB toward tighter policy, which raises bond yields, which raises governments’ debt-service costs, which widens budget deficits, which requires more bond issuance, which further pressures yields — at which point investor confidence in fiscal sustainability weakens, the risk premium on sovereign debt rises further, and the circle tightens.
Each of the eurozone’s major economies enters this loop at a different point of vulnerability:
- Germany begins from a position of relative fiscal strength, but its defence and infrastructure borrowing ambitions mean supply is rising precisely as the buyer base is reoriented by rate expectations. The Bund, historically the flight-to-safety anchor of the eurozone, has lost some of its safe-haven premium as yields rise across all maturities simultaneously.
- France is arguably the most exposed. Its debt-to-GDP of 114%, pre-existing political fragility, and a structural inability to achieve meaningful fiscal consolidation without political crisis mean that any sustained yield rise translates directly into worsening primary balance requirements. Political uncertainty and declining interest from foreign — particularly Japanese — investors have already weakened demand for OATs even before the Iran conflict.
- Italy is better placed than the headline debt number (138% of GDP) might suggest. The domestic investor base is deep and loyal; the BTP-Bund spread remains far from dangerous territory; and the Meloni government has maintained a credible, if narrow, fiscal consolidation path. But growth of just 0.4% forecast by the OECD for 2026 — already incorporating a downward revision of 0.2 percentage points since December — leaves no margin for error if energy costs compound the fiscal drag further.
What This Means for 2026–2027: Policy and Investment Implications
For fixed income investors, the signal is not yet to panic — but neither is it to hold. Nicholas Brooks, head of economic and investment research at ICG, argues that the yield spike could prove short-lived if oil retreats from triple digits by the summer. That remains a legitimate base case. US-led diplomacy — including a Trump administration deadline for Iran to reopen Hormuz — could change the energy calculus quickly. But it is no longer the consensus. The longer Brent stays above $100, the more structural the fiscal damage becomes, and the less reversible the yield repricing appears.
Four implications stand out for the period ahead:
1. The ECB rate path is the decisive variable. If the governing council delivers even one 25-basis-point hike at its April or June meeting, it will crystallise the repricing already priced by markets into hard budget arithmetic for every eurozone government. Defence of the 2% deposit rate is no longer guaranteed beyond the next meeting. Watch the April flash HICP readings — due in the final week of April — and any surprise in wage settlements.
2. Peripheral spread management moves back to centre stage. The TPI has never been formally activated, and its activation conditions remain politically complex for France. If OAT-Bund spreads push above 100 basis points with speed — the rate of change, not the level, is what triggers contagion — expect markets to test the ECB’s backstop credibility again. For Italian BTPs, the comfort zone has a wider outer boundary, but it is not limitless.
3. Energy security spending will complicate fiscal trajectories through 2027. Governments that had planned modest consolidation paths are facing energy subsidy re-spending demands, social protection extensions, and defence commitments — all in a higher yield environment. The EU’s fiscal rules, already strained, face another political stress test if France’s deficit overshoots materially in 2026.
4. The structural case for eurozone energy diversification has never been stronger. The 2022 shock accelerated LNG terminal investment and renewable build-out. The 2026 shock, arriving before European energy storage is fully independent of Gulf supplies, makes the acceleration existential. Governments and investors that position for this transition — rather than simply hedging the current crisis — will define the eurozone’s economic resilience through the end of the decade.
The bond market’s verdict is already in. March 2026 will be recorded as one of the worst months for European government debt in a decade. Whether it becomes the prelude to a managed stabilisation or the opening chapter of a new sovereign debt storm depends — as it so often has — on how long the guns keep firing in the Gulf, and how deftly Frankfurt responds. Neither answer is yet written.
Authoritative Sources
- Bloomberg — Global Bond Yields Climb as Iran War Upends Rate Expectations
- CNBC — Government Bonds Face ‘Perfect Storm’ as Iran War Rattles Central Banks
- Euronews — Bond Yields Surge as Iran War Stirs Inflation Fears
- Bloomberg — EU Warns Protracted Iran War Could Shave 0.6pp Off Growth
- CNBC — European Bond Yields at 15-Year Highs Amid Inflation, Rate Hike Fears
- Bloomberg — ECB Won’t Be ‘Paralyzed by Hesitation’ on Iran, Lagarde Says
- ECB Official Speech — Navigating Energy Shocks: Risks and Policy Responses (Lagarde, 25 March 2026)
- Reuters / Investing.com — ECB’s Lagarde Opens Door to Rate Hikes if Iran Conflict Pushes Up Inflation
- Euronews — Iran War Energy Shock Puts ECB on Alert
- Axios — Iran War Treasury Inflation Rate Cuts
- OMFIF — Putting a Price on French Political Turmoil
- ING Think — Market Impact of French Political Turmoil
- Morningstar — Europe’s Bond Market Selloff: What’s Happening?
Discover more from The Economy
Subscribe to get the latest posts sent to your email.


A global memory chip shortage is hitting AI hyperscalers, tanking Nvidia and Apple shares, and triggering a Wall Street rotation. Here’s what the AI sector’s supply crisis means for investors.The artificial intelligence boom that has driven Wall Street’s most extraordinary bull run in a generation is running headlong into a physical constraint: the world cannot produce memory chips fast enough to feed it.
On Friday, June 26, 2026, technology stocks extended a brutal weekly decline even as the broader market stabilized and advancing shares outnumbered declining ones. Nvidia slipped another 1% in early trading and was on pace for an 8% weekly loss—its worst five-day stretch in more than a year. Apple dived after announcing price increases for several iPad and Mac models, citing higher costs from memory chip shortages. Oracle and CoreWeave fell after the New York Times reported that OpenAI was considering delaying its initial public offering to as late as 2027.
What the headlines share is a single underlying cause: the cost of the memory chips that power AI infrastructure is rising faster than even the most aggressive hyperscaler budgets assumed, and the shortage driving that cost increase is not expected to ease before 2028.
The Architecture of the Crisis
Memory chips—specifically the high-bandwidth memory, or HBM, used in AI accelerators—are produced by a small number of manufacturers: SK Hynix, Micron, and Samsung. Demand for HBM has exploded because each new generation of Nvidia’s AI chips requires substantially more of it. As Nvidia pushes its product cycle faster to maintain competitive advantage, each cycle pulls forward enormous new demand for chips that take 18 to 24 months to ramp in production.
Micron reported strong quarterly earnings—its results have been spectacular—but the very strength of those results is the problem for the rest of the tech sector. Micron’s margins are rising because memory is scarce and expensive. The companies buying that memory—Microsoft, Amazon, Alphabet, Meta, and the rest of the hyperscaler complex—are absorbing higher input costs on a scale that is beginning to show up in margin guidance.
Analysts at Charles Schwab noted a “growing wedge” in the technology sector between memory producers like Micron—which is posting massive gains—and the hyperscaler stocks that are watching their AI infrastructure economics deteriorate. The latter group includes names like Microsoft, Amazon, and Alphabet, which are collectively projected to spend between $660 billion and $700 billion on AI infrastructure in 2026, according to research from Fair Observer.
Nvidia’s Problem Is a Market Concentration Problem
Nvidia entered 2026 having crossed a $5 trillion market capitalization—larger by GDP comparison than all but four national economies. That concentration made the stock not merely a bet on AI but a systemic weight in the S&P 500. Nvidia and its mega-cap technology peers now account for roughly 30% of the entire index—the highest concentration in half a century.
When Nvidia corrects, it does not correct in isolation. It reprices the risk premium of every fund manager with an S&P 500 benchmark, which is nearly every institutional investor in the world. The 8% weekly decline in late June—attributed to a combination of rising memory costs, margin anxiety among hyperscaler customers, and a broader rotation away from high-multiple AI stocks—had ripple effects across semiconductor infrastructure names including Lumentum, Marvell Technology, and Corning.
Apple Raises Prices—and Reveals the Exposure
Apple’s announcement of price increases for iPad and Mac models was notable for two reasons. First, Apple’s supply chain is among the most sophisticated on earth; if Apple could not absorb memory cost increases without raising consumer prices, the margin pressure is acute. Second, Apple’s pricing decision revealed an exposure that consumer electronics companies had managed to keep largely invisible through inventory buffers.
Those buffers, built up when memory was cheap, are now depleted. The shortage is forecast to persist through 2027 and potentially into 2028, driven by Nvidia’s accelerated chip release cadence and the insatiable demand of AI data centers for high-bandwidth memory. Analysts at Briefing.com noted that higher memory costs are seen “persisting throughout 2027 and perhaps into 2028, driven by increasing data center demand and Nvidia’s rapid introduction of updated AI chips.”
OpenAI Delays Its IPO—Absorbing the Lesson From SpaceX
The reported delay in OpenAI’s public offering is a direct consequence of two market developments: the broader tech weakness driven by the memory supply crisis, and the troubled IPO debut of SpaceX earlier in June, whose shares suffered heavy losses in the days following listing as global markets repriced risk.
OpenAI executives, who had targeted 2026 for a public offering, are now said to be evaluating a 2027 launch—giving markets time to stabilize and giving the company time to demonstrate that its AI infrastructure economics are sustainable at the scale that a public market valuation would demand.
The Rotation That May Define the Rest of 2026
The most significant market dynamic emerging from the memory chip crisis is not the decline in any single stock but the rotation it is enabling. As the mega-cap AI trade faces margin headwinds, investors are moving into financial and industrial companies, healthcare, and energy—sectors that had been overshadowed for years by the AI growth narrative. The Dow, weighted toward those steadier names, was holding up even as the Nasdaq declined through the final week of June.
That divergence—Dow up, Nasdaq down—is a familiar pattern in sector rotation cycles. It does not necessarily signal a bear market. It may signal the beginning of a more broadly distributed bull market, one less concentrated in five or seven names. The memory supply crisis, in that reading, is not the end of the AI boom—it is the first serious test of whether the boom’s economics are durable enough to survive contact with physical constraints.
Discover more from The Economy
Subscribe to get the latest posts sent to your email.
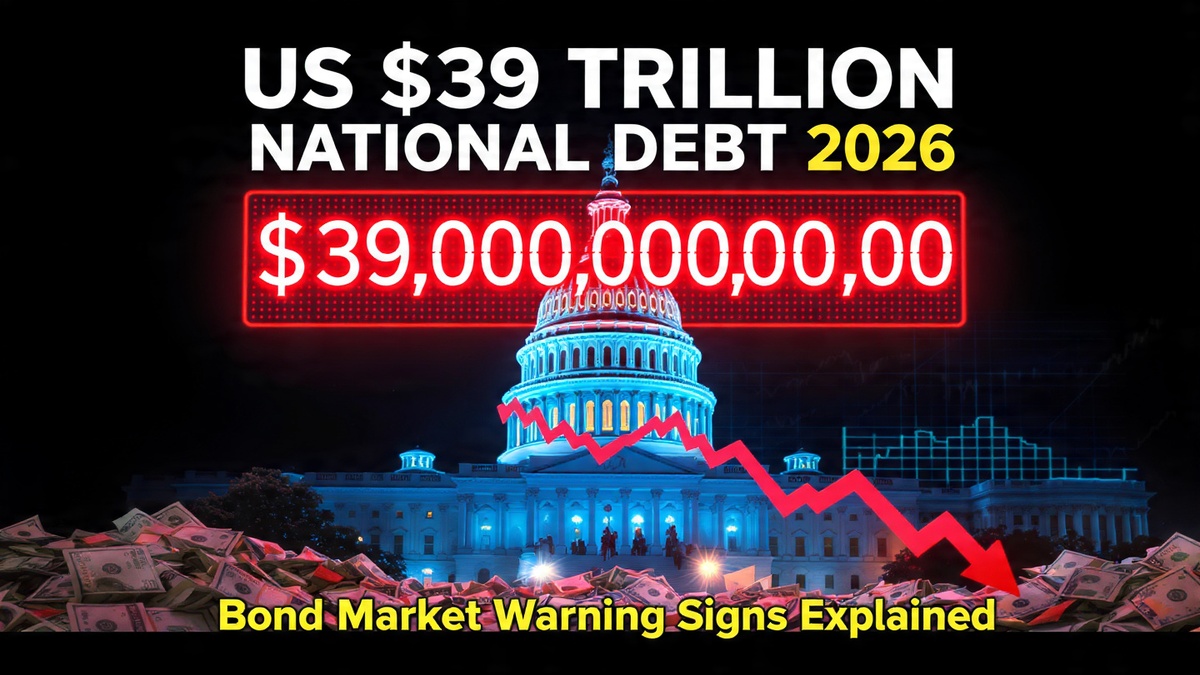
US national debt has crossed $39 trillion, bond yields are spiking, and Treasury auctions are showing soft demand. Here is what the bond market knows that Washington refuses to acknowledge.The United States crossed a number this year that no country in history has ever reached: $39 trillion in total federal debt. Not in inflation-adjusted terms. Not as a percentage of GDP. In raw dollars, the figure that sits on the public ledger of the world’s largest economy grew by $1 trillion in five months and $2 trillion in seven and a half months—and it is not slowing down.
What makes the velocity of that accumulation remarkable is the context in which it occurred. The Iran war added direct military expenditure at a pace that budget analysts said was accelerating. The 2025 tax cuts continued to erode revenue. And rising interest rates—the same rates the Federal Reserve is now signaling it may push higher still—are compounding the cost of servicing all that outstanding debt in a feedback loop that the bond market has quietly begun to price.
What the Auctions Are Saying
The most direct readout of market confidence in U.S. fiscal sustainability is the Treasury auction market, where the government sells new debt every week. Recent auctions have produced signals that bond investors usually describe in muted, technical language—but the direction is consistent.
A recent three-year Treasury auction cleared at 4.192%, well above the 3.965% at the prior auction. Yields rise when demand is soft. Soft demand at U.S. Treasury auctions is not a crisis signal—these are still among the most liquid securities in the world—but the trend line is one that fixed-income analysts at institutions ranging from J.P. Morgan to the Council on Foreign Relations have flagged as requiring close attention.
Foreign investors currently hold just above 30% of the Treasury market. Alarm bells rang briefly after April 2025’s Liberation Day tariffs—when U.S. bonds, equities, and the dollar all sold off together, the rarest of Wall Street trifectas—but subsequent data showed no dramatic reallocation away from Treasuries by foreign holders. That relative stability, however, depends on the continuation of conditions (a strong dollar, a functioning petrodollar system, geopolitical faith in U.S. institutions) that several of those conditions’ own architects now question.
The Interest Payment Problem
Of that $39 trillion, roughly $31.4 trillion is held by the public—the portion traded in financial markets globally. At current yields, the annual interest cost the U.S. government pays is on track to exceed $1 trillion for the first time in the country’s history. That figure is not a forecast. It is an arithmetic consequence of the debt level and the rate environment.
For context: U.S. defense spending in 2026 is approximately $900 billion. The federal government will spend more on interest payments than on the entire military. More than on Medicaid. More than on all discretionary non-defense programs combined. That structural reality constrains fiscal policy in ways that economists at the Deloitte Center for Financial Services have described as the most significant long-term challenge facing the U.S. economy.
“Higher bond yields affect U.S. fiscal dynamics in a number of ways,” analysts at the Council on Foreign Relations noted in their examination of tariff and Treasury interactions. “As interest payments on debt increase and use a greater share of available government funds, policymakers become more constrained around other fiscal priorities. They also can be more challenged when they need to respond to economic shocks.”
Three Credit Downgrades, Zero Course Correction
The United States has now been downgraded by all three major credit ratings agencies: S&P in 2011, Fitch in 2023, and Moody’s in May 2025. Each downgrade arrived with similar language—concerns about fiscal trajectory, political dysfunction over the debt ceiling, and a structural unwillingness to match revenues with spending. Each was followed by a brief market convulsion and then, effectively, nothing. Congress did not respond. The debt continued growing.
That pattern—of consequences being absorbed rather than heeded—is what makes the current moment structurally different from prior debt discussions, according to analysts who study sovereign fiscal crises. In those prior episodes, the U.S. still had room to maneuver: rates were low, the global appetite for dollar-denominated safe assets was rising, and alternative reserve currencies were even less credible than they are today. The margin for error has narrowed on all three dimensions.
The Political Ceiling on Solutions
The challenge is not primarily economic—it is political. Addressing a $39 trillion debt requires some combination of higher revenues, lower spending, or both. In the current Washington environment, tax increases are politically radioactive for one party and spending cuts face equivalent resistance from the other—particularly for the entitlement programs (Social Security, Medicare, Medicaid) that account for the largest share of mandatory outlays.
Markets have not yet priced the national debt as an immediate crisis, as analysts at U.S. Bank noted in their midyear market review: investors continue to watch whether rising debt eventually requires higher interest rates to attract enough Treasury buyers. The passive construction of that sentence—”continue to watch”—captures the market’s posture precisely. It is waiting. It is not yet acting.
The bond market’s message, in the language of Treasury yields and auction results, is being sent in increments rather than in a single shock. Washington is not listening. The question is not whether the message will eventually become impossible to ignore—it is how high rates must rise, and how much growth must slow, before the political system treats the ledger as a constraint rather than an abstraction.
Discover more from The Economy
Subscribe to get the latest posts sent to your email.
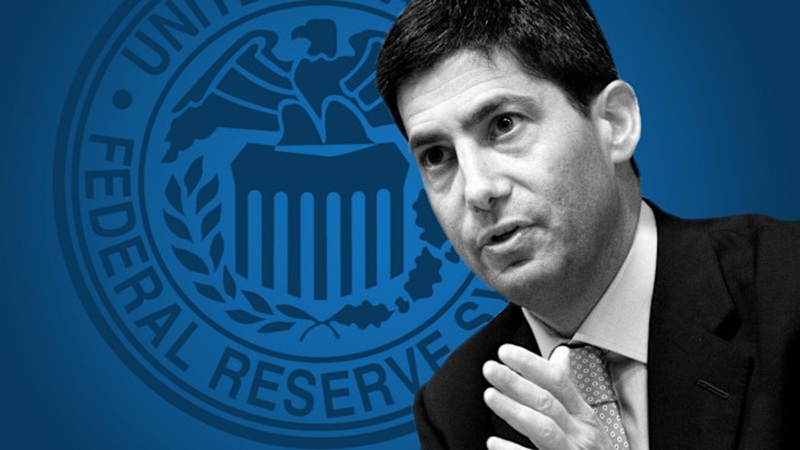
New Fed Chair Kevin Warsh surprised markets with a hawkish stance at his first FOMC press conference. Here’s how his rate-hike signals are rippling through stocks, bonds, mortgages, and gold. The Federal Reserve’s first policy meeting under new Chair Kevin Warsh sent shockwaves through global financial markets on June 17, 2026—not because policymakers moved rates, but because of what nine of them signaled they might do next.
Warsh, appointed by President Trump after months of public attacks on his predecessor Jerome Powell, arrived in Washington carrying expectations of a dovish turn. He had championed rate reductions while angling for the chairmanship, and the White House broadly supported looser monetary conditions. What markets got instead was a coldly hawkish institution that spent the better part of two hours dismantling those assumptions in real time.
The Meeting That Changed the Calculus
The Federal Open Market Committee held the federal funds rate unchanged at its existing range, but nine of 18 committee members penciled in at least one rate hike before year-end in the central bank’s updated Summary of Economic Projections—the dot plot. Six of those nine indicated support for two quarter-point increases. The shift represented a dramatic departure from the March projections, in which no policymaker had envisioned a hike, and the committee as a whole had forecast one cut.
The Dow Jones Industrial Average fell 507 points, or 0.98%, in the session. The S&P 500 lost 1.21% and the Nasdaq Composite dropped 1.34%. Two-year Treasury yields—the instrument most sensitive to near-term rate expectations—jumped 16 basis points to 4.21%, their highest reading in more than a year. Traders scrambled to reprice Fed futures, with CME FedWatch data showing the probability of a September hike jumping to 49% from 27% the previous session.
Warsh’s Statement Was Deliberately Brief—and Deliberately Alarming
The published FOMC statement was unusually short. Warsh stripped language that had previously signaled the Fed’s next move would be a cut and replaced it with a blunt acknowledgment that inflation remains “elevated”—a legacy partly of energy “supply shocks” stemming from the conflict in the Middle East.
“We’ve missed on inflation for five years and we’re going to fix that,” Warsh told reporters. “When we deliver on our price stability objectives—which we will—the American people will feel as though the hardships they’ve been living through are in the rear-view mirror.”
U.S. inflation hit 4.2%—double the Fed’s 2% target and its highest level in three years—leaving the committee little political room to stay passive. Warsh declined to submit a personal rate forecast to the dot plot, an unusual act of institutional reticence that some analysts read as an attempt to preserve maximum flexibility.
Bank of America Changes Its Forecast
Within days, Bank of America overhauled its rate outlook. Analysts at the bank predicted the Fed would raise the benchmark rate by a quarter point three times in 2026, lifting it from the current 3.5%–3.75% range to 4.25%–4.5%. The bank’s prior base case had been for rates to hold steady all year.
“The risk that they might need to raise rates has clearly risen,” said Matthew Luzzetti, chief U.S. economist at Deutsche Bank. BofA analysts acknowledged that Warsh could still be “strategically hawkish”—gaining anti-inflation credibility while actually buying time to cut later—but said the door to that interpretation was closing as incoming data showed persistent price pressure.
The hawkish turn unfolded against an unusual institutional backdrop. Warsh became the first new Fed chairman in more than 70 years to inherit an active predecessor on the governing board. Powell, whose term as chair Warsh replaced, remained as a board governor and voted at the June meeting—a fact that gives every subsequent public utterance from the former chair a level of market weight that Warsh’s team cannot easily ignore.
The Housing Market Reads a New Era
The rate signals carried immediate consequences for American homebuyers. Chen Zhao, head of economics research at Redfin, called it “a new era” and warned that mortgage rates were unlikely to retreat significantly in the near term. Bill Banfield of Rocket Mortgage noted that home sales were responding more to labor market strength than to rate movements and that determined buyers would continue entering the market—though the affordability calculus had shifted.
Vishal Garg, CEO of AI mortgage platform Better, cut to the practical point: “The Fed doesn’t set mortgage rates, but mortgage rates track long-term Treasury yields, which move based on investor expectations for inflation, growth, and the Fed’s next step.”
Warsh has separately announced five internal task forces to examine the Fed’s communication practices, data sources, and inflation-analysis frameworks—a structural reform effort that signals he intends a longer-term overhaul of the institution rather than a cosmetic change of tone.
What Comes Next
The path forward for markets hinges on three variables: whether consumer prices moderate fast enough to make hikes unnecessary, whether the labor market stays strong enough to absorb higher borrowing costs, and whether Warsh can maintain independence from a White House that publicly installed him to cut.
Kristina Hooper, chief market strategist at Man Group, summed up the market’s posture after the meeting: “Markets were holding out hope that Chair Warsh would throw them some kernels of real dovishness that they obviously felt they didn’t get.”
With BofA now projecting a rate corridor that would be the highest since 2007, and with inflation stubbornly running at twice the Fed’s target, the calculation Warsh faces is one no new Fed chair has confronted in a generation: tighten into a White House headwind or validate exactly the critics who warned his appointment was political.
Discover more from The Economy
Subscribe to get the latest posts sent to your email.

Trump Tariffs 2026: Economic Impact, Household Costs & Trade War Outlook

China Economy 2026: Export Boom Masks Property Crisis & Investment Slump

US Inflation 4% May 2026: Is the Worst Over? Fed, Oil Prices

AI Memory Chip Shortage 2026: Nvidia, Apple & What Comes Next

US $39 Trillion National Debt 2026: Bond Market Warning Signs Explained

Ray Dalio US Suez Moment 2026: Dollar Decline, $39 Trillion Debt & Empire’s End

Kevin Warsh Fed Rate Hike 2026: What His Hawkish Pivot Means for Markets

Gold Price 2026: Will Gold Hit $6,000? JPMorgan Forecast, Drivers & Investment Guide

US Recession 2026: Four Key Threats, Warning Signs & How to Protect Your Portfolio

AI Energy Demand 2026: Data Centres, Power Grids & the $725B Infrastructure Boom

AI Semiconductor Selloff 2026: Micron Crash, Nasdaq Pullback & What Comes Next

US Tariffs 2026: How Trump’s 11.7% Effective Rate Is Reshaping Global Trade & Inflation

Global Stock Markets 2026: S&P 500 at Record Highs Amid War, Inflation & Rate Risk

Spain Near 100M Tourists: A Structural Travel Map Shift : Booming Travel Economy

KPMG Australia CEO Resigns After Whistleblower Claims Exposed Investigation Failures

PwC China Partner Payouts Cut Amid Evergrande Audit Fraud

Broadcom Market Value Loss: Revenue Forecast Disappoints

Investors Pile Into Bullish Dollar Bets as ‘US Exceptionalism’ Trade Returns

Here’s How Much It’ll Cost You to Be Part of SpaceX’s Record-Breaking $75 Billion IPO

Nasdaq Tumbles 4% as Chip and Memory Stocks Sink: A $1.2 Trillion Wipeout

How to Fix Pakistan’s Debt Economy: A Structural Blueprint

Smash Capital Leads $200M Funding for Allen Control Systems

Democrats Draw a Red Line Around Military AI — And the Pentagon Is Already Pushing Back

New Investment Super-Cycle: AI, Green Energy & Re-Shoring

Russia Overspends on Putin’s War in Ukraine by $28bn

Xponential Fitness Franchise Lawsuit: The $3.97M Judgment

Middle East Conflict Oil Prices: The $4 Surge Explained

Musk’s SpaceX Lines Up Retail Investors for Record IPO Allocation
-

 Markets & Finance6 months ago
Top 15 Stocks for Investment in 2026 in PSX: Your Complete Guide to Pakistan’s Best Investment Opportunities
-

 Analysis4 months ago
Top 10 Stocks for Investment in PSX for Quick Returns in 2026
-

 Analysis5 months ago
Brazil’s Rare Earth Race: US, EU, and China Compete for Critical Minerals as Tensions Rise
-

 Analysis4 months ago
Johor’s Investment Boom: The Hidden Costs Behind Malaysia’s Most Ambitious Economic Surge
-

 Banks5 months ago
Best Investments in Pakistan 2026: Top 10 Low-Price Shares and Long-Term Picks for the PSX
-

 Investment6 months ago
Top 10 Mutual Fund Managers in Pakistan for Investment in 2026: A Comprehensive Guide for Optimal Returns
-

 Global Economy6 months ago
15 Most Lucrative Sectors for Investment in Pakistan: A 2025 Data-Driven Analysis
-

 Global Economy6 months ago
Pakistan’s Export Goldmine: 10 Game-Changing Markets Where Pakistani Businesses Are Winning Big in 2025